HAL Id: hal-01963242
https://hal.archives-ouvertes.fr/hal-01963242
Submitted on 13 Nov 2020
HAL is a multi-disciplinary open access
archive for the deposit and dissemination of sci-entific research documents, whether they are pub-lished or not. The documents may come from teaching and research institutions in France or abroad, or from public or private research centers.
L’archive ouverte pluridisciplinaire HAL, est destinée au dépôt et à la diffusion de documents scientifiques de niveau recherche, publiés ou non, émanant des établissements d’enseignement et de recherche français ou étrangers, des laboratoires publics ou privés.
based on multiple task-induced activation mapping and
graph analysis of intrinsic connectivity in 144 healthy
right-handers
Loic Labache, Marc Joliot, Jérôme Saracco, Gaël Jobard, Isabelle Hesling,
Laure Zago, E. Mellet, Laurent Petit, Fabrice Crivello, Bernard Mazoyer, et al.
To cite this version:
Loic Labache, Marc Joliot, Jérôme Saracco, Gaël Jobard, Isabelle Hesling, et al.. A SENtence Supramodal Areas AtlaS (SENSAAS) based on multiple task-induced activation mapping and graph analysis of intrinsic connectivity in 144 healthy right-handers. Brain Structure and Function, Springer Verlag, 2019, 224 (2), pp.859-882. �10.1007/s00429-018-1810-2�. �hal-01963242�
https://doi.org/10.1007/s00429-018-1810-2
ORIGINAL ARTICLE
A SENtence Supramodal Areas AtlaS (SENSAAS) based on multiple
task-induced activation mapping and graph analysis of intrinsic
connectivity in 144 healthy right-handers
L. Labache1,2,3,4,5 · M. Joliot1,2,3 · J. Saracco5,6 · G. Jobard1,2,3 · I. Hesling1,2,3 · L. Zago1,2,3 · E. Mellet1,2,3 ·
L. Petit1,2,3 · F. Crivello1,2,3 · B. Mazoyer1,2,3 · Nathalie Tzourio‑Mazoyer1,2,3
Received: 5 March 2018 / Accepted: 1 December 2018 / Published online: 7 December 2018 © The Author(s) 2018
Abstract
We herein propose an atlas of 32 sentence-related areas based on a 3-step method combining the analysis of activation and asymmetry during multiple language tasks with hierarchical clustering of resting-state connectivity and graph analyses. 144 healthy right-handers performed fMRI runs based on language production, reading and listening, both with sentences and lists of over-learned words. Sentence minus word-list BOLD contrast and left-minus-right BOLD asymmetry for each task were computed in pairs of homotopic regions of interest (hROIs) from the AICHA atlas. Thirty-two hROIs were identified that were conjointly activated and leftward asymmetrical in each of the three language contrasts. Analysis of resting-state temporal correlations of BOLD variations between these 32 hROIs allowed the segregation of a core network, SENT_CORE including 18 hROIs. Resting-state graph analysis applied to SENT_CORE hROIs revealed that the pars triangularis of the inferior frontal gyrus and the superior temporal sulcus were hubs based on their degree centrality (DC), betweenness, and participation values corresponding to epicentres of sentence processing. Positive correlations between DC and BOLD activation values for SENT_CORE hROIs were observed across individuals and across regions regardless of the task: the more a SENT_CORE area is connected at rest the stronger it is activated during sentence processing. DC measurements in SENT_CORE may thus be a valuable index for the evaluation of inter-individual variations in language areas functional activity in relation to anatomical or clinical patterns in large populations. SENSAAS (SENtence Supramodal Areas AtlaS), comprising the 32 supramodal sentence areas, including SENT_CORE network, can be downloaded at http://www.gin.cnrs. fr/en/tools /.
Keywords fMRI · Left hemisphere · Sentence · Language production · Reading · Speech comprehension · Intrinsic connectivity · Graph analysis · Right-handers · Resting-state
Abbreviations
aHCA Agglomerative hierarchical cluster analysis
AICHA Atlas of intrinsic connectivity of homotopic areas
AU Approximately unbiased p value BC Betweenness centrality
DC Degree centrality DMN Default mode network FIR Finite impulse response fMRI Functional magnetic resonance
imaging
FWHM Full width at half maximum hROIS Homotopical regions of interest LISNSENT-WORD Sentence minus word-list contrast for
listening task
Electronic supplementary material The online version of this
article (https ://doi.org/10.1007/s0042 9-018-1810-2) contains supplementary material, which is available to authorized users. * Nathalie Tzourio-Mazoyer
nathalie.tzourio-mazoyer@u-bordeaux.fr
1 Univ. Bordeaux, IMN, UMR 5293, 33000 Bordeaux, France 2 CNRS, IMN, UMR 5293, 33000 Bordeaux, France 3 CEA, GIN, IMN, UMR 5293, 33000 Bordeaux, France 4 Univ. Bordeaux, IMB, UMR 5251, 33405 Talence, France 5 INRIA Bordeaux Sud-Ouest, CQFD, UMR 5251,
33405 Talence, France
MNI Montreal Neurological Institute pIndex Participation index
PRODSENT-WORD Sentence minus word-list contrast for
production task
READSENT-WORD Sentence minus word-list contrast for
reading task rs-fMRI Resting-state fMRI SD Standard deviation
SPM Statistical parametric mapping
Introduction
Defining language areas is a complex enterprise because of the numerous possible approaches currently available to identify language-related regions. The gold standard is to consider that language areas correspond to regions wherein lesions lead to aphasia. Even when limiting the definition of language areas to that of essential language areas, dif-ferent identification methods exist that provide various kinds of information. Wada testing allows identification of the hemisphere controlling language but does not provide regional information (Wada and Rasmussen 1960). By con-trast, surgical cortical stimulation studies have documented left hemisphere language areas in large samples of patients (Ojemann et al. 1989; Tate et al. 2014), but such mapping of eloquent areas is still limited to the cortical regions avail-able to the neurosurgeon and is conducted in patients having potentially modified language organization. The probabilis-tic mapping of lesions combined with fine-grained aphasic patient evaluations of language performance have provided the community with very accurate descriptions of essential language areas (Dronkers and Ogar 2004; Dronkers et al.
2004) although this very important approach does not reveal how these cortical areas are organized in networks. Because each multiple cortical area altered by a given pathology is not involved in the language deficit, the comprehensive iden-tification of language areas from lesions is a complex issue [see (Genon et al. 2018a, b) for a review].
Functional neuroimaging provides a way to map multiple areas activated during the completion of various language tasks in a large number of individuals. Furthermore, neuro-imaging methodology is very efficient at compiling results obtained in multiple laboratories across the world, thereby allowing meta-analyses across laboratories that provide the location of areas activated at an acceptable spatial resolu-tion within a common normalizaresolu-tion space for a variety of language tasks. Similar to the results obtained with cortical stimulation (Ojemann et al. 1989), meta-analyses of neuro-imaging data have provided the landscape of the left hemi-sphere cortical areas involved in language tasks in healthy individuals, which covers nearly the entire hemisphere sur-face (Price 2000, 2010, 2012; Vigneau et al. 2006).
Despite the vast amount of information obtained from the methods cited above, an atlas of left hemisphere language areas in healthy individuals having a typical left-hemisphere dominance for language is still lacking, and with respect to language areas, the absence of a consensus is clear. The posterior part of the superior temporal gyrus and the supra-marginal gyrus (Tomasi and Volkow 2012; Klingbeil et al.
2017) are phonological regions that can be found under the label “Wernicke’s area”, while lesion-based studies (Dronk-ers and Ogar 2004; Yourganov et al. 2015) as well as lesion studies in association with activation studies (Saur et al.
2006) have shown deep aphasia associated with lesions of the posterior region of the middle temporal gyrus and supe-rior temporal sulcus (Binder 2015, 2017). There is greater consistency concerning the location of frontal language areas under the label of Broca’s area because its original definition was anatomical. Most people define Broca’s area as the pars triangularis of the inferior frontal gyrus (Clos et al. 2013; Friederici and Gierhan 2013; Yourganov et al.
2015). However, the extent of Broca’s area in the left fron-tal lobe varies, and the anterior insula (Baldo et al. 2011) is sometimes added, as reviewed in Amunts (Amunts and Zilles 2012). Moreover, posterior lesions can also lead to Broca’s aphasia (Richardson et al. 2012), demonstrating that these anterior and posterior language poles work tightly together. This relation enhances the importance of networks in cognitive processing, as defined by Fuster (Fuster and Bressler 2012). An atlas of language areas and networks in healthy individuals would thus be a useful tool, especially when individual task-induced mapping is not available. This atlas would be especially helpful for patients having difficul-ties completing language tasks and for the exploration of genetic language bases in large cohorts of individuals, in cohorts targeting normal or pathological brains, including those with developmental pathologies, and/or in individu-als mapped for their anatomy and/or resting state while not performing a language task (Thompson et al. 2017).
To elaborate such an atlas, increasing the specificity for language areas is important because as uncovered by lesion studies, not all areas revealed by task-induced acti-vation studies are essential language areas. Components of the task, such as monitoring, selecting, and holding the instructions, as well as paralinguistic processing, such as context, emotional and prosodic processing, are responsible for activations that exceed the essential language areas of the left hemisphere. The strong right-hemisphere activations observed with functional imaging during various language tasks have even led some authors to claim that neuroimaging methods are not adequate to map language regions (Sidtis
2007). One way to overcome this issue is using appropri-ate reference tasks. To discriminappropri-ate language areas among those involved in the completion of a given task, Binder has suggested using well-designed reference tasks. The idea is
to remove the non-specific or non-lateralized activations of primary areas and/or executive regions by applying the dif-ference paradigm (Binder 2011). Compared to a non-verbal reference, the use of a verbal reference tasks allows left hemisphere language areas to be specifically highlighted, as shown by Ferstl’s meta-analysis (Ferstl et al. 2008). The use of verbal reference tasks with functional magnetic resonance imaging (fMRI) has proven to successfully measure activa-tion asymmetry, a proxy of language dominance strongly concordant with Wada testing. Note that this is true whether hemispheric or regional asymmetry of activations is used for the evaluation of language hemispheric dominance [review in Dym et al. (2011)].
Thus, asymmetry represents an additional method for increasing the specificity of identifying left hemisphere language areas. Typical language organization, seen in 90% of the healthy population (Mazoyer et al. 2014) and 97% of healthy right-handers (Zago et al. 2017), is characterized by a strong left hemisphere dominance, giving rise to regional leftward asymmetries in fMRI. Adding to the detection of activated areas (by comparison to a high-level verbal refer-ence task), a criterion based on leftward asymmetry would certainly increase the specificity of identifying left hemi-sphere language areas.
Another difficulty in identifying essential language areas with functional imaging is the fact that different tasks lead to different patterns of activation. One way to overcome this difficulty is to combine several language tasks in the same participant and apply conjunction analyses to unravel the activated and asymmetrical regions independent of the type of task or modality involved (Papathanassiou et al. 2000; Jobard et al. 2007; Dodoo-Schittko et al. 2012).
Finally, the task-induced approach does not provide any information on how the different activated areas are organ-ized. The co-activation of a group of regions does not indi-cate that they are all strongly functionally connected and thus constitute a network. Resting-state intrinsic connectiv-ity has proven to be capable of identifying the organization of brain networks underpinning cognitive functions. A good illustration of this concept is provided by Turken and Dronk-ers, who conducted correlation analysis in resting-state images of healthy participants using the posterior middle temporal gyrus region as the seed (Turken and Dronkers
2011). In this work, this seed region was selected because its lesion was associated with strong comprehension deficits in aphasics, and its location was previously identified by probabilistic lesion mapping (Dronkers et al. 2004). Using this approach, Turken et al. revealed a network of areas con-nected at rest that support speech comprehension in healthy individuals. Investigating intrinsic connectivity would thus be an interesting means to investigate the networks exist-ing at rest among the areas activated durexist-ing language tasks. Connectivity measures can provide essential information on
how regions are connected and how they are organized in networks. Graph analysis methodology applied on resting-state connectivity also permits the measurement of the con-nectivity strength of each region with all other regions of a given network to which it belongs, thereby characterizing its role in the network. In particular, identifying the topological roles of the regions is possible, i.e., identifying hubs, regions essential to a given network and therefore essential to the cognitive function(s) they support (Sporns et al. 2007).
To propose an atlas of left hemisphere high-order lan-guage areas, we first combined multiple-lanlan-guage fMRI task-induced activation mapping and conjunction analysis to select a set of both activated and leftward asymmetrical areas during sentence processing. Second, we clustered the regions identified in the first step into networks based on their intrinsic connectivities at rest. Third, we applied graph analysis to characterize the roles of the regions in communi-cation within and across networks. To this end, we utilized BIL&GIN, a database dedicated to the study of hemispheric specialization (Mazoyer et al. 2015), and selected 144 right-handers who were mapped during sentence production, read-ing and listenread-ing tasks compared to the production, readread-ing and listening of lists of words, respectively. All but six par-ticipants were also mapped during the resting state. Most investigations of the resting-state and task-induced activation networks have relied on whole-brain comparisons between the functional connectivities measured in these two con-ditions [review in Wig (2017)], although they correspond to very different physiological states (Raichle and Mintun
2006; Raichle 2015). Here, we aimed to find resting-state markers of left hemisphere activation in discrete language areas to provide a comprehensive tool for further research on the inter-individual variability of language areas. Such markers of language activation are likely to be of interest for studies in which no task-induced activations are docu-mented but instead include a resting-state acquisition. Con-sequently, we used homotopical regions of interest (hROIs) from the AICHA atlas, a functional atlas obtained from intrinsic connectivity analysis (Joliot et al. 2015). We used AICHA hROIs because (1) we needed an atlas suitable for functional imaging and, in that respect, AICHA, which was elaborated from resting-state connectivity, is optimal for analysing functional data; (2) AICHA has been specifically designed to identify functionally homotopic regions of inter-est, enabling the accurate computation of functional asym-metries since it avoids the potential bias that anatomical and functional areas do not strictly overlap. The different sets of hROIs corresponding to the supramodal sentence processing areas of the proposed atlas (SENSAAS) are available in the Montreal Neurological Institute (MNI) space at http://www. gin.cnrs.fr/en/tools /.
Materials and methods
Participants
From the BIL&GIN database, we selected 144 healthy right-handers (72 women) who completed the fMRI battery, including several language tasks (Mazoyer et al. 2015). The sample mean age was 27 years (SD = 6 years), and the women were two years younger than the men (women 26 ± 5; men: 28 ± 7, p = 0.053). The mean educational level of the partici-pants was 16 years (SD = 6 years), with no significant differ-ence between the men and women (p > 0.05). All participants reported themselves as right-handed; their mean normalized finger tapping test asymmetry ([(right number of taps − left number of taps)/(left + right number of taps)] × 100) was 6.25 (SD = 4.3), and their mean Edinburgh score was 93.5 (SD = 11), confirming their right-handedness. There was no difference between gender for the Edinburgh score (p = 0.47), although there was a slightly stronger rightward manual later-ality in women (finger tapping test asymmetry in women: 6.9 ± 3.8; men: 5.7 ± 4.7, p = 0.08, controlling for age).
Of these participants, 138 (mean age 27 years (SD = 6 years), 68 women) also completed a resting-state fMRI (rs-fMRI) acquisition lasting 8 min. Note that this resting-state acquisition was performed on average 9 months (SD = 9.6 months) before the language task acquisition in all but five cases. In these five cases the resting-state acquisition occurred approximately 1 year after the language session [range (11.2–13.8) months].
Image acquisition and processing
Structural imaging
Structural images were acquired using the same 3T Philips Intera Achieva scanner including high-resolution T1-weighted volumes (sequence parameters: TR, 20 ms; TE, 4.6 ms; flip angle, 10°; inversion time, 800 ms; turbo field echo factor, 65; sense factor, 2; field of view, 256 × 256 × 180 mm3;
iso-tropic voxel size 1 × 1 × 1 mm3). For each participant, the line
between the anterior and posterior commissures was identi-fied on a mid-sagittal section, and the T1-MRI volume was acquired after orienting the brain in the bi-commissural coor-dinate system. T2*-weighted multi-slice images were also acquired [T2*-weighted fast field echo (T2*-FFE), sequence parameters: TR = 3,500 ms; TE = 35 ms; flip angle = 90°; sense factor = 2; 70 axial slices; 2 × 2 × 2 mm3 isotropic voxel size].
Task-induced functional imaging
Training To ensure proper task execution, the participants were trained outside the scanner in the hour preceding the
fMRI session. The training used stimuli that were of the same nature but different from those used during the fMRI session.
Language tasks Three runs were administered to the par-ticipants. They included a sentence task involving phono-logical, semantic, prosodic and syntactic processing and a word-list reference task, a less complex, albeit high-level, verbal task. To achieve homogeneity in the sentence task material, 51 line drawings illustrating the stories of ‘Le petit Nicolas’ (Little Nicholas), a classic French children’s series, were used. The three tasks consisted of a randomized alter-nation of event-related trials devoted to sentence process-ing, with event-related trials devoted to the verbal reference task, i.e., lists of words. The drawings used for the refer-ence task were scrambled versions of the line drawings, and the stimuli presented either orally or visually were lists of months, days and/or seasons. Within each trial, the subject was shown either a line drawing or a scrambled drawing for 1 s, immediately followed by a central fixation cross-hair. While fixating the cross, the subject performed either the sentence task or the word reference task. Once the task was completed, a low-level reference task, detecting the transformation of a centrally displayed cross into a square, was presented. When the subjects detected this change, they were asked to press a button with their index finger of the assigned hand. The square was then displayed until the end of the trial. This second part of the trial, which lasted at least half of the total trial duration, aimed at refocusing the sub-ject’s attention to a non-verbal stimulus and controlling for manual motor response activation, which was also present in the first part of the trial. A 12-s presentation of a fixation crosshair preceded and followed the first and last trial. Note that except during the drawings display, the subjects were asked to keep fixating the cross, and the star and square were then presented on the centre of the screen.
Sentence and list of word production tasks During the
production run, after seeing a Little Nicholas line drawing, the subject was instructed to covertly generate a sentence beginning with a subject (The little Nicholas…, The gentle-man…) and a complement (with his satchel…, in shorts…, with glasses…), followed by a verb describing the action taking place and ending with an additional complement of a place (in the street…, in the playground…, on the beach…) or a manner (with happiness…, nastily…). When a scrambled drawing was displayed, the subject was asked to covertly generate the list of the months of the year. The production paradigm randomly alternated ten 18-s trials of sentence generation with ten 18-s trials of generating the list of months. The response time limit, indicated by the trans-formation of the cross in a star, was 9 s, including the 1-s drawing display. The entire experimental run lasted 6 min and 24 s. The mean sentence production time was 5617 ms
(SD = 935 ms), while the mean duration of word-list pro-duction was 5249 ms (SD = 1131 ms).
Sentence and list of word-listening tasks When a
Lit-tle Nicholas line drawing was displayed, the subject was instructed to carefully listen to a sentence dealing with the line drawing and click at the end of the sentence. For the LISN, when a scrambled drawing was displayed, he/she was instructed to listen to the list of the months, days of the week and/or seasons and click at the end of the list.
The paradigm consisted of a randomized alternation of thirteen 14-s sentence-listening trials with thirteen 14-s list-listening trials. The mean durations of auditory presentation were 4371 ± 468 ms for the sentences and 4386 ± 484 ms for the lists. The entire experimental run lasted 6 min and 28 s. The reaction times after sentence and list listening were 387 ms (SD = 125 ms) and 478 ms (SD = 97 ms), respectively.
Sentence and list of word-reading tasks Like in the other
two tasks, when a line drawing was displayed, the subject was instructed to read a sentence based on the line draw-ing. When a scrambled drawing was displayed, he/she was instructed to read the list of months, days of the week and/ or seasons.
The paradigm consisted of a randomized alternation of thirteen 14-s sentence-reading trials with thirteen 14-s list-reading trials. The entire experimental run lasted 6 min and 28 s. The average time for reading sentences was 3729 ms (SD = 567 ms), while reading the lists of words required 4412 ms (SD = 602 ms).
Debriefing the fMRI tasks Right after the fMRI sessions, the participants were asked to rate the difficulty of the task on a five-point scale (1-easy to 5-very difficult) and answer some debriefing questions about how they accomplished the task.
The production task had the highest task difficulty score reported by the participants (2.73), while the reading and listening tasks had low scores (1.14 and 1.20, respectively). All participants were able to recollect the sentence they pro-duced when presented with the corresponding drawing for at least 5 of 10 images (mean = 9.43 images, SD = 0.96), with the mean number of words per sentence being 12.4 (SD = 2).
Functional image acquisition
The functional volumes were acquired as T2*-weighted echo-planar EPI images (TR = 2 s; TE = 35 ms; flip angle = 80°; 31 axial slices with a 240 × 240 mm2 field of
view and 3.75 × 3.75 × 3.75 mm3 isotropic voxel size). In the
three runs, 192, 194 and 194 T2*-weighted volumes were acquired for the sentence production, listening and reading tasks, respectively.
Resting-state functional imaging (rs-fMRI)
Spontaneous brain activity was monitored for 8 min (240 volumes) using the same imaging sequence (T2*-weighted echo-planar images) as that used for the language tasks. Immediately prior to rs-fMRI scanning, the participants were instructed to “keep their eyes closed, to relax, to refrain from moving, to stay awake and to let their thoughts come and go”.
Image analysis
Functional imaging analysis common to task-induced and resting-state acquisitions For each participant, (1) the T2*-FFE volume was rigidly registered to the T1-MRI; (2) the T1-MRI was segmented into three brain tissue classes: grey matter, white matter and cerebrospinal fluid; and (3) the T1-MRI scans were normalized to the BIL&GIN tem-plate including 301 volunteers from the BIL&GIN database (aligned to the MNI space) using the SPM12 “normalise” procedure with otherwise default parameters.
For each of the three fMRI runs, data were corrected for slice timing differences. To correct for subject motion during the runs, all the T2*-weighted volumes were realigned using a six-parameter rigid-body registration. The EPI-BOLD scans were then registered rigidly to the structural T2*-FFE image. The combination of all registration matrices allowed for warping the EPI-BOLD functional scans to the standard space with a single trilinear interpolation.
Specific task-induced functional imaging analysis First, a 6-mm full width at half maximum (Gaussian filter) was applied to each run. Global linear modelling (statisti-cal parametric mapping (SPM), http://www.fil.ion.ucl. ac.uk/spm/) was used for processing the task-related fMRI data. For each participant, BOLD variations correspond-ing to each sentence versus the list belongcorrespond-ing to the same run were computed [sentence minus word-list produc-tion (PRODSENT-WORD), sentence minus word-list reading
(READSENT-WORD), and sentence minus word-list
listen-ing (LISNSENT-WORD)]. Finally, contrast maps (defined at the voxel level) were subjected to hROI analysis. BOLD signal variations were measured in 192 pairs of function-ally defined hROIs of the AICHA atlas (Joliot et al. 2015) adapted to SPM12, excluding 7 hROIs pairs belonging to the orbital and inferior temporal parts of the brain in which signals were reduced due to susceptibility artefacts. For each participant, we computed contrast maps of the three language conditions. We then calculated the right and left hROI BOLD signal variations for each of the 185 remaining pairs by averaging the contrast BOLD values of all voxels located within the hROI volume.
Specific analysis of resting-state functional images Time series white matter and cerebrospinal fluid (individual aver-age time series of voxels that belonged to each tissue class) and temporal linear trends were removed from the rs-fMRI data series using regression analysis. Additionally, rs-fMRI data were temporally filtered using a least squares linear-phase finite impulse response filter design bandpass (0.01– 0.1 Hz).
For each participant and hROI (the same 185 homotopic ROIs as those used in the task-induced analysis), an indi-vidual BOLD rs-fMRI time series was computed by averag-ing the BOLD fMRI time series of all voxels located within the hROI volume.
Part 1: Identification and characterization
of hROIs exhibiting both leftward activation
and leftward asymmetrical activation in all
three tasks
To complete the identification of high-order language areas, we first searched for hROIs that were both significantly co-activated and significantly leftward asymmetrical on aver-age among the 144 participants during the PRODSENT-WORD,
READSENT-WORD, and LISNSENT-WORD tasks.
Statistical analysis
hROI selection
Using JMP14 (http://www.jmp.com, SAS Institute Inc., 2018), conjunction analysis was conducted to select the left-hemisphere hROIs exhibiting BOLD signal variations that were both significantly positive and significantly larger than that in their right counterparts in all three tasks. An hROI was selected whenever it was significantly activated in each of the three task contrasts using a significance threshold set to p < 0.05 per contrast. The significance threshold for the conjunction of activation in the three tasks was thus 0.05 × 0. 05 × 0.05 = 1.25 × 10⁻⁴. The second criterion for hROI
selec-tion was the existence of a significant leftward asymmetry in each of the three task contrasts, the threshold of significance
of this second conjunction being again 1.25 × 10⁻⁴. Finally,
since to be selected, a given hROI had to fulfil both criteria, the overall significance threshold for the conjunction of con-junction analyses was 1.5 × 10−8 = (1.25 × 10⁻⁴)2.
Results
hROI selection
Among the 80 hROIs jointly activated in the 3 contrasts (Table 1), 46 also showed joint asymmetries. In total, 32 hROIs showed both joint activation on the left and joint asymmetry (Fig. 1; Table 2).
On the lateral surface of the left frontal lobe, the regions having both joint activation and leftward asymmetry dur-ing the three language tasks covered the left inferior frontal gyrus (pars triangularis: F3t and pars opercularis: F3O1), the adjacent inferior frontal sulcus (f2_2), the junction of the middle frontal gyrus with the precentral sulcus (prec4), and the upper part of the precentral sulcus (prec3) located dorsally to prec4. The medial part of the superior frontal gyrus (F1_2), the upper paracentral gyrus (pCENT4), and the pre-superior motor areas (SMA2 and SMA3) were also part of these areas in the medial frontal lobe. Two hROIs were located within the anterior insula (INSa2 and INSa3), while the INSa1 hROI was located medially and ventrally close to the amygdala. On the lateral surface of the temporal lobe, the hROIs overlapped the entire length of the superior temporal sulcus (STS2, STS3 and STS4), extending to the temporal pole anteriorly (STS1), to the superior temporal gyrus dorsally (T1_4), to the supramarginal (SMG7) and angular gyri (AG2) posteriorly, crossing the middle temporal gyrus (T2_3 and T2_4) and joining the inferior temporal gyrus (T3_4), the inferior occipital gyrus (O3_1), and ven-trally the fusiform gyrus (FUS4). Regions located within the hippocampus (HIPP2), parahippocampal gyrus (pHIPP1) and amygdala (AMYG) were also part of the selected areas. In the posterior medial wall, the dorsal part of the precuneus (PRECU6) together with the posterior cingulum (CINGp3) were selected using this approach. Sub-cortical areas jointly activated and leftward asymmetrical during the three tasks
Table 1 Results of conjunction analyses across each sentence minus word-list contrasts for production (PRODSENT-WORD), listening (LISNSENT-WORD) and reading (READSENT-WORD) tasks in terms of the number of hROIs
Numbers of hROIs with significant left activation, leftward asymmetry or conjunction of activation and asymmetry for the three “sentence minus word” contrasts
L activation L asymmetry Conjunction of activation and asym-metry
PRODSENT-WORD 133 93 75
LISNSENT-WORD 116 73 64
READSENT-WORD 97 60 43
Fig. 1 Locations of the 32 hROIs co-leftward activated and co-left-ward asymmetrical during the completion of 3 sentence minus word-list tasks by 144 healthy right-handers and corresponding networks after hROI clustering based on resting-state connectivity. a Left lat-eral view of 3D surfaces rendering the 32 hROIs on the BIL&GIN display template in the MNI space with Surf Ice software (https :// www.nitrc .org/proje cts/surfi ce/). b Representation of hROIs on left
hemisphere axial slices from the BIL&GIN display template; the hROI numbers correspond to the z-axis in the MNI space. c Lateral and medial views of the three identified networks. SENT_CORE net-work: red, SENT_MEM: light blue and SENT_VISU: green. Cor-respondences between the abbreviations and the full names of the AICHA atlas can be found in Table 2
covered almost the entire putamen (PUT2 and PUT3) and a thalamic hROI located medially (THA4).
Part 2: Identification of networks based
on the resting‑state connectivity matrix
of the 32 hROIs co‑activated and co‑leftward
asymmetrical during the 3 sentence
minus word‑list tasks
In a second step, we investigated the intrinsic functional organization of the 32 hROIs selected in the first step. We computed the intrinsic connectivity matrix between these 32 hROIs for the subsample of 138 right-handed participants
who completed a resting-state acquisition. We completed a hierarchical clustering analysis of this intrinsic connectivity matrix to identify temporally coherent networks within this set of hROIs.
Methods
Calculation of the intrinsic connectivity matrix
An intrinsic connectivity matrix was calculated for each of the 138 individuals and for each of the 496 possible pairs of hROIs (N × (N − 1))/2, with N = 32). The intrinsic con-nectivity matrix off-diagonal elements were the Pearson correlation coefficients between the rs-fMRI time series of
Table 2 Names and abbreviations of the 32 hROIs showing joint left activation and left asymmetry during the three sentences minus word-list contrasts for production (PRODSENT-WORD), listening
(LISNSENT-WORD) and reading (READSENT-WORD) tasks; the network label to which they were clustered; and their coordinates in MNI space after SPM12 normalization of the AICHA atlas
AICHA hROI name Abbreviation Cluster X (mm) Y (mm) Z (mm)
Frontal and insula S_Precentral-3 prec3 SENT_MEM − 18.2 − 8.7 69.3
S_Precentral-4 prec4 SENT_CORE − 42.2 0.7 49.9
G_Frontal_Sup-2 F1_2 SENT_CORE − 11.9 46.5 41.4
S_Inf_Frontal-2 f2_2 SENT_CORE − 43.1 14.8 29.4
G_Frontal_Inf_Tri-1 F3t SENT_CORE − 49.4 25.6 4.7
G_Frontal_Inf_Orb-1 F3O1 SENT_CORE − 42.2 30.5 − 16.9
G_Insula-anterior-1 INSa1 SENT_VISU − 20.3 5.0 − 19.3
G_Insula-anterior-2 INSa2 SENT_CORE − 33.8 16.8 − 12.7
G_Insula-anterior-3 INSa3 SENT_CORE − 33.7 23.7 0.6
Temporal and parietal G_Temporal_Sup-4 T1_4 SENT_CORE − 58.7 − 23.3 3.7
G_Temporal_Mid-3 T2_3 SENT_CORE − 61.0 − 35.0 -4.8 G_Temporal_Mid-4 T2_4 SENT_CORE − 53.1 − 59.4 7.0 G_Temporal_Inf-4 T3_4 SENT_VISU − 50.0 − 60.6 − 7.6 S_Sup_Temporal-1 STS1 SENT_CORE − 49.7 14.0 − 21.5 S_Sup_Temporal-2 STS2 SENT_CORE − 54.9 − 7.2 − 12.8 S_Sup_Temporal-3 STS3 SENT_CORE − 54.7 − 33.0 − 1.7 S_Sup_Temporal-4 STS4 SENT_CORE − 56.5 − 48.4 13.4 G_SupraMarginal-7 SMG7 SENT_CORE − 55.2 − 51.7 25.5
G_Angular-2 AG2 SENT_CORE − 37.5 − 70.4 39.5
G_Occipital_Inf-1 O3_1 SENT_VISU − 48.4 − 69.0 − 4.3
G_Fusiform-4 FUS4 SENT_VISU − 43.1 − 49.8 − 17.4
G_ParaHippocampal-1 pHIPP1 SENT_VISU − 15.7 − 4.0 − 18.4
G_Hippocampus-2 HIPP2 SENT_MEM − 24.9 − 32.5 − 2.7
Internal surface G_Supp_Motor_Area-2 SMA2 SENT_CORE − 10.6 18.2 63.1
G_Supp_Motor_Area-3 SMA3 SENT_CORE − 7.2 7.6 65.6
G_Paracentral_Lobule-4 pCENT4 SENT_MEM − 6.4 − 29.2 75.9
G_Cingulum_Post-3 CINGp3 SENT_MEM − 5.1 − 42.9 10.0
G_Precuneus-6 PRECU6 SENT_MEM − 7.4 − 61.3 64.1
Sub-cortical N_Amygdala-1 AMYG SENT_VISU − 21.9 − 0.4 − 11.5
N_Thalamus-4 THA4 SENT_MEM − 3.2 − 14.4 8.4
N_Putamen-2 PUT2 SENT_VISU − 23.3 6.3 0.8
the hROI pairs. The intrinsic connectivity matrix diagonal elements were set to zero because no information on the cor-relation for a specific hROI with itself exists (Rubinov and Sporns 2010). The individual intrinsic connectivity matrix was then Fisher z-transformed before being averaged over the subsample of 138 individuals, thereby producing a mean intrinsic connectivity matrix.
Identification and characterization of networks
The agglomerative hierarchical cluster analysis (aHCA) method was applied to extract brain networks from this mean intrinsic connectivity matrix. We first transformed the Pearson correlation (ri,j) between hROI i and hROI j
into a distance (di,j) using the equation di,j = (1 − ri,j)/2, as
in Doucet et al. (2011), resulting in a 32 × 32 dissimilarity matrix. According to Lance and Williams (1979), the pre-vious equation is “unequivocally the best” to transform a correlation into a distance on real data sets. Finally, we used an agglomerative hierarchical clustering algorithm [aHCA, (Sneath and Sokal 1973)] for clustering and the Ward dis-tance (Ward 1963) for aggregating the different hROIs into clusters. The number of clusters (networks) was determined using the R library NbClust (Charrad et al. 2014). This package provides 30 statistical indices for determining the optimal number of clusters and proposes the best clustering scheme from the different results obtained by varying all combinations of number of clusters for the chosen method, in this case, aHCA with Ward’s distance. We chose the num-ber of clusters that fulfilled a maximum of indices.
To characterize each network, we calculated its mean volume activation for each task contrast as the sum of the activations of all hROIs composing the network weighted by their individual volume and then divided by the sum of their volumes. The same computation was performed for the right hemisphere equivalent of each network, which was then used for computing the left-minus-right asymmetry of each net-work activation. We then compared activation amplitude and asymmetry values across networks and across tasks using a mixed-model ANOVA.
Reliability of the network identification across individuals
We used multiscale bootstrap resampling (Efron et al. 1996) to assess the reliability of the identification of each cluster. In total, 10,000 multiscale bootstrap resampling datasets, including 50–140% of sample data from the 138 participants, were processed. Applying the R package “pvclust” (Suzuki and Shimodaira 2006) function to the multiscale bootstrap resampling outputs, we measured the approximately unbi-ased (AU) p value for each cluster. The AU p value for a network, the probability of this network occurring among the 138 participants, indicates the network’s reliability.
Robustness of the networks identification with respect to the clustering method
We also assessed the robustness of the clustering method by comparing its output to those of three other clustering methods: aHCA with the average distance method (instead of Ward’s), Gaussian mixture model, and k-means (see sup-plementary material). Gaussian mixture modelling was conducted with the “Rmixmod” package with Normalized Entropy Criterion to find well-separated clusters and with a Gaussian model with diagonal variance matrices (Lebret et al. 2015).
We then compared the four different partitions through the adjusted Rand index (Hubert and Arabie 1985) allow-ing to get a similarity measure between two different clas-sifications, an adjusted Rand index of 1 indicating similar partitions.
Temporal correlation across networks and significance
To compute the mean intrinsic functional correlations between two networks, we used the same methodology as that used to compute the mean intrinsic connectivity matrix (see above).
First, for each individual and for each network, we com-puted the corresponding rs-fMRI time series by averaging the individual resting time series of all voxels of all hROIs belonging to this network.
Then, for each individual, we computed the Pearson cor-relation coefficients between all pairs of networks that we further Fisher z-transformed. Finally, each of these z-trans-formed coefficients was averaged across the sample of 138 individuals, providing a mean intrinsic functional correla-tion (r) for each pair of networks. We assessed the signifi-cance of each of these mean intrinsic functional correlations compared to 0 using a non-parametric sign test at the 0.05 significance level (Bonferroni correction for the number of network pairs).
Results
Identification and characterization of networks
Hierarchical clustering analysis revealed three networks from the selected set of 32 hROIs (Fig. 2).
SENT_CORE network The first network (Fig. 1c, red), termed SENT_CORE, was composed of 18 hROIs and was the most distant from the 2 others in terms of inertia. SENT_CORE included all lateral and medial hROIs of the frontal lobe, apart prec3, pCENT4 and anterior insula INSa2 and INSa3. SENT_CORE also included all temporal and parietal hROIs
of the lateral surface, except T3_4, which was aggregated with the network gathering visual hROIs.
We named this network SENT_CORE because it included essential sentence processing regions, as further described below. SENT_CORE was the largest network in terms of volume, as it was 9.2 times larger than SENT_MEM and 3.4 times larger than SENT_VISU (Table 3).
SENT_VISU network This group of clusterized areas included the inferior temporal and occipital gyri laterally (T3_4, O3_1); the mid-fusiform (FUS4) ventrally; the par-ahippocampal region; the amygdala (AMYG) and INSa1, close to the amygdala medially (Fig. 1c, green); and the two hROIs of the putamen (PUT2 and PUT3). We labelled it
SENT_VISU because it aggregated four hROIs acknowl-edged as involved in visual processing.
SENT_MEM network This network (Fig. 1c, light blue)
included three regions of the medial wall—the paracentral gyrus (pCENT4), the precuneus (PRECU6) and the poste-rior cingulate (CINGp3)—and the posteposte-rior part of the hip-pocampus (HIPP2) as well as one frontal area at the upper end of the precentral sulcus (prec3) and the THA4 hROI located medially in the thalamus. We named it SENT_MEM because these posterior areas belong to both the posterior regions of the DMN involved in the posterior hippocampus in episodic memory, as further discussed below.
Fig. 2 Results of the agglomerative hierarchical cluster analysis method. a Dendrogram of aHCA of the mean intrinsic connectivity matrix (SENT_CORE network: red, SENT_MEM: light blue, SENT_ VISU: green). Approximately unbiased p values are indicated for
each identified network. b Scree plot of aHCA of the mean intrinsic connectivity matrix. For both graphs, the red horizontal line corre-sponds to the threshold applied to select the number of networks
Table 3 Mean volumetric activation (and standard deviation) of the four language networks in each sentence minus word-list contrast for pro-duction (PRODSENT-WORD), listening (LISNSENT-WORD) and reading (READSENT-WORD) tasks in 144 healthy right-handers
The mean volumetric activation for a network was calculated from the sum of the activations of the hROIs comprising the network weighted by their individual volumes and then divided by the volume of the network
Volume (mm3) Left activation Leftward asymmetry
PRODSENT-WORD LISNSENT-WORD READSENT-WORD PRODSENT-WORD LISNSENT-WORD READSENT-WORD
SENT_CORE 83,232 0.73 ± 0.31 0.43 ± 0.20 0.55 ± 0.26 0.41 ± 0.22 0.25 ± 0.14 0.28 ± 0.19
SENT_MEM 9024 0.40 ± 0.36 0.28 ± 0.23 0.21 ± 0.26 0.11 ± 0.17 0.08 ± 0.12 0.07 ± 0.14
Profile comparisons between networks
In terms of mean voluminal activity (Table 3), ANOVA revealed a significant network effect, a task effect and a network × task interaction (all post hoc Tukey’s HSD:
p < 10−4).
The interaction occurred because while in SENT_CORE, there was greater activation in PROD, followed by READ and then by LISN (all p < 10−4), SENT_MEM and SENT_
VISU had different profiles. Although the greatest activa-tion values were also observed during PROD (all p < 0.003), activation values were significantly higher during LISN than during READ in both networks (SENT_VISU: p = 0.01; SENT_MEM: p = 0.0067).
ANOVA on asymmetries also revealed a significant net-work effect, a task effect and a netnet-work × task interaction (all post hoc Tukey’s HSD: p < 10−4). The interaction was
due to different profiles of asymmetry in SENT_CORE than in the two other networks. In SENT_CORE, the profile of asymmetries was the same as that of activation: larger in PROD, followed by READ and then by LISN (all post hoc Tukey’s HSD: p < 10−4). In SENT_VISU, the asymmetry
during PROD was slightly larger than that during READ (SENT_VISU: p = 0.0005; SENT_MEM: p = 0.01) and larger than that during LISN (p = 0.0001). In addition, there was no difference in asymmetry between PROD and LISN in SENT_MEM (p = 0.075) and no difference in asymme-try between READ and LISN in SENT_VISU (p = 0.52) or SENT_MEM (p = 0.25). The task main effect was related to larger asymmetries in PROD and the network main effect to larger asymmetries in SENT_CORE (all p < 0.0001).
Assessing the reliability of the identification of 3 networks across individuals in the 138 participants
The AU p values provided by the multiscale bootstrap resa-mpling method showed that each network of the first parti-tion was reliable at levels of 93%, corresponding to SENT_ CORE on one side and to the SENT_VISU and SENT_MEM on the other side (Fig. 2). However, for the second partition, SENT_VISU and SENT_MEM were reliable at 73% and 61%, respectively, indicating a lower reliability.
Robustness of the identified networks with respect to the clustering method
The SENT_CORE network was identified by all 4 cluster-ing methods, includcluster-ing at least 13 of the 18 hROIs initially found with the aHCA method using Ward’s distance (see supplementary Table 1). The aHCA method using the aver-age distance metric led to an adjusted Rand index of 1, indi-cating a clustering similar to that achieved using the aHCA method with Ward’s distance. Comparing the Gaussian
Mixture Model and aHCA methods led to an adjusted Rand index of 0.76, indicating two highly similar partitions. Com-paring the aHCA and k-means methods led to the lowest adjusted Rand index of 0.43.
Only one hROI of SENT_CORE (AG2) was segregated in SENT_MEM by Gaussian mixture modelling and by
k-means, while all 17 other hROIs were classified together
by all clustering methods but k-means (supplementary Table 1), although PUT3 joined SENT_CORE accord-ing to Gaussian mixture modellaccord-ing. k-means classified INSa3, T2-4, T1-4 and f2-2 in SENT_VISU rather than in SENT_CORE.
Only prec3 was classified in SENT_VISU rather than SENT_MEM with both Gaussian mixture modelling and
k-means, while pHIPP1 shifted from SENT_VISU to
SENT_MEM only with k-means.
Temporal correlation across networks and significance
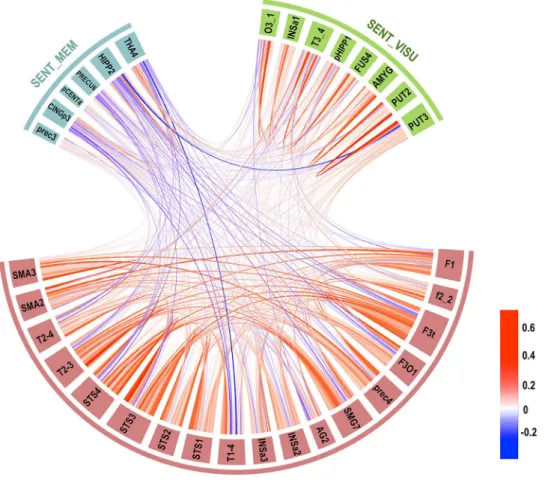
The chord diagram shown in Fig. 3 describes the average correlations between each pair of hROIs in the three net-works. Strong and highly significant negative mean intrinsic correlations were found between SENT_CORE and SENT_ MEM (R = − 0.27; 92.03% of the participants showed a negative correlation, p < 10−4), and a positive
correla-tion was present between SENT_MEM and SENT_VISU (R = 0.058, 62.32% of the participants showed a positive cor-relation, p = 0.0024), while there was no significant correla-tion between SENT_CORE and SENT_VISU (R = − 0.037; 56.52% of the participants showed a positive correlation,
p = 0.074).
Part 3: Graph theory analysis of the SENT_
CORE network
We applied graph theory analysis to the SENT_CORE hROI pairwise correlation matrix, including only positive correla-tions since the inclusion of negative correlacorrela-tions in graph theory analysis remains controversial (Rubinov and Sporns
2010). Note that the graph theory analysis of intra-network communication was completed for only SENT_CORE, as the other two networks had too few nodes.
Statistical analysis
Identification of hubs using graph analysis metrics of the networks
Measurements of weighted centrality We measured the
CORE network, corresponding to the sum of the strength of the positive correlation of each node (hROI). DC can thus be interpreted as the amount of information that a given hROI receives from the hROIs to which it is directly connected, i.e., the DC measures the importance of a given hROI within its network according to the number and strength of interac-tions it undergoes with the other hROIs.
The betweenness centrality (BC) was also measured for SENT_CORE as defined by Opsahl et al. (2010). The BC of an hROI can be interpreted as the participation rate of that hROI in the set of shortest paths between any pair of nodes within the network; i.e., BC measures the dependence of the network on a specific hROI for its communication.
Hub definition and clustering To discriminate hubs among SENT_CORE, we applied a combination of Sporns et al. (2007) and van den Heuvel et al. (2010) definitions. We considered that an hROI had the properties of a hub when its DC and BC values were larger than the means plus one standard deviation of the DC and BC values of the hROI set in the network.
To assess whether the hubs identified in SENT_CORE participated in communication with the other two networks or whether its communication was only intra-SENT_CORE,
we calculated the participation index (pIndex) criteria as defined by Guimera (Guimera and Amaral 2005). hROIs having the 15% highest pIndex values were considered con-nector hubs (i.e., between networks) (van den Heuvel and Sporns 2011), while the other hROIs corresponded to pro-vincial hubs, i.e., an hROI communicating with only its own network.
Investigation of the relationship between intrinsic
connectivity and activation measured during the language tasks
Relationships between DC and BOLD variation at the hROI level We investigated whether an hROI exhibiting high intrinsic connectivity with other areas of the SENT_CORE was more activated during language tasks. For this, we performed a MANCOVA with repeated measures with a TASK main effect, a DC main effect and a DC by TASK interaction. Correlations values and corresponding p val-ues between the DC and activation were computed for each hROI and each task.
To test the specificity of this relationship, we completed similar MANCOVA with DC measurements obtained for the 185 hROIs of the AICHA atlas covering the entire
Fig. 3 Chord diagram of the temporal correlation across each hROI composing the three networks averaged in the whole group. Abbreviations for hROIs of the AICHA atlas can be found in Table 2 (colour scale goes from red for positive correlation to blue for negative correlations, and the line width indicates the strength of the correlation)
left hemisphere. Therefore, the DC values were com-puted considering the connections of hROIs belonging to SENT_CORE with all other hROIs of the left hemisphere. This analysis made it possible to more deeply characterize whether the relationship between the DC and activation dur-ing the language tasks was specific to the essential language network intrinsic connectivity or whether this relationship was held at the hemispheric level.
Relationships between the DC measured in the SENT_CORE network and BOLD variation upon pooling all hROIs and par-ticipants To test whether the relationship previously
iden-tified between DC and BOLD signal variation for each hROI of SENT_CORE was a general property that could be extrapolated to any hROI of any participant, we applied the method proposed by Buckner for evaluating the relation-ship between DC and beta-amyloid accumulation in Alzhei-mer’s disease (Buckner et al. 2009). Correlation coefficients obtained for the three tasks between DC values and BOLD variations were compared using the R package “cocor” (Diedenhofen and Musch 2015) to determine whether there was any difference across language tasks.
Results
Graph analysis of SENT_CORE
Sample distributions of DC and BC values DC variation across the hROIs spanned from 2.24 to 6.48 (Table 4), and the DC standard deviation was very consistent across hROIs ranging from 1.17 to 1.79.
By contrast, BC variation across the hROIs spanned from 0.72 to 18.98 (Table 4). Notably, only 3 hROIs had low num-bers of BC null values across the sample of 138 participants: F3t, STS3 and STS4 (1%, 6% and 2% null values, respec-tively, Table 4).
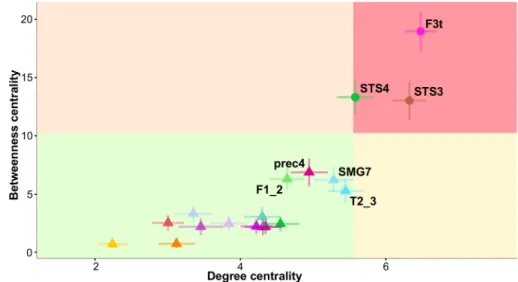
Hub identification and characterization Three hROIs corre-sponded to the hub definition, i.e., BC and DC values above the chosen significance thresholds (mean + SD) of 10.26 and 5.55, respectively (Table 4). The first hROI (F3t) was located in the frontal lobe, and the other two were located in the posterior third of the STS (STS3 and STS4). The BC values of these 3 hubs were over 11, and their DC values were over 5.5, with F3t having the strongest values (Fig. 4; Table 4). Note that no other hROI exhibited a supra-thresh-old value for any of the centrality indices.
Table 4 Betweenness and degree centrality of SENT_CORE hROIs
The means and standard deviations (SD) of the betweenness centrality (BC) and degree centrality (DC) were computed by averaging the BC and DC values of each participant for each SENT_CORE hROI. For BC, the percentage of null values is based on the number of BC values at zero among the 138 subjects for one hROI. For DC, the skewness, kurtosis and Shapiro–Wilk normality test (p norm) correspond to information regarding the normality of the DC distribution for each hROI. A value above 0.05 for the Shapiro–Wilk normality test indicates that the DC was normally distributed. hROIs in bold are those we found to be hubs
AICHA hROI Betweenness centrality Degree centrality
Mean SD % Null values Mean SD Skewness Kurtosis p norm
Frontal and insula prec4 6.88 7.00 11 4.94 1.50 − 0.07 − 0.24 0.87
F1_2 6.30 5.42 17 4.64 1.40 0.28 − 0.32 0.27 f2_2 3.33 4.45 37 3.35 1.53 0.60 − 0.42 0.0002 F3t 18.98 9.77 1 6.48 1.26 − 0.06 − 0.29 0.78 F3O1 2.18 4.04 54 4.31 1.50 0.50 − 0.02 0.018 INSa2 2.49 3.66 43 3.84 1.46 0.27 − 0.23 0.14 INSa3 2.54 3.98 40 3.01 1.29 0.76 0.63 0.0005
Temporal and parietal T1_4 0.75 2.19 77 3.12 1.47 0.56 − 0.20 0.0012
T2_3 5.28 5.96 29 5.44 1.43 0.05 − 0.17 0.71 T2_4 2.21 4.28 58 3.46 1.79 0.24 − 0.60 0.074 STS1 2.46 3.57 41 4.55 1.52 − 0.10 − 0.18 0.44 STS2 3.07 4.85 41 4.30 1.44 0.14 − 0.58 0.11 STS3 13.04 9.66 6 6.32 1.36 − 0.36 0.23 0.088 STS4 13.33 8.25 2 5.58 1.51 0.09 − 0.22 0.95 SMG7 6.23 6.86 22 5.28 1.60 − 0.21 − 0.64 0.037 AG2 0.72 1.65 71 2.24 1.17 0.88 1.11 0.0002
Internal surface SMA2 2.21 3.58 46 4.35 1.33 0.33 − 0.09 0.32
Concerning the pIndex, hubs were defined as the top 15% of the highest index (pIndex ranging from 0.587 to 0.989). Five hROIs were thus defined as connector hubs: T2_3 (pIn-dex = 0.989), F3t (pIn(pIn-dex = 0.987), F1_2 (pIn(pIn-dex = 0.984), STS3 (pIndex = 0.983) and SMA2 (pIndex = 0.983).
Note that the centrality hubs F3t and STS3 were also connector hubs, meaning that they are important for both communication among the three different networks and for communication within the SENT_CORE network.
Note that T2_3 was a connector hub characterized by high DC and BC values (Table 4), although it did not meet the criteria to be labelled as a centrality hub (Fig. 4).
Relationship between the DC at rest and activations during the language tasks in the SENT_CORE network Relationship at the individual hROI level Using DC values computed from only SENT_CORE hROIs, we observed sig-nificant positive correlations between activations during the 3 language tasks and these DC values in 12 hROIs among the 18 constituting SENT_CORE together with a trend for PREC4 and f2_2 (Table 5). Among these hROIs, DC values were positively correlated with activations during the lan-guage tasks and the R value varied between 0.17 and 0.33. Moreover, in 8 of these 12 hROIs, there was no DC by Task interaction, meaning that the correlation between the DC and activation did not differ between the tasks. In the f2_2, INSa2, INSa3, T1_4 and SMG7 hROIs, a significant DC by Task interaction was observed. In f2_2, the interaction was due to non-significant correlation for the production task contrast, while the correlation was strong and signifi-cant for the reading and listening task contrasts. In INSa2, INSa3 and T1_4, the interaction was due to non-significant correlation for the listening task, while there were strong and significant correlations for production and reading. In
SMG7, the interactions were due to a lower correlation dur-ing listendur-ing (Table 5).
The results obtained using DC values computed from the entire set of 185 left hemisphere hROIs were strikingly dif-ferent. There was a significant main effect of the DC in only 2 hROIs (F3t and SMG7, see supplementary Table 2), mean-ing that, except for these two regions, the strength of the correlation when the DC was calculated across the hROIs of the entire hemisphere did not explain the activation vari-ations in SENT_CORE hROIs.
Relationship at the global level using all participants and hROIs There was a significant correlation between the DC values and BOLD variations measured in each of the 3 tasks when considering the 18 SENT_CORE hROIs and the 138 participants in a single analysis (Fig. 5) for each task. The coefficient correlation values were 0.158, 0.216 and 0.294 for sentence production, sentence listening and sen-tence reading, respectively. The correlation for reading was significantly larger than that for both listening (p = 0.0025) and production (p = 0.0075), and the latter two were not sig-nificantly different (p = 0.80).
Summary of results
Conjunction analysis of left-activated and leftward asym-metrical hROIs in 144 right-handed participants performing three language tasks (PRODSENT-WORD, READSENT-WORD and LISNSENT-WORD) uncovered a set of 32 supramodal regions
involved in lexico-syntactic processing. The hierarchical bot-tom-up clustering of the intrinsic connectivity between these 32 hROIs led to the identification of 3 networks, including a network of essential language areas (SENT_CORE) with strong positive correlations at rest across its 18 hROIs in more than 90% of the participants. The two other identified
Fig. 4 Plot of degree centrality (DC) versus betweenness cen-trality (BC) in SENT_CORE. The mean plus standard devia-tion values of DC and BC define the quadrants. hROIs located in the superior right quadrant are hubs. Abbreviations for the hROIs of the AICHA atlas can be found in Table 2
networks had lower inter-individual consistency, one includ-ing visual language areas at the interface between visual and syntactic processing (SENT_VISU) and the other includ-ing posterior DMN areas includinclud-ing posterior hippocampus (SENT_MEM). Intrinsic connectivity analysis showed that SENT_CORE was negatively correlated with SENT_MEM but was not correlated with SENT_VISU. Graph analysis metrics obtained for the SENT_CORE network revealed that F3t, STS3, and STS4 were hubs of both degree and
betweenness centrality, and F3t and ST3 were also hubs of participation, meaning that these are key areas for both intra-network communication and inter-network commu-nication between SENT_CORE and the other 2 networks. Importantly, a positive correlation across individuals was observed between the DC measured at rest and the strength of activation in most SENT_CORE regions, meaning that participants with higher DC values in a given region had higher activations than participants with lower DC values.
Table 5 Correlation analysis between the degree centrality measured in the SENT_CORE network and the mean activation in each of the three language tasks
Correlations (R) were calculated within each hROI of the left hemisphere constituting the SENT_CORE network, and the DC values were calcu-lated in the SENT_CORE network. hROIs with a * are those with significant correlations between activation and DC values (p < 0.05)
AICHA hROI MANCOVA PRODSENT−WORD LISNSENT−WORD READSENT−WORD
DC DC*Task R p R p R p
Frontal and insula prec4 0.072 0.84 0.066 0.44 0.163 0.056 0.146 0.088
F1_2* 0.0065 0.24 0.181 0.033 0.116 0.18 0.206 0.016 f2_2 0.092 0.0008 − 0.115 0.18 0.229 0.0068 0.248 0.0034 F3t* < 0.0001 0.35 0.264 0.0018 0.255 0.0025 0.245 0.0037 F3O1* 0.02 0.75 0.161 0.060 0.196 0.022 0.113 0.19 INSa2* 0.0025 0.032 0.200 0.019 0.072 0.40 0.267 0.0015 INSa3* 0.0006 0.017 0.231 0.0063 0.037 0.67 0.289 0.0006
Temporal and parietal T1_4* 0.0006 0.0008 0.316 0.0002 0.026 0.77 0.260 0.0021
T2_3* 0.009 0.06 0.266 0.0016 0.173 0.043 0.210 0.013 T2_4* 0.0008 0.21 0.124 0.15 0.183 0.032 0.261 0.0020 STS1* 0.0002 0.27 0.289 0.00060 0.228 0.0073 0.231 0.0064 STS2 0.67 0.33 0.084 0.33 − 0.028 0.75 0.033 0.70 STS3* 0.021 0.36 0.198 0.020 0.153 0.073 0.140 0.10 STS4* 0.0010 0.08 0.250 0.0032 0.187 0.028 0.283 0.0008 SMG7* < 0.0001 0.007 0.329 0.0001 0.204 0.016 0.303 0.0003 AG2 0.41 0.78 0.009 0.92 0.091 0.29 0.065 0.45
Internal surface SMA2 0.28 0.058 0.095 0.27 − 0.061 0.48 0.149 0.082
SMA3 0.16 0.66 0.111 0.20 0.074 0.39 0.076 0.37
Fig. 5 Correlation between DC values and activations in SENT_ CORE across participants and across the 18 hROIs during each of the 3 language tasks. Plots of DC values and BOLD variations of the sen-tence minus word contrasts calculated for sensen-tence production (left),
sentence listening (middle), sentence reading (right) and degree cen-trality. The positive correlation coefficients (N = 138 × 18 = 2484) are 0.158 for sentence production, 0.216 for sentence listening, and 0.295 for sentence reading
Moreover, such a positive correlation between the DC and activation was still significant when all regions of all partici-pants in the three tasks were pooled, meaning that this was true regardless of the cortical area considered.
Discussion
Methodological issues
In this study, we selected right-handers from the BIL&GIN database because we previously demonstrated that these participants have a left hemisphere dominance for language at both the group level (Tzourio-Mazoyer et al. 2016) and the individual level (Zago et al. 2017), with only 5 (3%) of the 144 participants having a co-dominant right hemisphere. This sample group is optimal for selecting areas specific for sentence processing based on a conjunction of activa-tions and leftward asymmetries. In addition, the inclusion of a fairly considerable number of participants (N = 144) provided us a high sensitivity for detecting supramodal sen-tence areas while minimizing the risk of overlooking some. However, we must underline that the present atlas is not all-inclusive. First, we selected map regions involved in only high-order language processing and lexico-syntactic processing. Using the list of familiar words as the refer-ence condition, we removed the dorsal route of language, including the phonological loop, responsible for articulation and sound-to-articulation mapping (Saur et al. 2008; Raus-checker and Scott 2009) In addition, the regions selected herein focused on the left hemisphere and did not account for right hemisphere-specialized aspects of sentence pro-cessing, such as emotional prosody (Beaucousin et al. 2007; Hurschler et al. 2012) and context processing (Grindrod and Baum 2003; Ferstl et al. 2005).
Second, the presence of susceptibility artefacts com-bined with averaging the large number of participants led to incomplete mapping of the inferior part of the temporal lobe, prohibiting us from documenting some areas, such as the basal language area in the anterior part of the fusiform gyrus. This essential language area, first identified using deep electrical recordings (Nobre et al. 1994), has been shown with positron emission tomography (PET) to be acti-vated during both the production and auditory comprehen-sion of language (Papathanassiou et al. 2000).
Third, small size regions may also be lacking in this atlas since we provided data at the hROI scale rather than at the voxel scale.
Concerning the clustering methods of correlation values at rest, a perfect match was observed between the Ward and average clustering methods (see supplementary material Table 1), and a good score was obtained with the Gaussian mixture model for global clustering at the 32 hROI levels.
The weakest score was that of the k-means method, and such a difference in clustering observed with k-means compared to that in the other 3 methods is consistent with the fact that, as reported by Thirion et al., k-means forms clusters spatially close and connected but with poor reproducibility using the sample studied. By contrast, hierarchical cluster-ing uscluster-ing Ward’s method, which we selected to segregate the networks, was reported to create connected clusters that are highly reproducible using the studied samples (Thirion et al. 2014).
A large set of supramodal language areas is involved in sentence processing tasks
We carefully designed each of the language tasks such that joint analyses were possible; the design was identical in the three tasks, and we chose to make them close enough to allow comparisons and conjunctions in terms of the num-ber of words or the complexity of sentences. As mentioned above, the use of a high-level verbal reference task for con-trolling the involvement of primary areas (auditory, visual and motor) and removing phonological and automatic word processing kept the lexico-syntactic aspects common to all three tasks.
The first set of 32 hROIs provides left hemispheric regions that are dedicated to the monitoring and comple-tion of tasks based on sentence processing. Although not all regions can be considered essential language areas, all were determined to be modulated by the verbal material with which they are associated (left activation and leftward asym-metry) and are thus part of an extended language network functioning during language tasks.
Unsupervised hierarchical clustering based on the resting-state connectivity between hROIs successfully segregated three different networks, including networks hosting core language, visual areas, and posterior areas of the DMN and posterior hippocampus. Within the systems to which they belonged, these networks hosted areas dedicated to the interaction/interface with language systems. For example, the current analysis extracted from among the visual areas involved in picture processing those areas specifically deal-ing with picture–sentence meandeal-ing integration.
Sentence comprehension essential network (SENT_ CORE)
Clustering the resting-state correlation between these 32 hROIs allowed the discrimination of SENT_CORE, a net-work of 18 strongly and positively correlated hROIs, includ-ing frontal and temporo-parietal hROIs located on the lat-eral surface of the left hemisphere and anterior insula areas. In particular, SENT_CORE included areas of the antero-posterior language networks, named in reference to the
Broca–Wernicke model in aphasia literature and reported with consistency in meta-analyses of healthy individuals mapped during language tasks see Fig. 6 (Vigneau et al.
2006; Price 2010, 2012). Note that SENT_CORE was the largest network in terms of volume (in mm3), as it included
more than half of the hROIs (18/32), all of which were strongly activated and leftward asymmetrical.
In the following, we discuss the potential roles of the identified areas in relation to the literature. However, it is now acknowledged that, apart from very specific regions where a lesion can be closely associated with a specific defect, the role of a given area documented with functional imaging must be understood as the combination of its func-tional properties with those of the regions with which it constitutes a network to complete a given cognitive task. For example, prec4 is not part of the regions commonly labelled as “language areas”. The present work shows that prec4, located at the junction between the precentral and middle frontal gyrus, is both strongly activated and left-ward asymmetrical in the three sentence tasks. Language meta-analyses have reported prec4 as part of the language
areas involved in lexico-syntactic processing (named F2p in Vigneau et al. 2006, Fig. 6), and in word selection and hierarchical sequencing (named dPrec in Price 2010, Fig. 6). Applying Neurosynth to prec4 coordinates (x = − 42.2,
y = 0.7, z = 50, Table 3) with an association test reveals the greatest number of studies with the terms “sentence”, “comprehension”, “language”, and “sentences”, followed by “eye” and “premotor”. Jouen et al. (2018) propose that prec4 is “involved in the understanding of actions during verbal and non-verbal tasks”. In the present protocol, the sentences involved human actions, closely consistent with that role proposed by Jouen et al. (2018). Using a network approach, Saur et al. (2008) found that prec4 belongs to the sentence comprehension functional network. In Glasser’s atlas, prec4 corresponds to “language area 55b” (Glasser et al. 2016) and overlaps the posterior part of the “rostro-ventral module” described by Genon et al. (2018a, b). In this last work based on peaks meta-analysis, this module is connected with the inferior frontal gyrus, orbital frontal and inferior parietal as prec4 in the present work. The present study further demon-strates that prec4 is involved in a supramodal manner during
Fig. 6 Schematic comparison of SENSAAS with the literature. This
figure shows the results of neuroimaging meta-analyses and clinical studies superimposed on the hROI of SENSAAS of the lateral sur-face of the left hemisphere of the BIL&GIN display template. In the first row: left SENSAAs hROIs of the left hemisphere lateral surface; middle: clusters of the meta-analysis of semantics (red) and sentence processing (green) adapted from Vigneau et al. (2006) with their labels: right: schematic representation of the meta-analysis of lan-guage-related activation studies (adapted from Price (2012); sentence:
purple; semantics: light and dark pink; visual: red; word retrieval: green; integration: white). In the second row, left: functional con-nectivity of the left middle temporal gyrus centred on the site where lesion results in deep aphasia (orange, adapted from Turken 2011); middle: functional connectivity from a seed centred on the left infe-rior frontal gyrus (BA 45, red, adapted from Margulies and Petrides 2013); right: zones of atrophy observed when pooling all types of PPA (orange, adapted from Mesulam et al. 2014)