A Buffer
Gas
Cooled Molecular Beam Apparatus for
Chirped Pulse Millimeter Wave Spectroscopy
by
Ethan Avram Klein
Submitted to the Department of Chemistry
in partial fulfillment of the requirements for the degree of
Bachelor of Science in Chemistry
at the
I
C
L L
OLL
-C,)
MASSACHUSETTS INSTITUTE OF TECHNOLOGY
June 2015
@
Massachusetts Institute of Technology 2015. All rights reserved.
Signature redacted
A u th o r
...
Department of Chemistry
May 8, 2015
Certified by...
Accepted by ...
Signature redacted
...
.
.
.
.
.
.
.
.
.
.
.
.
.
.
.
.
.
.
.
.
.
.
.
.
.
.
.
.
.
.
.
.
.
.
.
.
Robert W. Field
Haslam & Dewey Professor of Chemistry
Thesis Supervisor
Signature redacted
Rick L. Danheiser
Undergraduate Officer, Department of Chemistry
A Buffer Gas Cooled Molecular Beam Apparatus for Chirped
Pulse Millimeter Wave Spectroscopy
by
Ethan Avram Klein
Submitted to the Department of Chemistry on May 8, 2015, in partial fulfillment of the
requirements for the degree of Bachelor of Science in Chemistry
Abstract
An apparatus that utilizes buffer gas cooling to produce slow atomic (Ba, Ca) and molecular (BaF, CaF) beams is constructed. In-cell temperatures of 20 0.25K are achieved with chamber cooldown times of under two hours. Laser Induced Fluores-cence (LIF) spectra of BaF and CaF confirmed thermalization of the molecular beam to the temperature of the buffer gas and additional hydrodynamic cooling to rota-tional and translarota-tional temperatures under 10K. Laser fluence effects on the intensity of barium and calcium ablation were studied and used to optimize laser parameters for maximum ablation of the desired species. A chirped pulse millimeter wave (CP-mmW) setup was combined with the buffer gas cooling apparatus for combined laser and millimeter wave spectroscopy experiments of Rydberg states. LabVIEW pro-gramming is used for an internal temperature feedback system, raster scanning of the ablation target, as well as millimeter wave FID signal digital acquisition. Use of the apparatus for chirped pulse microwave spectroscopy of buffer gas cooled beams have led to orders of magnitude improvement in both the resolution and the reduction of time required to record molecular Rydberg spectra.
Thesis Supervisor: Robert W. Field
Acknowledgments
I would like to thank my research advisor, Prof. Bob Field, for all his guidance and
mentorship. This truly has turned out to be the UROP of my dreams.
I would also like to thank my Rydberg groupmates: Dr. Tony Colombo, Dr. Yan Zhou, David Grimes, and Tim Barnum for their patience and completeness in answering all of my questions about spectroscopy and otherwise, as well as for their grace in dealing with my personal eccentricity.
A special shout-out goes to my fellow Field group UROPs: Julia Berk, Bryan
Changala, and Catherine Saladrigas for their camaraderie throughout these past three years.
Contents
1 Introduction and Theory
5
1.1 Molecular Beam Sources . . . . 5
1.1.1 Effusive Beams . . . . 6
1.1.2 Supersonic Expansion . . . . 7
1.1.3 Buffer Gas Cooling . . . . 10
1.2 Rydberg States of Atoms & Molecules . . . . 13
1.3 Chirped Pulse Millimeter Wave Spectroscopy . . . . 13
1.4 Laser Ablation . . . . 15
2 Experimental Design
17
2.1 Buffer Gas Cooling Apparatus . . . . 172.1.1 Laser Ablation System . . . . 18
2.1.2 Temperature Stabilization Loop . . . . 20
2.2 Millimeter Wave Setup . . . . 21
2.2.1 Data Acquisition . . . . 22
2.3 Laser Ablation Studies . . . . 23
3 Results & Discussion
24
3.1 Experimental Design Diagnostics . . . . 243.2 Millimeter Wave Spectra . . . . 27
3.3 Laser Ablation Studies . . . . 27
Chapter 1
Introduction and Theory
In this introduction, the history of and theory behind molecular cooling techniques,
millimeter wave spectroscopy, and laser ablation are reviewed. These three concepts
are brought together in the experimental apparatus, the construction of which is
detailed in Chapter 2.
1.1
Molecular Beam Sources
The review of molecular beam sources presented here relies heavily on the text
Meth-ods of Experimental Physics, Volume 3, Part B and the Hutzler et al. buffer gas
cooling review published in Chemical Reviews. The author refers the reader to those
sources for further information on these subjects.
Electronic spectroscopy of molecules is more complicated than that of atoms due
to the presence of rovibrational degrees of freedom. The distribution of population
into rotationally and vibrationally excited states dilutes the number density in any
given quantum state, reducing experimental sensitivity of a selected quantum state
[1].
In addition to high rotational and vibrational temperatures, high translational
temperatures of the molecule of interest will Doppler broaden the linewidths of any
molecular spectrum. In order to limit the effects of these experimental challenges
on molecular spectra, both the molecule's internal (i.e. rotational, vibrational) and
translational temperatures must be lowered.
A useful experimental tool for studying gas phase molecules is the formation of a molecular beam. During the past century, different experimental techniques for preparation of molecular beams have been used [21 [3]. Beams produced by oven effusion and supersonic expansion have been utilized for decades, but each technique bears its own set of disadvantages. The technique of buffer gas cooling overcomes these former challenges through cooling of both translational and internal degrees of freedom in addition to slowing lab frame translational velocities.
An applicable quantity for characterizing molecular beam flows is the Reynolds number, Re. The Reynolds number is a ratio of the inertial forces in a flow to the viscous forces, and can be expressed by the equation: Re - = PVL where p is the fluid density, V is the flow velocity, L is a length scale, and [t is the dynamic
viscosity. For effusive beam flow, Re < 1, indicating dominance of viscous forces. For supersonic beam flow, Re > 100, and the increased number of collisions leads to more fluid-like behavior. Molecular beam flow in beams cooled by a buffer gas can operate in either of these regimes, but typically lie somewhere in between the two [4].
1.1.1
Effusive Beams
In effusive beam sources, vapor of the molecule of interest effuses through an orifice into an external vacuum. In doing so, a relatively slow moving (200-800m/s), but hot (500-2000K) molecular beam is formed. Around the turn of the century, Knudsen put forth the well-known cosine law of molecular effusion: dQO anVAscos(O)dw, where
Qo
is the total molecular flux per second, n is the number density in the source, V is the average molecular velocity, A, is the area of the orifice, and W is the solid angle [5]. This equation states that the effusion rate of molecules through an orifice into a given solid angle is proportional to the cosine of that angle made with respect to the normal of the orifice. From this equation, the beam intensity of an effusive beam, Io(6) can be derived: I(O) = iQocos(O). The maximum effusion rate is therefore atthe center of the orifice with the FWHM of the angular distribution subtending an angle of 1200. The formation of an effusive beam is reliant on the assumption that the molecular mean free path is much larger than the orifice diameter, resulting in
few collisions in the vicinity of the orifice [6]. If this were not true, the effusive beam formation would be heavily dependent on interactions with surrounding gas molecules and would not be a reliable sample of the Maxwell Boltzmann distribution. It should be noted that although the velocity distributions within the source can be modeled
by a Maxwell-Boltzmann distribution (fmb(V) Oc v2e-v2
), the distribution of molecules leaving an effusive source is shifted toward higher velocities by an extra factor of v in the distribution (fe(v) oc v3ev2
), as a consequence of Graham's law of effusion [7]. While effusive beams are slow-moving compared to other beam sources (i.e. su-personic jets), they usually have much higher temperatures. Because sufficient vapor pressure of the molecule of interest at the beam operating temperature is required for beam formation, most effusive beams are based on an oven source. Molecules which are gases at room temperature can usually be cooled prior to effusion, as was done in experiments on H2 effusive beams run at 20K by Code & Ramsey in 1971 [8].
However, for molecules which are solids at room temperature (such as BaF or CaF in these experiments), significant heating is necessary to generate sufficient vapor pres-sure. These higher molecular temperatures result in large rotational and vibrational partition functions leading to unwanted population of excited rovibronic quantum states as well as Doppler line broadening.
1.1.2
Supersonic Expansion
Supersonically expanded beams reduce the problems of high molecular temperatures through the resultant cooling of an adiabatic, isentropic expansion of the molecular beam. The supersonic regime is fundamentally different from the effusive regime because the assumption that the mean free path of the molecules is smaller than the orifice diameter no longer holds. In fact, the opposite is true. Collisions between the molecules and the carrier gas near the orifice convert their random thermal motion into directed kinetic energy along the centerline of the flow, lowering the beam temperature considerably. The theory of supersonic jets was first proposed by Kantrowitz &
Grey in 1950 and achieved experimentally by Becker & Bier in 1954 before achieving widespread adoption motivated by the work of Smalley, Levy, and Wharton in the late
0.0 196 19 1 9616 1 196611609610 1 1 1 9 11660 1060 2 100 19 1966 106017 iV 1 20 1 02
I
0.11GIt
K
io9 IBM 19 17f 1ism 19619 in i 1i i me u9M 19M 19n io 19 i o 10961 19 19M9 M 199M9 10601 im Imp in n 99 2 001
Figure 1-1: A PGopher simulation of the C state of BaF with maximum J=50 for
T=300K (top) and T=5K (bottom). Note that the most intense spectral lines at 5K
are an order of magnitude more intense than those at 300K.
I I I
''
I
.
SIl 111 11 It 11 ff 1 l .1 1 .- l I l i I i I il E I I E E E O.AHO O.W0511
III
C." 0.191960s [9] [10] [111. Since then, supersonic beam sources have been used successfully in the preparation of internally cooled molecules, radicals, clusters, and molecular complexes.
Utilizing the theory of isentropic expansion, the ratio between the temperature of the molecular beam and the temperature of the molecule in the source chamber can be derived: T = where M is the Mach number (the ratio of molecular
velocity in a medium to the speed of sound in that medium) and -y(= 2) is the adiabatic index. For a monatomic gas (e.g. Ar), T O=300K, and M=10, the equation gives the translational temperature of the molecular beam as 8.7K. Furthermore, comparing the most probable beam velocities of a supersonic jet with an effusive beam shows that the supersonic beam is a factor of 1.29 times faster for a monatomic gas and 1.53 times faster for a diatomic gas. Despite higher translational velocity, a supersonic molecular beam's distribution of translational velocities is reduced by a factor of V , where T, is the supersonic beam temperature, and Te is the effusive
beam temperature, compared to an effusive beam. Finally, the intensity gain of using a supersonic beam expansion compared to an effusive beam is defined by the equation G = yM2 which simplifies to ~ 4.66M2 for large M. For M=5, using a supersonic jet source instead of a effusive source gives an increase of two orders of magnitude in beam intensity [12]. This intensity gain is extremely important in achieving a high enough number density for laser and millimeter wave spectroscopy.
The most significant disadvantage of utilizing a supersonically expanded molecular beam is the high translational velocity of the beam. Having a fast-moving molecu-lar beam in the lab frame means a reduction in possible interrogation time for a spectroscopic experiment. In addition, because the width of the transverse velocity distribution of a molecular beam has been found to be proportional to the Reynolds number of the beam flow, supersonic beams yield larger Doppler broadening than other molecular beams in a transverse experimental configuration [131. This problem can be surmounted by installing a skimmer to remove only the center of the beam, but it comes at a loss of number of molecules in the beam. In addition to the problem of high velocities, supersonic expansion preferentially cools the molecules translationally
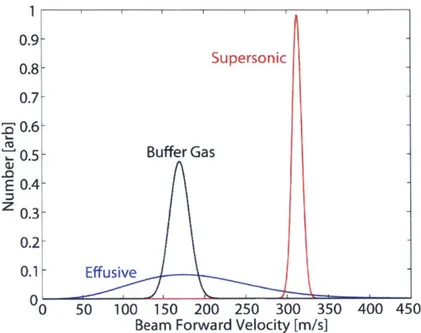
1 0.9-0.8- Supersonic 0.7--'
0.6-9 0.5 - Buffer Gas E 0.4-Z 0.3- 0.2-0.1- Effusive 00 50 100 150 200 250 300 350 400 450 Beam Forward Velocity [m/s]
Figure 1-2: The laboratory frame forward velocity distributions of effusive, buffer gas, and supersonic produced beams are shown. Buffer gas cooled beams have wider velocity distributions than supersonic expansions but slower laboratory frame forward velocities. Although not shown here, buffer gas and effusive beams typically have total number densities several orders of magnitude higher than supersonic beams. [4]
(Ttrans
<
Tot << Tb), leaving some population in excited rovibronic states.1.1.3
Buffer Gas Cooling
Buffer gas cooling is a technique used to cool a molecule's internal temperature and lower its laboratory frame forward velocity. Buffer gas cooling was first described in a 1984 paper published by Messer & De Lucia describing the pressure-broadening of CO rotational transitions using helium gas to cool the CO [141. In the 1990s, the use of buffer gas cooling was extended to Penning trapping of heavy ions in high-precision studies of fundamental physical properties [15]. Penning traps rely on a homogeneous magnetic field and quadrupole electric field for axial confinement of ions, and buffer gas cooling is used to reduce the energy of the ion and make it susceptible to trapping. In 2002, the Doyle group at Harvard utilized buffer gas cooling for the first time to cool a Rb atomic beam [16]. Since then, buffer gas cooling has been a preferred method for producing intense, cold, and slow atomic and molecular beams. In the
experiments detailed here, buffer gas cooling is used to cool both atomic beams (Ba) and molecular beams (BaF, CaF).
The process of forming a buffer-gas cooled molecular beam consists of three stages: (i)thermalization, (ii)diffusion, and (iii) extraction. Upon production of the molecule of interest, which can be done by any of a variety of methods (e.g. laser ablation, beam injection, capillary filling), the molecules will thermalize to the temperature of the buffer gas, given certain conditions dependent on the buffer gas flow rate and the dimensions of the cell. The first requirement is that the thermalization distance of the molecule does not exceed the cell length. It is crucial that a molecule of interest
experiences a sufficient number of collisions with buffer gas molecules such that it thermalizes to the low temperature of the buffer gas. The molecule's thermalization
time can be expressed as Ttherm = NA , where N is the buffer gas density in the Vcooling
source, A is the mean free path of the molecule of interest, and v..ioong is the average molecular velocity during the thermalization, and has been found to be on the order of several milliseconds.
The second stage, diffusion, is a competition between diffusion to the walls of the chamber and entrainment in a molecular beam via exit through the aperture. For a gas mixture with a small fraction of seeded molecules of interest and a choice of light buffer gas relative to the molecule of interest, the diffusion constant, D, can be given by: D = 3 32 nbO'b-, where nb is the buffer gas density, Ub-s is the elastic collisional
cross-section between the buffer gas and the molecule of interest, and Tb is the mean buffer gas velocity. From the approximate value for D, the thermal diffusion time is found to be: Tdif f = 16 Ace"liib7 -s, where Ace,, is the aperture area, and, as for the
97r V~b
thermalization time, it is on the order of several milliseconds. It has been shown that the linear relationship between the diffusion time and the buffer gas density is applicable only for low buffer gas densities (< 3 x 10 5cm-3) at cold temperatures
(<
20K). [17]
The final step in beam formation is the extraction of the molecules of interest through the aperture of the chamber. The extraction time, Tetract, is related to the
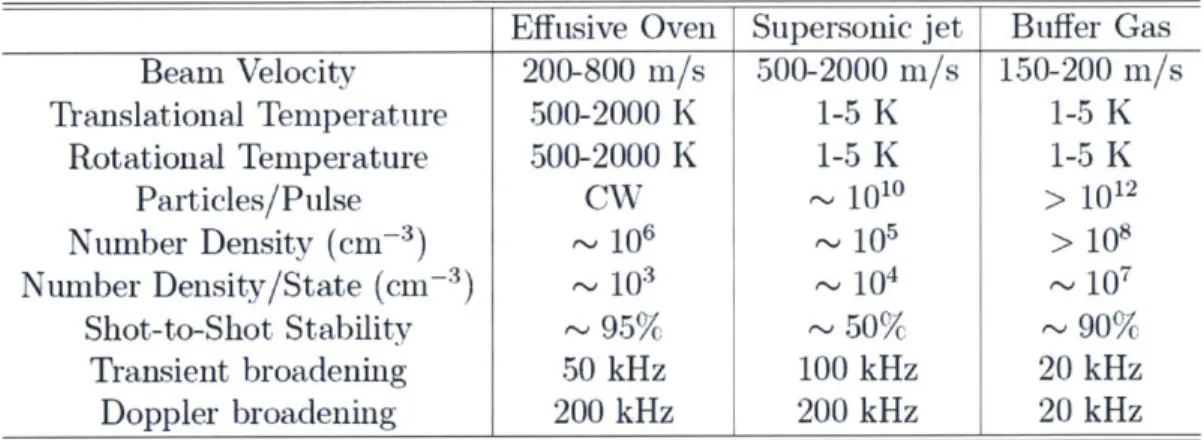
Effusive Oven Supersonic jet
Buffer Gas
Beam Velocity
200-800
rn/s500-2000 m/s 150-200 m/s
Translational Temperature
500-2000 K
1-5 K
1-5 K
Rotational Temperature
500-2000 K
1-5 K
1-5 K
Particles/Pulse
CW
1010 > 101 Number Density (cm- 3) 1ol
105 > 108 Number Density/State (cm- 3) 103 104 107Shot-to-Shot Stability
~ 95%~
50%
90%
Transient broadening
50 kHz
100 kHz
20 kHz
Doppler broadening
200 kHz
200 kHz
20 kHz
Figure 1-3: A comparison of beam properties between beams produced by effusive
oven, supersonic jet, or buffer gas.
[18]
milliseconds. Efficient pumping of the molecular beam out of the source chamber can
be quantified by
icel1,definted as the ratio of diffusion time to extraction time,
77celI Tdiff ,Ub-sfb
Textract Lcell b
where fb is the buffer gas flow rate, and Lceii is the cell length. 7le1 is determined
by the relative speeds with which a molecule either diffuses to the wall of the source
chamber or is extracted through the aperture. When 77e 1> 1, the extraction times
of molecules are shorter than their diffusion times and as a result, efficient pumping
out of the source cell is observed. The pumping efficiency increases linearly as
TcelIincreases, eventually plateauing at an upper bound.
[41
Compared to molecular beams prepared by other techniques, buffer gas cooled
beams have much slower laboratory frame translational velocities than supersonic
beams while having significantly lower center of mass frame translational
temper-atures than effusive beams. As mentioned before, because the transverse velocity
spreads of molecular beams have been shown to increase with increasing Reynolds
number of the gas flow, laser interrogation of the beam perpendicular to the beam's
translational axis sees less broadening for slower lab frame molecular beams. Thus,
the narrower lab frame translational velocity spread results in less Doppler broadening
of the molecular spectra, and also increases the interrogation time of the molecular
beam. These experimental advantages make the use of a buffer gas cooled molecular beam source an attractive option compared to effusive or supersonic alternatives.
1.2
Rydberg
States
of Atoms & Molecules
With regard to this thesis, the ultimate goal of forming intense, cool, and slow atomic and molecular beams is to increase number density in Rydberg states of atoms and molecules. A Rydberg state is an electronically excited state where the electron can be described by high values of the principal quantum number, n. The Rydberg formula:
E = _7; describes the energy of a Rydberg state as a function of n, for quantum
defect 6, where R is the Rydberg constant. The quantum defect, 6, enters due to the interactions of the Rydberg electron with the internal structure of the ion-core for species which are not hydrogen, and leads to the definition of an effective principal quantum number, n*=n-6
[19].
For molecules, the non-spherical, multi-atomic nature of the ion-core affects the electronic structure of the molecule and hence the transition energies between Ryd-berg states. By probing those RydRyd-berg-RydRyd-berg transitions, electric properties of the ion-core (e.g. multipole moments, polarizability) can be determined. The elliptical orbit of the Rydberg electron around the ion-core for low angular momentum states can result in penetration into the ion-core, reducing the effectiveness of the Rydberg electron as a passive probe of ionic properties. Overcoming this obstacle requires the production of core non-penetrating states, states with higher angular momentum having a larger centrifugal barrier, which scales as f(f + 1).
1.3
Chirped Pulse Millimeter Wave Spectroscopy
For molecules in low-lying electronic states, millimeter waves can be used to probe ro-tational transitions. However, in the regime of Rydberg states of diatomic molecules'
studied here (n*~ 35 - 40), the energy separation between electronic levels (= 2)
2
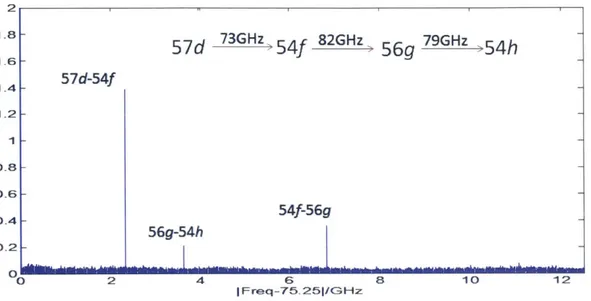
57d
73GHz: 5 4f
82GHz
56g
54h
1-4 57d-54f 1-.2 0.8- 0.6-0.4- 54f-56g 56g-54h 0 2 4 6 8 10 12 IFreq-75.25j/GHzFigure 1-4: A pulse sequence chirped pulse experiment on Rydberg-Rydberg transi-tions of BaF.
frequencies in the range of millimeter waves (f=-70 - 110GHz). Compared to optical transitions, which have a maximal dipole moment of ~ 10 Debye, Rydberg-Rydberg transitions, which can be excited by millimeter waves, can have kiloDebye electric dipole transition moments
1201.
A primary challenge in utilizing the advantage oflarge transition dipole moments has been to achieve sufficiently high frequency reso-lution (on the order of tens of kilohertz) in a reasonable experimental time.
The Chirped Pulse Fourier Transform Microwave (CP-FTMW) technique was in-troduced by the Brooks Pate group in 2006 to overcome this obstacle by utilizing a sweep over a broad range of frequencies in a short time interval
[21].
Byupcon-verting a frequency chirp, the frequency bandwidth of the chirp is expanded to span a much larger region. This chirp range is used to polarize transitions between the molecular Rydberg states, producing a free induction decay (FID) as the polarization relaxes. A Fourier transform of the resulting FID radiation produced by molecular relaxation yields an emission spectrum that is collected in the time domain and then Fourier-transformed to the frequency domain. Millimeter wave FIDs provide very high resolution Fourier-transformed frequency spectra with resolution to <50kHz. Combining buffer gas cooling with chirped pulse millimeter wave spectroscopy
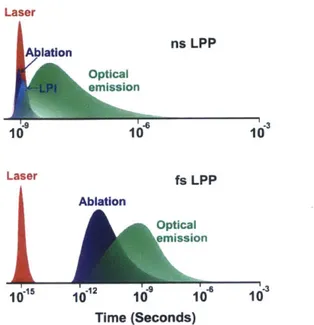
pro-Laser Ablation ns LPP Optical emission 10 0 Laser fs LPP Ablation Optical emission 101 12 10 1 1 Time (Seconds)
Figure 1-5: In nanosecond laser produced plasma (LPP), the pulse length is
suffi-ciently long that the pulse overlaps temporarily with the plasma from the ablation,
leading to laser++ plasma interactions (LPI). This does not occur with femtosecond
pulsed LPP because the laser pulse has terminated well before ablation has begun.
[221
vides the necessary resolution to perform broadband studies of Rydberg states of cold
molecules.
As a proof-of-concept, the millimeter wave spectrum presented here shows the
production of core non-penetrating states in Ca by sequential excitation up the ladder
of orbital angular momentum using a sequence of millimeter wave transitions.
1.4
Laser Ablation
Several years after the invention of the laser around 1960, laser ablation was realized
to be a versatile tool to eject material from a solid into the gas-phase
[23].
Although
much of today's research into laser ablation relates to its usefulness in the precision
processing of materials, in this section, only the topic of using laser ablation as a
molecular production method will be discussed
1241.
In laser ablation of a solid material, the solid-state attractive interactions of the
target are overcome by an intense laser pulse and a hot plasma of the material is
produced. The mechanism of ablation is extremely complex and is not well under-stood. The advantage of laser ablation over other molecular production techniques for gas-phase spectroscopy is its ability to transfer a molecule of interest from the solid phase to the gas phase. Although the resulting gas-phase molecule is initially extremely hot upon production, with several papers having found the initial temper-ature of the ablation plasma to be >10,000K, this tempertemper-ature decreases rapidly due to the adiabatic expansion of the plasma plume [22]. The maximum ablation yield, a measure of how much material can be ejected into the gas-phase for a single laser pulse, is target-specific and is determined by the lattice energy of the crystal and the duration and intensity of the laser pulse
[25].
An interesting property of laser abla-tion is that irrespective of the laser's angle of incidence on the target, the produced plasma expands preferentially perpendicular to the ablation target [261.The quantity and composition of material removal using a high-power laser pulse is strongly dependent on the laser pulse duration and intensity. When using a nanosec-ond pulsed laser for ablation, the laser pulse melts the surface layer of the ablation target, resulting in transfer of material to both liquid- and gas-phase [27]. Because the plasma is formed before the termination of the laser pulse, there is a resulting laser ++ plasma interaction(LPI) between the plasma already formed and the contin-uing laser pulse. This interaction is reduced when using picosecond or femtosecond laser pulses as ejection of the plasma from the surface occurs after the end of the pulse. The result of LPI is heating of the plasma, and has been shown to produce a larger fractional yield of ionic species compared to shorter pulses which produce predominantly neutral species [22].
Chapter 2
Experimental Design
2.1
Buffer
Gas
Cooling Apparatus
The buffer gas cooling apparatus was designed by Dr. Yan Zhou and David Grimes
for its use in high resolution CPmmW spectroscopy, and is affectionately termed
"Buffy". The apparatus can be divided into two main parts: the source chamber and
the detection chamber.
The dimensions of the source chamber are 18"x12"x12" and its interior is accessible
from four of its six sides. The two-stage Cryomech closed cycle helium refrigerator sits
atop the source chamber with the twin tubes of the refrigerator head passing down
into the source chamber. Inside of the source chamber is the stainless steel radiation
shield of dimensions 11"x7"x7", which is cooled by the first stage of the cryocooler to
40K. Within the radiation chamber, the cold plate is attached to the bottom of the
refrigerator head and is cooled by the second stage of the cryocooler to around 20K.
The cold cell is mounted to the bottom of the cold plate with the laser ablation target
and buffer gas inlet on the backside and the windows for optical input on the front.
There is also a smaller optical port for additional probe lasers. Resistive heaters
and diode sensors are placed on the cold cell, cold plate, and gas tube to record and
control the temperature on all surfaces within the radiation shield.
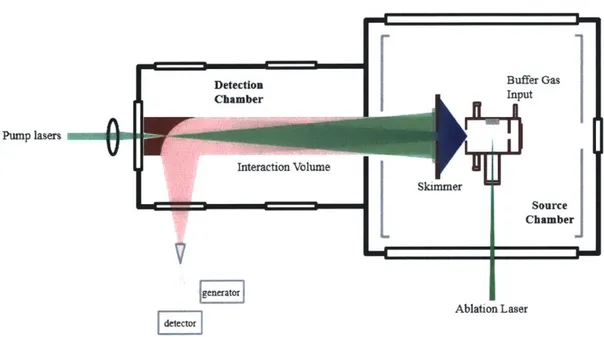
The detection chamber is separated from the source chamber by a several
inch-wide aperture for passage through which the molecular beam passes. The detection
Detection Buffer Gas Chamber Input Pump lasers Interaction Volume Skimmer mmc= Source Chamber Ablation Laser
Figure 2-1: The buffer gas cooling apparatus.
chamber features two pairs of windows on either side, constructed of glass or Teflon,
for probing by either laser or millimeter waves, respectively. On the inside of the
detection chamber is a parabolic mirror for mm-waves, with a central hole drilled out
to facilitate overlap with the pump lasers. This experimental setup is used for on-axis
experiments that require large interaction volumes.
The key components of the construction to be discussed in this thesis are the
laser ablation system of the apparatus, the temperature control loop, and the data
acquisition software.
2.1.1
Laser Ablation System
Pellet Production Technique
The source chamber of the apparatus is designed for use with a circular ablation
target 0.65" in diameter. The pellet is clamped against the outside of the chamber
with four screws and a copper cover. To produce pellets of this size, a die press was
machined by the MIT Central Machine Shop with the same diameter.
Pellet production consists of grinding approximately 3-4g of material with mortar
and pestle, to be loaded into the die. For BaF
2pellets, different combinations of BaF
2and CaF2 were used in pellet production. The die is pressed using a hydraulic press
under 10-15 tons of pressure for between five and thirty minutes. The pellet is then heat-treated in a small vacuum oven by cycling up to 1000 0C and then cooling to room temperature three separate times. Heat treatment leads to apparent crystallization and significant increase of the pellet's durability. Upon heat treatment of the barium fluoride, grey and black specks could be seen in the pellet. The impurities were observed exclusively in heat-treated pellets, caused most probably by reaction with water at high temperatures:
BaF2 + 2H20 -+ Ba(OH)2 + 2HF
Attempts were made to eliminate traces of H20 from the BaF2 pellet, including
storing the pellets in a dessicator and using 99.99% anhydrous BaF2. Pellets formed
using the anhydrous barium fluoride did not hold up as well as those made using lab-grade BaF2. Addition of small amounts of CaF2 (<5% by mass) proved to increase
pellet cohesion. Eventually, pellet production was done with pure BaF2 in order to
remove any presence of calcium compounds in the molecular beam. Pressing for ten minutes at twelve tons of pressure produced sufficiently cohesive pellets and heat treatment as described above contributed to the pellet's usability. Pellets of this type were produced up to 4.8g in size, lasting for tens of hours of ablation without fragmenting. This procedure for producing pellets has yielded the greatest signal in spectroscopic experiments, indicating optimal pellet ablation conditions.
Programmatic Laser Ablation
In order to ensure uniform ablation of the pellet target, a programmatic raster scan of laser optics over the surface of the target was implemented. Homogeneous ejection of ablated material is important to maintain a constant number density of the molecule of interest entrained in the buffer gas. This can be best be achieved by moving the ablation spot in order to minimize surface effects.
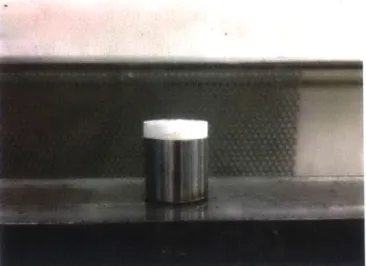
Figure 2-2: A BaF pellet resting on top of its die.
with attached potentiometers in order to tune the motion of the laser spot at a
controlled frequency. The mirror steps in one direction while a gating mirror scans
the other direction. These are controlled by LabVIEW software developed for this
application and integrated with the temperature stabilization loop.
2.1.2
Temperature Stabilization Loop
The radiation plate, source chamber, and skimmer are all cooled using a liquid helium
cryostat in order to maintain sufficiently low temperatures to cool the molecular beam
efficiently. However, pumping the cryostat cannot be controlled accurately enough to
maintain in-chamber temperatures of <1K accuracy. To achieve temperature control
on that order, resistive heaters and diode sensors are placed on all of the important
in-chamber surfaces as parts of a iterative feedback PID loop. The radiation plate is
held at 40K by the first stage of the cryostat whereas the source chamber and gas
inlet are cooled to 20K using the second chamber of the cryostat. Because neon gas
condenses at 20K, this is a lower bound for the cooling of the source of chamber. A
LabVIEW program allows the user to set the desired temperatures for each of these
surfaces by changing the voltage passed through the resistor from 0 to 8.8V, as well
as to monitor the diode sensor outputs.
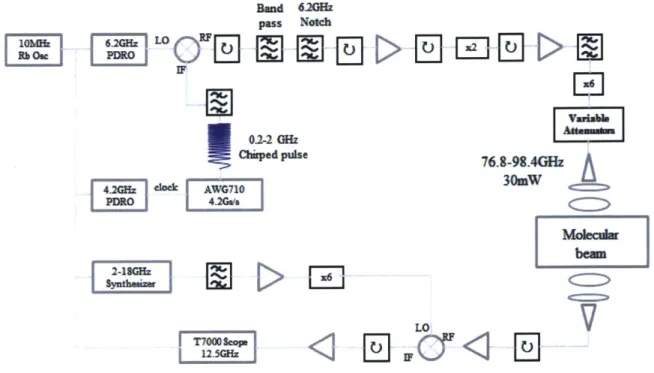
0.2-2 GHz
Chizped puls
4.21 lc AWG710
Figure 2-3: The microwave setup used fo
cooling apparatus.
Wuh otch 76.-9.44GHzA
30mW be=m O CsVr CPmmW spectroscopy in the buffer gas
2.2
Millimeter Wave Setup
The millimeter wave setup begins with a 4.2GS/s Tektronix 710 Arbitrary
Wave-form Generator capable of outputting frequencies of 0.2-2.0GHz. It is clocked with
a 4.2GHz phase-locked dielectric resonator oscillator (PDRO). The chirped signal is
passed through a filter and then mixed with a 6.2GHz PDRO. This chirp then passes
through a frequency bandpass filter and a 6.1-6.3GHz notch filter to remove all
har-monics of the mixing signal and also remove the lower frequency mixed signal. After
passing through an isolator, the chirp is upconverted by a factor of twelve, using 2x
and 6x active multipliers in succession. The chirped pulse, now spanning the range of
76.8-98.4GHz, can be variably attenuated and is transmitted into the molecular beam
through a horn. The FID signal is then collected by the same horn or by a receiving
horn placed on the opposite side of the detection chamber of the buffer gas apparatus.
It is then downconverted by a 6x multiplied synthesizer frequency (~
14.4GHz) and
read out on a 12.5GHz Tektronix 700 oscilloscope. All controls of this experiment are
IP=38745 cm-1 v+=0, N+_{ C2n x2x+ n+1, t+1 75 - 98 GHz n45, t=3 n-1, f+1 -18600 cm-1 -20100 cm-1
Figure 2-4: Laser and mm-wave excitation scheme for BaF.
118]
done through LabVIEW as discussed below.
The excitation scheme shown in Figure 2-4 displays how the millimeter waves are used to induce Rydberg-Rydberg transitions for n~45 in BaF. Two pump lasers excite the BaF molecular beam while it is overlapped with the chirped pulse millimeter waves in a large interaction volume. In previous experiments, signal was acquired through a two laser-excitation scheme with an ionization voltage applied to the molecule in the Rydberg state. That scheme offered significantly lower resolution of the Rydberg electronic structure compared to the CPmmW technique.
2.2.1
Data Acquisition
The enhanced LabVIEW data collection program provides a single user interface for entire experimental control. The program is an adaptation of previous software written for the GERTRUDE apparatus, including additional features necessary for the microwave component of the experiment. Program capabilities include setting probe laser scan ranges, data file save locations, peak integration gates, Stark plate voltages, and downconversion frequencies . Eliminating the need for external manual manipulation of these parameters reduces researcher experiment time to only setup
of the scan. The user interface also grabs spectral data displayed on the digital oscilloscope, and displays wavemeter readings for all frequency steps. This allows the researcher to consult a single screen for all updated parameters of the scan. The program saves the input parameters, FID spectra, and wavemeter readings for every scan to the file location specified by the user.
Downconversion of the FID signal results in positive and negative combinations with the mixing frequency, so two separate synthesizer frequencies must be used in order to determine which combination the downconversion represents. In addition, becase the microwaves can stimulate either absorptive or emissive transitions, the FID's phase profile must be evaluated to determine whether an upward or downward transition took place.
2.3
Laser Ablation Studies
Nanosecond-pulsed ablation studies of the ratio of ionic to neutral components of the plasma are undertaken for both Ca and Ba targets. These studies are conducted under a flow of neon gas into the source chamber, such that the atomic and ionic composition determined by the ablation study will be representative of their compositions in the formation of an atomic beam. An Ocean Optics UV-Vis spectrometer is mounted to a window of the source chamber of the buffer gas cooling apparatus using a six inch lens tube to remove background light. The emission spectra for the plasma is collected for different laser fluences, altered by changing the
Q
switch delay time of the ablation Nd:YAG.Chapter 3
Results & Discussion
Construction of the buffer gas cooling apparatus with application to Rydberg spec-troscopy is the primary focus of this thesis. In this section, the results of experiments conducted to characterize the effectiveness of the apparatus to properly cool both atomic and molecular beams are presented. In addition, the initial mm-wave experi-ments conducted in the beam are presented, along with an additional section on the effects of laser fluence on ablation in the chamber.
3.1
Experimental Design Diagnostics
To determine the rotational temperature of the molecular beam, laser induced fluo-rescence experiments for both barium monofluoride and calcium monofluoride were performed in the buffer gas cooling apparatus. The LIF spectra were then fitted to PGopher simulated spectra in order to match the relative intensities of the experi-mental spectra to a simulation temperature 128]. For BaF, the rotational temperature was found to be 10K; for CaF, the rotational temperature was calculated to be 7K. Assuming that the cross section for cooling translational degrees of freedom is of the same order as cooling rotational degrees of freedom, the assumption can be made that the translational temperatures are of this magnitude, if not colder. Cooling to below the temperature of the buffer gas results from isentropic expansion of the molecular beam out of the source cell. These spectra provide good agreement with the source
0.3-Top: Experimental, BaF LIF C 2P -X 'S+
Bottom: Simulated, 10K. 0.1 cm resolution 0.2-0.1 - 0.00.1 0.2 0.3 -20.175 20180 20185 20190 20.195x10' Wavenumbers (cm')
Top: Experimental, CaF LIF B 2S+ < X I +
0.2- Bottom: Simulated, 7K 0 1 cm resolution
0.1- 0.0- -0.1--0.2 18.830 18835 18.840 18.845 18.850 18.855x10 Wavenumbers (cm')
Figure 3-1: LIF spectra of BaF(top) and CaF(bottom) matched with PGopher
simu-lation spectra. The BaF spectral intensities match simulated spectra at 10K and the
CaF spectra matches simulations at 7K.
chamber temperatures recorded using the attached diode sensors, and confirm the
cooling effects of the buffer gas on the molecular beam.
The number density of BaF in the molecular beam was also determined from the
LIF spectral intensity. The total number density was quantified as 10
8/cm
3whereas
the number density per quantum state was on the order of 10
7/cm
3. These values
were calculated using LIF intensities, the detector's solid angle and quantum yield,
as well as the bias voltage on the photomultiplier tube. The fractional population
transfer to the excited state and the fluorescence lifetime were also needed. The
0 5 10 15 20 21.0 Cold cell 20.5 -20.0 19.5 -29.0 __._ Gas tube e 20.5 -20.0 E 19.5 13.6 Cold head 5.0 -4.5 4.0 -3.51 0 5 10 15 20 Time/mins
Figure 3-2: Temperature stability of the cold cell, gas tube, and cold head are shown over a period of 20 minutes to be within 0.25K. The peak in cold cell temperature is due to an ablation laser pulse.
primary uncertainty in the measurement is due to to uncertainty in the probe laser power.
Additional experiments have been started to utilize absorption spectroscopy with a CW infrared laser to quantify the buffer gas cooling and molecular beam properties, such as thermalization time, vibrational and rotational temperatures, ablation yield, and extraction efficiency. These experiments utilize the A +- X transition in BaF and measure both the dependence of the absorption on delay from the ablation laser as well as rotational and vibrational populations to determine these properties. Similar diagnostic experiments have been performed by the DeMille group at Yale on a buffer
gas cooled beam of SrF
129].
The temperatures of the cold cell, gas tube (Ne inlet), and cold head are shown for the buffer gas cooling apparatus in Figure 3-2. Temperature stability of 0.25K
is seen for all internal source chamber surfaces for arbitrarily long periods of time. The transient feature seen in the cold cell temperature corresponds to the firing of the ablation laser into the cell.
3.2
Millimeter Wave Spectra
Experiments using the on-axis millimeter wave setup, as discussed in section 2.1, show a Doppler shifted doublet due to the co-propagation and counter-propagation of the chirped pulse millimeter wave with the molecular beam. The spectrum in Figure 3-3 shows the 42p-40d transition in Ba atoms averaged over 1000 pulses. The spectral linewidth is observed to be only 75kHz,which illustrates the advantage of measuring the FID signal of a Rydberg transition instead of the signal due to ionization from a Rydberg state. The FID signal resolution is blackbody limited at ~~50kHz. Resid-ual linewidth is due to the presence of collective effects (e.g. superradiance). The Doppler shift between the peaks of the doublet is used as a measure of the laboratory frame translational velocity of the molecular beam. For a splitting of 150kHz, the corresponding lab frame translational velocity of the Ba atomic beam is 200m/s, a factor of three less than that of a beam undergoing supersonic expansion using argon as the carrier gas.
Chirped pulse millimeter wave experiments on BaF molecular beams have also been performed in the buffer gas cooling apparatus, although assignment of those spectral lines have not yet been made.
3.3
Laser Ablation Studies
The intensities of atomic and ionic transitions in ablated Ca and Ba are plotted as functions of laser fluence in the below figures. For Ba(I) (Ba atom), the intensity displayed is that of the 6s2(1S) +- 6s6p(1Po) transition at 552.756 nm, while for
Ba(II) (Ba ion) the transition used is 6s(2S
1/2) +- 6p(
2P
1/2) occurring at 493.41nm.
Very low number density 0.8-0.6
75kHz
"E 0.4-E0.0-0.0-
150kHz
6.30 6.931 6.932 6-933 Frequency on scope/GHzFigure 3-3: A Doppler doublet of Ba atom observed with the on-axis CPmmW setup
in the buffer gas cooling apparatus. Doppler broadening gives a laboratory frame
forward velocity of 200m/s.
Ca(JI), the transition 3p
63d(
2D5/2
) +- 3p
64p(
2
PO) at 854.209 nm was used. The
spectrometer is only accurate to lnm and the frequencies recorded here match the
NIST recorded transition energies to within uncertainty
[301.
Previous literature has
also utilized the Ba(I) and Ba(II) transitions used here as representative of the two
species, whereas different transitions were chosen for characterizing the intensities of
Ca(I) and Ca(II).
Previous studies of the ablation of barium and calcium, among other metals, shows
a sigmoidal relationship between the spectral intensity of the plasma emissions and
the laser fluence
[31].
This sigmoidal relationship is a function of the material ejected
via ablation, Mj:
A
1(#5)
-A2)Mj(#)
=
A2(0)+-where
#
is the laser fluence in J/cm
2, A
1is the bound on ablated material for low
4,
A
2is the bound on ablated material for high
#,
qc
is the critical fluence (the fluence
at which ablation becomes the dominant material process), and Sc is a
surface-dependent parameter. The sigmoidal fit can be broken up into three regions:
Arrhe-CaF Optical Emission Spectrum 20 18 Cal 16-14~ 12- Ca I 10 8 6 4 ~ 2- W4 w200 300 400 500 600 700 Wavelength (nm)
BaF Optical Emission Spectrum
40 35 30 25 20 15 10 5 w 200 300 400 500 600 Wavelength (nm) 800 900 1000 700 800 900 1000
Figure 3-4: Optical emission spectra of CaF and BaF.
Ba I
u Re eIonic Emission
101-101 10 1010
Laser Flisnc., J.cm-2
Figure 3-5: Atomic and ionic emission intensities for Ca and Ba as a function of laser fluence. Note: The reported laser fluences are an order of magnitude smaller than as represented in this figure.
nius, Linear, and Beer-Lambert. In the Arrhenius region, A1(#) oc exp(-LH) where
AH is the vaporization energy of the ablation target material. In the Beer-Lambert
region A2(#) c In[l 1, where
#th
is the threshold fluence. Where these two regionsconverge is the linear region where Mj(#)oc
#.
Fluence was calculated by measuring laser power for a 532nm YAG operating at a 10Hz repetition rate and assuming aspot size of 0.1cm2
.
Sigmoidal fitting of the calcium atom and ion data gave R2 values of >0.99 with
all three regimes (Arrhenius, linear, Beer-Lambert) for the observed range of laser fluence. The experimental critical fluence values determined by the sigmoidal fit for Ca was 0.40J/cm2, which agrees within an order of magnitude with a literature value
of 4.4J/cm2, which was obtained using a 1064nm Nd:YAG for ablation. In order to
determine whether the difference between these values is a function of the ablation pulse wavelength or another property, measurement of the laser ablation spot size is required, as well as more sensitive power measurements. The experimental Sc value for Ca was 3.56 compared to a literature value of 2.4t0.4. This parameter has been found to have an inverse relationship with the roughness of the target surface, indi-cating that the Ca target used in this experiment had a smoother surface compared to that in literature [311.
For the barium data, a much more linear fit was observed, possibly indicating that the laser fluences used were not high or low enough to observe the other two regimes. The ablation pulse energy used here is in the range of 1-10mJ whereas that used in previous experiments spanned 5-180mJ. Observing that, unlike the calcium data, both the barium atom and ion emission intensities do not plateau for the used laser fluences, suggests that larger material ejection is possible for experiments using barium atomic beams.
Chapter 4
Conclusions
Diagnostic experiments done on the buffer gas cooling apparatus have shown effective buffer gas cooling of molecular beams of a variety of species. Effective cooling of the source chamber for long periods of time (>10 hours) has been achieved and efficient ablation of different species has been optimized. Translational and rotational temperatures of <10K have been observed, and lab frame translational velocities of 200m/s have been realized. Additional CW absorption spectroscopy experiments must still be conducted to further characterize the molecular beam formation. Use of the buffer gas cooled molecular beam for high-resolution CPmmW spectroscopy has been successful on both atoms (Ba) and molecules (BaF), and will have valuable applications in Rydberg electronic spectroscopy, probing electric properties of the ion-core. Studies of laser ablation in the apparatus have expanded upon results in the literature for different ablation laser wavelength and a different range of laser fluence.
A study of the composition resulting from laser ablation of the alkaline earth halides
is the next step.
Overall, combining the techniques of buffer gas cooling and chirped pulse mi-crowave spectroscopy have led to orders of magnitude improvement in both the resolu-tion and the reducresolu-tion of time required to record molecular Rydberg spectra. This has allowed for the observation of molecular Rydberg-Rydberg transitions not previously observable in supersonically expanded beams. Through the increased number density, decreased translational velocities, higher spectral resolution, and shorter experiment
times that this apparatus provides, molecular spectroscopists have a promising new avenue to reap a wealth of information contained in the Rydberg regime.
Bibliography
[1] Donald H Levy. The Spectroscopy of Very Cold Gases. Science,
214(4518):263-269, 1981.
[2] J. Deckers and J. B. Fenn. High intensity molecular beam apparatus. Review of Scientific Instruments, 34(1):96-100, 1963.
[3] Ellison H. Taylor and Sheldon Datz. Study of chemical reaction mechanisms with
molecular beams. the reaction of k with hbr. The Journal of Chemical Physics,
23(9), 1955.
[4] NR Hutzler, HI Lu, and JM Doyle. The buffer gas beam: An intense, cold, and slow source for atoms and molecules. Chemical reviews, 2012.
[5] Martin Knudsen. Die Molekularstrdmung der Gase durch Offnungen und die
Effusion. Annalen der Physik, 333(5):999-1016, 1909.
[61 Sebastiaan Y. T. van de Meerakker, Hendrick L. Bethlem, and Gerard Meijer.
Taming molecular beams. Nature Physics, 4(8):595-602, 2008.
[7] David M. Lubman, Charles T. Rettner, and Richard N. Zare. How isolated are
molecules in a molecular beam? The Journal of Physical Chemistry,
86(7):1129-1135, 1982.
[81 R. F. Code. A Low Temperature Molecular Beam Source. Review of Scientific
Instruments, 42(6):896, 1971.
[91 Arthur Kantrowitz and Jerry Grey. A high intensity source for the molecular
beam. Part I. Theoretical. Review of Scientific Instruments, 22(5):328-332, 1951.
110]
E.W. Becker and K. Bier. Dei Erzeugnung eines intensiven, teilweise monochro-matisierten Wasserstoff-Molekularstrahles mit einer Laval-Duse. Zeitschrift Naturforschung Teil A, 9:975, 1954.[11] Richard E. Smalley, Lennard Wharton, and Donald H. Levy. Molecular optical
spectroscopy with supersonic beams and jets. Accounts of Chemical Research, 10(4):139-145, 1977.
[12] D. Williams. Molecular Physics: Methods of Experimental Physics. Elsevier Science, 2013.
113]
Nicholas R. Hutzler, Maxwell Parsons, Yulia V. Gurevich, Paul W. Hess,
Eliza-beth Petrik, Ben Spaun, Amar C. Vutha, David DeMille, Gerald Gabrielse, and
John M. Doyle. A cryogenic beam of refractory, chemically reactive molecules
with expansion cooling. pages 18976-18985, 2011.
[14] J. K. Messer and Frank C. De Lucia. Measurement of pressure-broadening
param-eters for the CO-He system at 4 K. Physical Review Letters, 53(27):2555-2558,
1984.
[151 G. Savard, St. Becker, G. Bollen, H.-J. Kluge, R.B. Moore, Th. Otto,
L. Schweikhard, H. Stolzenberg, and U. Wiess. A new cooling technique for
heavy ions in a Penning trap. Physics Letters A, 158(5):247-252, 1991.
[16] Dima Egorov, Thierry Lahaye, Wieland Sch6llkopf, Bretislav Friedrich, and John
Doyle. Buffer-gas cooling of atomic and molecular beams. Physical Review A,
66(4):1-8, 2002.
[17] S. M. Skoff, R. J. Hendricks, C. D. J. Sinclair, J. J. Hudson, D. M. Segal, B. E.
Sauer, E. A. Hinds, and M. R. Tarbutt. Diffusion, thermalization, and optical
pumping of ybf molecules in a cold buffer-gas cell. Phys. Rev. A, 83:023418, Feb
2011.
118]
Yan Zhou. Direct observation of Rydberg-Rydberg transitions via CPmm Wspec-troscopy. PhD thesis, Massachusetts Institute of Technology, 2014.
[19] Jeffrey J. Kay, Stephen L. Coy, Bryan M. Wong, Christian Jungen, and
Robert W. Field. A quantum defect model for the s, p, d, and f rydberg
se-ries of caf. The Journal of Chemical Physics, 134(11):-, 2011.[20] Anthony P. Colombo, Yan Zhou, Kirill Prozument, Stephen L. Coy, and
Robert W. Field. Chirped-pulse millimeter-wave spectroscopy: Spectrum,
dy-namics, and manipulation of rydberghArydberg transitions.
The Journal of
Chemical Physics, 138(1):-, 2013.
[21] Gordon G. Brown, Brian C. Dian, Kevin 0. Douglass, Scott M. Geyer, and
Brooks H. Pate. The rotational spectrum of epifluorohydrin measured by
chirped-pulse Fourier transform microwave spectroscopy.
Journal of Molecular
Spec-troscopy, 238(2):200-212, 2006.
122]
B. Verhoff, S. S. Harilal, J. R. Freeman, P. K. Diwakar, and a. Hassanein.
Dy-namics of femto- and nanosecond laser ablation plumes investigated using optical
emission spectroscopy. Journal of Applied Physics, 112(9), 2012.[231 John C Miller. A brief history of laser ablation. AIP Conference Proceedings,
288(1):619, 1993.
[25] M. Villagran-Muiz, H. Sobral, C. a. Rinaldi, I. Cabanillas-Vidosa, and J. C.
Ferrero. Optical emission and energy disposal characterization of the laser
abla-tion process of CaF2, BaF2, and NaCl at 1064 nm. Journal of Applied Physics,
104(10), 2008.
[26] Tao Wu, Xinbing Wang, Shaoyi Wang, Jian Tang, Peixiang Lu, and Hong Lu.
Time and space resolved visible spectroscopic imaging co2 laser produced
ex-treme ultraviolet emitting tin plasmas. Journal of Applied Physics, 111(6):-,
2012.
[27] B. N. Chichkov, C. Momma, S. Nolte, F. von Alvensleben, and A. Tunnermann.
Femtosecond, picosecond and nanosecond laser ablation of solids. Applied Physics
A: Materials Science & Processing, 63(2):109-115, 1996.

![Figure 2-4: Laser and mm-wave excitation scheme for BaF. 118]](https://thumb-eu.123doks.com/thumbv2/123doknet/14186850.477298/22.918.294.611.125.429/figure-laser-mm-wave-excitation-scheme-baf.webp)

