MIT Joint Program on the
Science and Policy of Global Change
Climate Change Taxes and Energy Efficiency
in Japan
Satoru Kasahara, Sergey Paltsev, John Reilly, Henry Jacoby and A. Denny Ellerman
Report No. 121 May 2005
The MIT Joint Program on the Science and Policy of Global Change is an organization for research, independent policy analysis, and public education in global environmental change. It seeks to provide leadership in understanding scientific, economic, and ecological aspects of this difficult issue, and combining them into policy assessments that serve the needs of ongoing national and international discussions. To this end, the Program brings together an interdisciplinary group from two established research centers at MIT: the Center for Global Change Science (CGCS) and the Center for Energy and Environmental Policy Research (CEEPR). These two centers bridge many key areas of the needed intellectual work, and additional essential areas are covered by other MIT departments, by collaboration with the Ecosystems Center of the Marine Biology Laboratory (MBL) at Woods Hole, and by short- and long-term visitors to the Program. The Program involves sponsorship and active participation by industry, government, and non-profit organizations.
To inform processes of policy development and implementation, climate change research needs to focus on improving the prediction of those variables that are most relevant to economic, social, and environmental effects. In turn, the greenhouse gas and atmospheric aerosol assumptions underlying climate analysis need to be related to the economic, technological, and political forces that drive emissions, and to the results of international agreements and mitigation. Further, assessments of possible societal and ecosystem impacts, and analysis of mitigation strategies, need to be based on realistic evaluation of the uncertainties of climate science.
This report is one of a series intended to communicate research results and improve public understanding of climate issues, thereby contributing to informed debate about the climate issue, the uncertainties, and the economic and social implications of policy alternatives. Titles in the Report Series to date are listed on the inside back cover.
Henry D. Jacoby and Ronald G. Prinn, Program Co-Directors
For more information, please contact the Joint Program Office
Postal Address: Joint Program on the Science and Policy of Global Change 77 Massachusetts Avenue
MIT E40-428
Cambridge MA 02139-4307 (USA) Location: One Amherst Street, Cambridge
Building E40, Room 428
Massachusetts Institute of Technology Access: Phone: (617) 253-7492
Fax: (617) 253-9845
E-mail: g l o ba l ch a n g e @ m i t .e d u
Web site: h t t p:/ / M I T .E D U / g l o ba l ch a n g e /
Climate Change Taxes and Energy Efficiency in Japan
Satoru Kasahara*, Sergey Paltsev, John Reilly, Henry Jacoby and A. Denny Ellerman
Abstract
In 2003 Japan proposed a Climate Change Tax to reduce its CO2 emissions to the level required by the
Kyoto Protocol. If implemented, the tax would be levied on fossil fuel use and the revenue distributed to several sectors of the economy to encourage the purchase of energy efficient equipment. Analysis using the MIT Emissions Prediction and Policy Analysis (EPPA) model shows that this policy is unlikely to bring Japan into compliance with its Kyoto target unless the subsidy encourages improvement in energy intensity well beyond Japan’s recent historical experience. Similar demand-management programs in the U.S., where there has been extensive experience, have not been nearly as effective as they would need to be to achieve energy efficiency goals of the proposal. The Climate Change Tax proposal also calls for restricting Japan’s participation in the international emission trading. We consider the economic implications of limits on emissions trading and find that they are substantial. Full utilization of international emission trading by Japan reduces the carbon price, welfare loss, and impact on its energy-intensive exports substantially. The welfare loss with full emissions trading is one-sixth that when Japan meets its target though domestic actions only, but Japan can achieve substantial savings even under cases where, for example, the full amount of the Russian allowance is not available in international markets.
Contents
1. Introduction ... 1
2. Climate Change Policy in Japan... 2
3. Trends in Japan’s Energy and Carbon Intensity ... 7
4. The Emissions Prediction and Policy Analysis (EPPA) Model ... 11
4.1. Economic Growth ... 15
4.2. CO2 Emissions ... 16
4.3. Energy Efficiency Improvement ... 16
4.4. Energy Sector ... 17
5. Simulation Results ... 18
5.1 Comparison Using EPPA Reference Parameters... 18
5.2 Sensitivity Tests of Results... 19
5.3 Likely Performance of Technology Subsidies ... 24
6. International Emission Trading ... 25
7. Conclusion... 28
8. References ... 29
1. INTRODUCTION
Japan ratified the Kyoto Protocol in 2002 and adopted “The Guideline for Measures to Prevent Global Warming,” which identified actions to reduce greenhouse gas (GHG) emissions with the goal of meeting the target specified in the Protocol (Government of Japan, 2002). The Guideline required several ministries to submit further reports on progress toward meeting the target and identifying additional actions as needed. A report of the Ministry of Environment of Japan (MOE, 2004a) emphasized a policy mix but with a central focus on a carbon tax. Other policies considered were domestic carbon emission trading, promoting energy research, development of a mandatory greenhouse gas accounting and reporting system, and the adoption of the daylight saving time in summer. The carbon tax, called the Climate Change Tax, was proposed by the Ministry in August 2003 (MOE, 2003). The proposed tax rate was 3400 yen per ton of carbon
* Kasahara is employed by the Electric Power Development Co., Ltd. (J-Power) and is a visiting researcher at the MIT Joint Program on the Science and Policy of Global Change.
(yen/tC) emitted from the combustion of fossil fuels. The proposal would distribute the revenue from the tax to end-use sectors of the economy as a subsidy for a purchase of energy-efficient equipment. The MOE estimates that the Kyoto target for Japan could be met through this tax-and-subsidy method. The MOE report favors this domestic policy over international emission trading, which the report argues should be limited to 1.6% of the 1990 emissions. The Ministry of
Economy, Trade and Industry of Japan (METI) has made their interim report publicly available as well (METI, 2004). In contrast to the MOE, METI emphasized international emission trading as a major tool for greenhouse gas emissions reduction. METI objections to a carbon tax are based on their conclusion that it would be relatively ineffective in the residential and transportation sectors, would damage international competitiveness, and would result in carbon leakage.
The goal of this paper is to analyze the Climate Change Tax proposed by the MOE using the MIT Emission Prediction and Policy Analysis (EPPA) model, a computable general equilibrium economic model that has been widely used to study climate change policy, and then consider the role international emissions trading scenarios as favored by METI could play in reducing
economic impacts. For this analysis, we have adjusted some parameters of the EPPA model to make the results directly comparable to the MOE study. The MOE used the Asia-Pacific Integrated Model (AIM), which includes AIM-EndUse, AIM-Material, and AIM-TopDown components (AIM Project Team, 2003). AIM-EndUse is a bottom-up technology selection model that contains a detailed dataset of existing technologies and energy-related facilities. Results from this AIM component are central to the policy recommendations of the MOE.
The EPPA model structure differs from that of AIM-EndUse. The EPPA model can be considered a top-down model, representing technology by means of relatively aggregated production functions for each sector of the economy. However, on the energy side EPPA
integrates bottom-up engineering information for energy production technologies (Jacoby et al., 2004) The motivation for this study is a comparison of the results from two models that use different approaches to technology representation. We compare the projections with relevant historical experience of Japan, and of demand-side management programs in the U.S. that are in many ways similar to the proposed energy-efficiency subsidy scheme.
In the next section we describe the proposed climate change policy in Japan and summarize the results of the MOE study. In Section 3 we review the historical relationships between energy intensity and carbon intensity in Japan compared with other major industrial countries. In
Section 4 we present the EPPA model and the adjustments we made for a proper comparison between the MOE analysis and our simulations. Section 5 describes the results of analysis of the climate change tax proposed by the MOE. In Section 6 we investigate the role of international emission trading and restrictions on its use in meeting Japan’s Kyoto target. Section 7
summarizes our findings.
2. CLIMATE CHANGE POLICY IN JAPAN
Rising atmospheric concentrations of carbon dioxide and other gases emitted from burning of fossil fuels and other human activity may cause significant global warming in the absence of policy intervention. In response to this threat, Japan ratified the United Nations Framework
Convention on Climate Change and the Kyoto Protocol, which call for industrialized countries to limit their greenhouse gas (CO2, CH4, N2O, HFC, PFC, SF6) emissions. Japan’s emissions target is to return to 6% below a base-year level during the first commitment period of the Protocol. The first commitment period runs from 2008 to 2012. The base-year for CO2, CH4, and N2O is 1990. The Protocol permits some flexibility regarding the choice of a base-year for HFC, PFC, and SF6 gases and Japan has chosen 1995 for them.
The role carbon sinks from land-use change could play in meeting the Kyoto Protocol targets was not fully agreed until the Conference of the Parties (COP) meeting in Marrakesh (UNFCCC, 2001). As a result of agreement there, specific limits on carbon sinks from forest management for each Party were established. Japan’s sink limit was set at 13.0 million tons of carbon per year (MtC/year), or 47.7 million tons of CO2 (MtCO2/year). From Table 1 one can see that the
addition of the 47.7 MtCO2/year to the target would reduce by more than one-half the reduction needed to get from base-year emissions of 1236.9 MtCO2 to the original Kyoto target of 1162.7. This calculation somewhat overestimates the actual importance of sinks because, in the absence of climate policy, emissions in Japan are projected to grow above the base-year level. The full magnitude of the reduction effort is thus greater than the 74.2 MtCO2 difference between the base-year emissions and the Kyoto target, and the possible contribution of sinks proportionally smaller. Nevertheless, the sink allocation is substantial given Japan’s emissions and likely required reduction. It should be noted that while carbon dioxide emissions have grown since 1990, emissions of other greenhouse gases (GHGs) were lower in 2002 compared to their base-year levels. MOE (2003) attributes this reduction to a decrease in domestic coal production, and thus lower methane emissions from that source, and voluntary measures by chemical producing firms that have limited emissions of other GHGs.
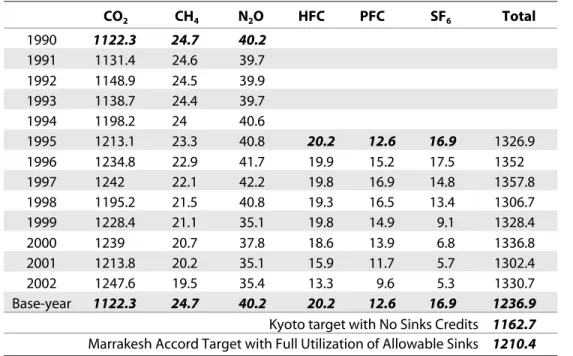
Table 1. Greenhouse Gas Emissions and The Kyoto Protocol Target for Japan (MtCO2e).
CO2 CH4 N2O HFC PFC SF6 Total 1990 1122.3 24.7 40.2 1991 1131.4 24.6 39.7 1992 1148.9 24.5 39.9 1993 1138.7 24.4 39.7 1994 1198.2 24 40.6 1995 1213.1 23.3 40.8 20.2 12.6 16.9 1326.9 1996 1234.8 22.9 41.7 19.9 15.2 17.5 1352 1997 1242 22.1 42.2 19.8 16.9 14.8 1357.8 1998 1195.2 21.5 40.8 19.3 16.5 13.4 1306.7 1999 1228.4 21.1 35.1 19.8 14.9 9.1 1328.4 2000 1239 20.7 37.8 18.6 13.9 6.8 1336.8 2001 1213.8 20.2 35.1 15.9 11.7 5.7 1302.4 2002 1247.6 19.5 35.4 13.3 9.6 5.3 1330.7 Base-year 1122.3 24.7 40.2 20.2 12.6 16.9 1236.9
Kyoto target with No Sinks Credits 1162.7
Marrakesh Accord Target with Full Utilization of Allowable Sinks 1210.4
Note: MtCO2e indicates CO2-equivalent emissions with non-CO2 gases converted at FCCC approved global warming potentials (GWPs).
Measures adopted under the 2002 Guideline encouraged Japanese companies and business associations to carry out voluntary efforts, but did not outline mandatory caps or actions by companies (Government of Japan, 2002). The Guideline did, however, identify a set of reduction goals for different categories of emissions (Table 2). The goal for CO2 emissions from energy use was 2% below 1990 levels. Methane, nitrous oxide, and CO2 emissions from non-energy use were to be reduced by 0.5% from base-year levels, while emissions of HFC, PFC, and SF6 could increase by 2% above base-year levels. Use of the Kyoto mechanisms allowing for international flexibility, including the Clean Development Mechanism (CDM) and Joint Implementation (JI) projects, was seen as meeting the balance of reductions needed to get to 6% below base-year levels. The Guideline document does not mention international emission trading specifically, however, it is generally considered to be one of the “Kyoto flexibility mechanisms.” The extent to which international emission trading could be used by Japan to meet its target would depend partly on how the Kyoto Protocol is implemented by other Parties. Table 2 also presents an assessment of the government’s estimates of emissions in a business-as-usual (BAU) scenario made by MOE (2004a). It shows that energy-related CO2 emissions are expected to increase in 2010 by 7.1% from the base-year level. Carbon dioxide from the non-energy use, methane, and nitrous oxide emissions are expected to meet the target established by the government. The estimate for forest management is insufficient to create credits up to the Marrakesh-agreed limit for sinks. Thus, Japan is expected to miss its Kyoto target without further effort to reduce emissions. The projected failure to meet the target with the voluntary measures identified in the Guideline document led to the MOE’s proposed carbon tax, and METI’s counter proposal to rely more on international emissions trading.
In addition to the interim reports from the Ministry of Environment (MOE) and the Ministry of Economy, Trade, and Industry (METI) already mentioned, the Ministry of Agriculture,
Forestry, and Fisheries (MAFF), the Ministry of Land, Infrastructure, and Transport (MLIT), the Ministry of Internal Affair and Communications (MIC), and the Cabinet Office are required to report on progress toward meeting the Kyoto target. The MAFF (2004) also favored a carbon tax, proposing that the tax revenue should be partially used for forest management activities. The MLIT (2004) report does not refer to any mandatory methods. So far, MIC and the Cabinet have not made public their reports.
Table 2. Required Reduction of Emissions relative to 1990 level and 2010 forecast.
Category
Government
Target 2010 BAU Forecast
CO2 emissions from energy use including reductions by
innovative technologies and change of lifestyle
– 2% +7.1%
CO2 emissions from non-energy use, methane, and nitrous
oxide emissions
– 0.5% – 0.9 ~ – 0.4% Emissions of HFCs, PFCs, and SF6 + 2% Close examination underway
The use of Sinks – 3.9% – 3.1%
The use of the Kyoto Mechanism – 1.6%
Total – 6.0%
In contrast to the government reports, Nippon Keidanren the largest trade association in Japan with 1623 members from energy-intensive sectors and automotive associations, insists that voluntary efforts are sufficient. The association points to the fact that its members’ emissions are below 1990 level despite the shut-down of some nuclear plants and the need to increase the use of fossil electric capacity to make up for the lost nuclear generation. The organization strongly opposes measures such as environmental taxes or domestic emission trading and stresses the fact that Japan has already achieved a lower carbon intensity of GDP (gross domestic product) than other countries. Their claim is based on international comparisons of electric generation
efficiency, energy consumption intensity in iron and steel, and CO2 intensity of chemical production (Nippon Keidanren, 2004a, 2004b).
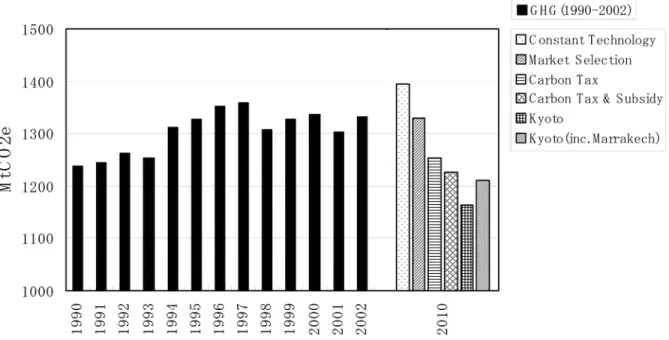
As previously noted, the MOE conclusion about the carbon tax required to meet the Kyoto target was based on the analysis using the AIM model. As already noted, AIM-EndUse is a bottom-up technology model. It can simulate the emissions impact of different technology choices. AIM-Material is a multi-sectoral, economy-wide model of Japan. AIM-TopDown is a global CGE model. These components were variously used in the MOE study. Four scenarios were considered: Constant Technology that keeps current energy technologies and their
efficiency constant, Market Selection that adjusts the selection of energy technologies based on changing prices and costs of technologies, Carbon Tax Only that considers a tax on fossil fuels at the rate of 30,000 yen/tC (or approximately 300 $/tC), and Tax and Subsidy that combines a carbon tax of 3,400 yen/tC (or approximately 34 $/tC) with the tax revenue distributed as a subsidy for the purchase of more energy-efficient technologies. The study reports emissions for the economy disaggregated to five sectors: Industry, Transport, Energy Transformation,
Services, and Households. Emissions from electricity production are allocated to these five sectors based on their electricity use.
The study found the Tax and Subsidy scenario (Table 3) to result in the lowest level of emissions in 2010. It was sufficient to meet the Kyoto emission target. The Tax and Subsidy policy reduced CO2 emissions in 2010 to 14% below the Constant Technology scenario. Notably,
Table 3. Greenhouse gas emissions in AIM-EndUse Model (Mt-CO2e).
2010 Sector 1990 2000 Constant Technology Market Selection Carbon Tax Only Carbon Tax & Subsidy Industry 490 495 470 452 432 427 Household 138 166 193 172 147 136 Office 124 152 162 148 134 127 Transport 212 256 271 263 250 247 Energy transform 77 86 88 86 81 80 Energy-Related CO2 Total 1042 1155 1185 1121 1044 1017 Non-energy-related CO2, CH4, N2O 143 141 137 137 137 137 HFCs, PFCs, SF6 48 36 73 73 73 73 GHG Total 1233 1332 1395 1330 1254 1226 Forest sink – 35.6 – 35.6 – 35.6 – 48.0 Total 1233 1360 1295 1218 1178 Source: MOE (2003).
the Tax and Subsidy scenario, with a tax of just 3,400 yen/tC was projected to result in a greater emissions reduction than Carbon Tax Only scenario with a tax rate of 30,000 yen/tC, as shown in Table 3 and Figure 1. The subsidy portion of this policy was thus estimated to be very effective in reducing emissions. The Market Selection scenario results in GHG emissions in 2010 at the level of 2002 emissions, about 7.5% above 1990 emissions. This closely coincides with the recent MOE (2004a) projection for a business-as-usual scenario (Table 2).
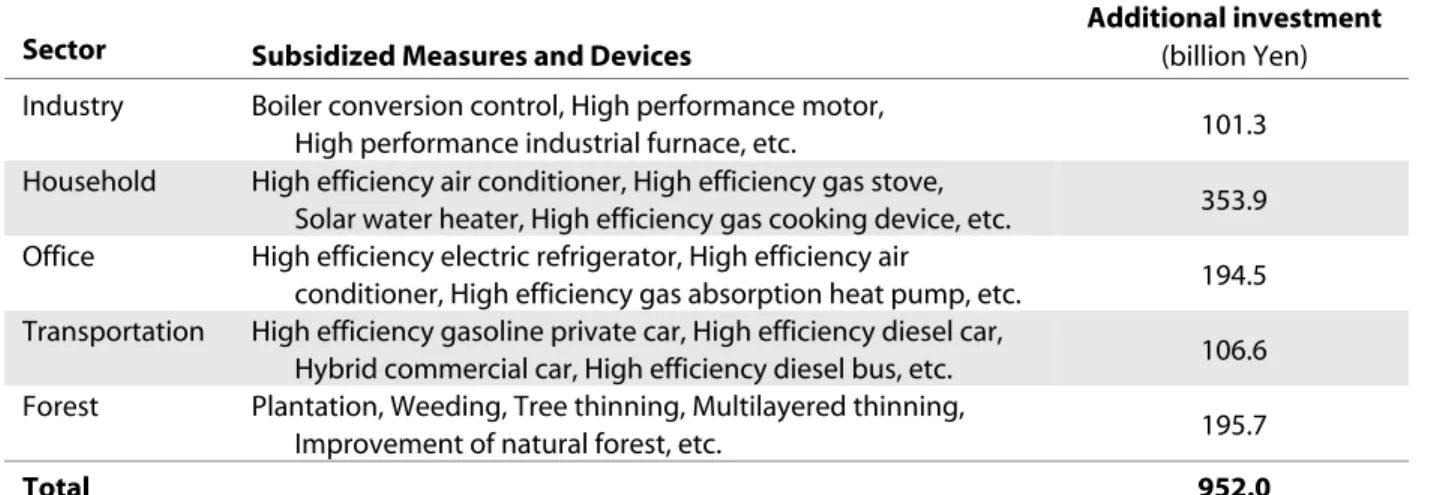
The MOE estimates the Tax and Subsidy policy will result in total annual subsidy of 952 billion yen, to be distributed as in Table 4. Most of the subsidy is directed to encourage investment into higher-efficiency facilities. The subsidy to the forest sector is directed toward offsetting the labor costs of forest management. AIM-Material was used to estimate the GDP change due to these policies. Compared to the Constant Technology scenario the GDP loss was estimated to be 0.16% in the Carbon Tax Only scenario and 0.061% in the Tax and Subsidy scenario.
The structure of the AIM-TopDown submodel did not allow a direct implementation of the scenarios mentioned above. Emissions were constrained with a domestic cap to meet the Kyoto target. The estimated carbon price was $350/tC with a GDP loss of 0.45% compared to the business-as-usual scenario. With international emission trading the GDP loss was estimated to be 0.2%. The MOE (2003) did not report the carbon price in the international emission trading scenario.1
Figure 1. Historical and Future GHG Emissions (Excluding Forest Sinks) as Forecasted by the AIM-EndUse Model, with Kyoto and Marrakesh Targets. (Sources: MOE, 2002; MOE, 2003.)
1
A final MOE report of November 2004 revised the proposed carbon tax rate down to 2400 yen/TC from 3400 rate in the draft (MOE, 2004a). The final report estimates a GDP impact of –0.01% and carbon dioxide emissions reduction of 52 million tons of CO2 from reference levels. Based on the reference, and estimated baseline sink uptake, this would leave Japan needing another 52 million tons of reductions according to the report. It stresses the importance of additional voluntary measures and environmental education of public as means of achieving further reductions. The exact distribution of subsidy is not provided, therefore, we have not modeled this change in the MOE proposal yet.
Table 4. Distribution of Subsidy in AIM-EndUse Model.
Sector Subsidized Measures and Devices
Additional investment
(billion Yen) Industry Boiler conversion control, High performance motor,
High performance industrial furnace, etc. 101.3 Household High efficiency air conditioner, High efficiency gas stove,
Solar water heater, High efficiency gas cooking device, etc. 353.9 Office High efficiency electric refrigerator, High efficiency air
conditioner, High efficiency gas absorption heat pump, etc. 194.5 Transportation High efficiency gasoline private car, High efficiency diesel car,
Hybrid commercial car, High efficiency diesel bus, etc. 106.6 Forest Plantation, Weeding, Tree thinning, Multilayered thinning,
Improvement of natural forest, etc. 195.7
Total 952.0
Source: MOE (2003).
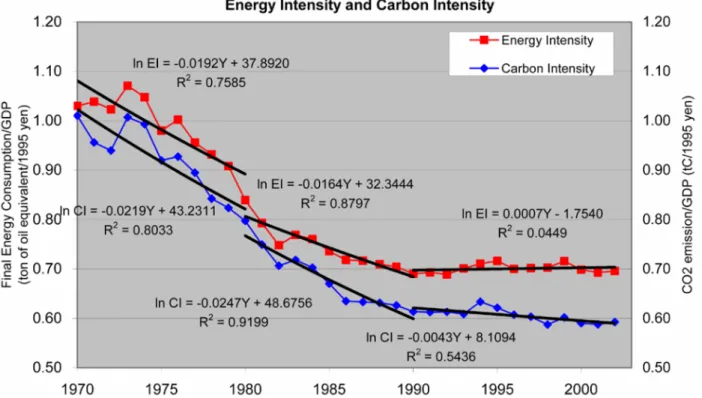
3. TRENDS IN JAPAN’S ENERGY AND CARBON INTENSITY
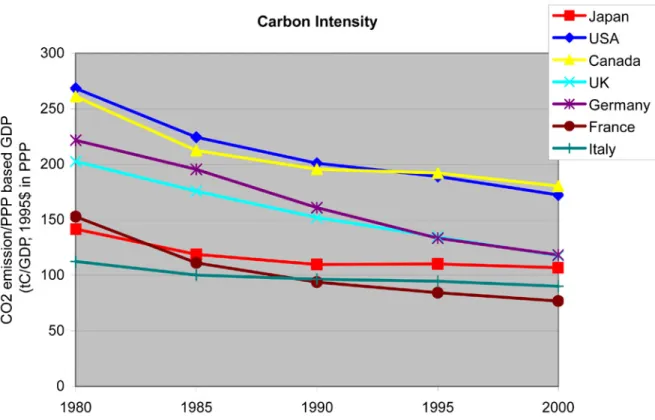
Figure 2 presents trends in carbon intensity for Japan, the USA, Canada, and selected
European countries from 1980 to 2000 calculated from data of the Institute of Energy Economics, Japan (2004) which is in turn based on World Bank and IEA data. For these comparisons, GDP in Purchasing Power Parity (PPP) terms as computed by the World Bank was used. Carbon
intensities for all countries shown in this figure tend to decline over this period, however, Japan’s intensity shows little if any improvement in the 1990s. As a result of this slower improvement, France and Italy overtake Japan. Considerable caution is needed in making comparisons of the absolute intensity levels in such aggregate comparisons. A lower aggregate carbon intensity for a country does not necessarily translate to greater efficiency in individual processes, and thus, for example, this evidence on aggregate intensity does not necessarily contradict the data on energy efficiency of particular processes in material terms that are the basis of the Nippon Keidanren (2004a, 2004b) claim.
One critical element in aggregate comparisons is the choice of a basis for making
international comparisons of output in common currency units. Purchasing Power Parity (PPP) is widely recognized as an improvement over market exchange rates as a basis for converting currency to a common base but it is at best an approximation of any ideal comparison. As an example of the importance of purchasing power conversion, comparing countries as in Figure 2 using market exchange rates would show Japan to have a considerably lower energy and
emissions intensity than all other countries. With the PPP conversion Japan’s intensity is similar to France and Italy.
There are also broad structural differences among countries. For example, relative to Japan, France relies more heavily on nuclear electricity, while Italy imports electricity from other countries and thus any emissions related to this electricity production does not show up in Italy’s carbon account. The mix of fossil fuels, industrial structure, land area, climate, and availability of non-fossil resources such as hydro capacity can also have a large effect on international comparisons of both energy and carbon intensity.
Figure 2. Carbon Intensity in Selected Developed Countries. (Source: Institute of Energy Economics, Japan, 2004.)
Figure 3 focuses on Japan, showing real GDP (1995 prices) and CO2 emissions from 1990 to 2002. During this period CO2 emissions followed the pattern of economic activities, declining during the economic recessions of 1993, 1998, and 2001. Figure 4 shows annual carbon and energy intensity in Japan, and to examine the apparent slowdown in Japan’s improvement that was observed in Figure 2 we extend the time series back to 1970. We then use ordinary least squares (OLS) to fit an exponential time trend for each decade. The estimated coefficient on the year (Y) is then an estimate of the average annual rate of change in energy intensity (EI) and carbon intensity (CI). These calculations show that energy intensity of GDP declined by an estimated 1.9% annually in the 1970s. This was a period with rapidly rising energy prices brought about by the first oil crisis of the early 1970s. Rising prices and concerns about fuel embargos produced strong incentives for energy efficiency and structural change. At the same time, Japan’s economy grew at 4% annually. In the 1980s the average annual improvement in energy intensity fell to about 1.6% while the economy continued to grow by 4% per year. The second oil shock occurred late in the 1970s and brought about another round of rising energy prices that likely affected energy use at least into the early 1980s. By the middle of the decade world oil prices had fallen considerably from their peak. While energy intensity improvement slowed somewhat in the 1980s, carbon intensity improved more rapidly in the 1980s (2.5%/yr.) than in the 1970s (2.2%/yr.). The direct reason for this divergence of energy and carbon intensity was the increased share of nuclear and natural gas in primary energy supply.
Figure 3. Japan’s real GDP and CO2 Emissions. (Data Source: Institute of Energy Economics, Japan 2004; MOE, 2002.)
Figure 4. Energy Intensity and Carbon Intensity in Japan. (Data Source: Institute of Energy Economics, Japan, 2004; EI: Energy Intensity, CI: Carbon Intensity, Y: Year.) 95% confidence limits on Energy Intensity Improvement Rate: 1970s: –2.7% < x < –1.1%; 1980s: –2.1% < x < –1.2%; 1990s and after: –0.1% < x < 0.3%.
Too much should not be made of the slight differences between the performance in the 1970s and 1980s. For one thing, the estimated time trends between decades are not significantly
different from one another at a 95% confidence level. Beyond that, using a decade as the breakpoint is arbitrary. The overall conclusion is that at least in terms of the aggregate
The 1990s offer a strong contrast from the 1970s and 1980s. Both energy and carbon intensity are nearly flat and not significantly different than zero. The point estimate of the average energy intensity actually increased very slightly, while the carbon intensity average decrease was less than 0.5% per year. A number of things changed in Japan in the 1990s. For one, it was a period of slow GDP growth with a rate of 1.4% per year. Unlike the 1970s and 1980s, international energy prices were relatively stable and low. The slight improvement in carbon intensity can again be traced to greater use of nuclear and natural gas, as their share of primary energy supply rose from 9 to 12% and 10 to 14%, respectively (Institute of Energy Economics, Japan, 2004). The actual data plotted in Figure 4 suggest the slowdown of both carbon and energy intensity may have had its roots as early as 1986. Removing the transition years in the late 1980s from the earlier decade estimates would likely thus show an even greater difference between the rapid improvements through about 1985 and the negligible improvement since 1990.
What can Japan expect in terms of energy and carbon intensity improvement in a reference (i.e., no policy) case through the Kyoto commitment period? Will it return to the rapid
improvements of the 1970s and early 1980s, or can it expect performance more like the 1990s? The answer depends in large part on what is behind the change and there are several possible explanations. More detailed statistical analysis that attempt to sort out the effect of energy prices and other factors might help explain the reason for this change, but unfortunately many of the changes occurred together and this high correlation will make it difficult to separate the effect of each factor. Here we identify the leading hypotheses that could explain this change in
performance in the Japanese economy and their very different implications for projections of Japan’s future and the difficulty of meeting the Kyoto target.
If the differences are mainly due to energy prices, then possibly the recently high oil and gas prices may spur improving energy and carbon efficiency. However, the fuel mix change that led to more rapid increases in carbon than energy intensity is unlikely to continue. Gas could
penetrate further but unlike the previous periods when oil prices rise led the way and encouraged a switch to gas, in recent years gas prices have risen rapidly for independent reasons and so there may be less economic incentive to switch from oil to gas even with rising oil prices. As in most other industrial countries, nuclear expansion in Japan has slowed dramatically with few new plants expected to come on line in the near term. Thus, even if rising energy prices spur
improvements in energy intensity, these may not be accompanied by an additional improvement in carbon intensity as occurred in the 1980s. It is worth examining again the cross country comparison of carbon intensity in Figure 2 to note that Japan’s slowdown in the 1990s is more pronounced than most other countries. This suggests that energy prices are not the sole
explanation for it because energy price changes reflect to a large degree changes in international markets that were felt in all countries.
Another hypothesis is that rapid economic growth stimulates rapid energy efficiency improvement. The argument here is that with rapid growth comes a rapidly expanding capital stock, and perhaps rapid replacement of old capital. If the newer equipment and technology is more energy efficient than the old then improvement in energy efficiency will result. It is also likely that structural change is hastened by rapid economic growth, and if structural change is
toward sectors that are less energy and emissions intensive—the service sectors are often offered as a candidate—then the aggregate energy intensity improvement will be faster when economic growth is faster. If these processes are at work then the low economic growth projections for Japan over the next decade would be inconsistent with rapid improvement in energy and carbon intensity. On the other hand, rising energy prices may also stimulate structural shifts and
replacement of capital stock, and so there is likely some interaction between growth and price change as a source of intensity change.
Another possibility is that Japan has exhausted many of the immediate sources of
improvement in energy intensity while other industrial countries have not yet done so. The case to be made here is that Japan has been at the leading edge of intensity change among the
industrial countries. With highly efficient processes already widely adopted in Japan, the next set of energy efficient processes may not be yet proven or possess as clear an economic advantage as did the technologies contributing to the rapid decline in intensity in the 1970s and early 1980s. Another general trend among industrial countries in recent decades was a significant reduction in production of basic materials that are often very energy intensive, such as smelting of ores and energy intensive chemical production. In some cases this reduction in developed countries led to imports of these materials from developing countries. In other cases it reflected increased
recycling of scrap or a structural change toward less demand for these materials. This source of structural change may have reached a limit in Japan. If this is a major reason for a slowdown in intensity improvement then it is difficult to project whether little or no improvement is only a pause until new sources of improvement are identified, or the 1990s experience is a new pattern that will persist for decades. In fact, one can not rule out the possibility that future development of the economy in Japan may lead instead to energy intensity increases, with the 1990s being the turning point in the trend. These patterns could have important implications for Japan, and the world. What had seemed like a reliable trend of improving energy intensity may be ending, and as other industrial countries catch up to Japan they may face a similar situation.
We return to these trends in later sections when we consider our modeling results and compare them to the MOE study results.
4. THE EMISSIONS PREDICTION AND POLICY ANALYSIS (EPPA) MODEL
To analyze the Climate Change Tax policy we apply the MIT Emissions Prediction and Policy Analysis (EPPA) model (Babiker et al., 2001, Paltsev, et al. 2003). EPPA is a recursive-dynamic multi-regional general equilibrium model of the world economy. The version of EPPA used here (EPPA4) has been updated in a number of ways from the model described in Babiker
et al. (2001). Most of the updates are presented in Paltsev et al. (2003). EPPA is built on the
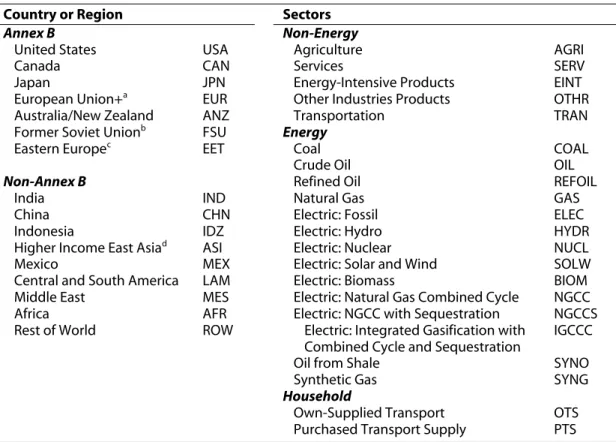
GTAP data set, which accommodates a consistent representation of energy markets in physical units as well as detailed accounts of regional production and bilateral trade flows (Hertel, 1997). Besides the GTAP data set, EPPA uses additional data for greenhouse gas (CO2, CH4, N2O, HFCs, PFCs, and SF6) and urban gas emissions. For use in EPPA the GTAP dataset is aggregated into the 16 regions and 10 sectors shown in Table 5. The base-year of the EPPA model is 1997. From 2000 onward it is solved recursively at 5-year intervals. Because of the
Table 5. Countries, Regions, and Sectors in the EPPA Model.
Country or Region Sectors
Annex B Non-Energy
United States USA Agriculture AGRI
Canada CAN Services SERV
Japan JPN Energy-Intensive Products EINT
European Union+a EUR Other Industries Products OTHR
Australia/New Zealand ANZ Transportation TRAN Former Soviet Unionb FSU Energy
Eastern Europec EET Coal COAL
Crude Oil OIL
Non-Annex B Refined Oil REFOIL
India IND Natural Gas GAS
China CHN Electric: Fossil ELEC
Indonesia IDZ Electric: Hydro HYDR
Higher Income East Asiad ASI Electric: Nuclear NUCL
Mexico MEX Electric: Solar and Wind SOLW
Central and South America LAM Electric: Biomass BIOM Middle East MES Electric: Natural Gas Combined Cycle NGCC Africa AFR Electric: NGCC with Sequestration NGCCS Rest of World ROW Electric: Integrated Gasification with
Combined Cycle and Sequestration
IGCCC
Oil from Shale SYNO
Synthetic Gas SYNG
Household
Own-Supplied Transport OTS Purchased Transport Supply PTS
a
The European Union (EU-15) plus countries of the European Free Trade Area (Norway, Switzerland, Iceland).
b
Russia and Ukraine, Latvia, Lithuania and Estonia (which are included in Annex B) and Azerbaijan, Armenia, Belarus, Georgia, Kyrgyzstan, Kazakhstan, Moldova, Tajikistan, Turkmenistan, and Uzbekistan (which are not). The total carbon-equivalent emissions of these excluded regions were about 20% of those of the FSU in 1995. At COP-7 Kazakhstan, which makes up 5-10% of the FSU total, joined Annex I and indicated its intention to assume an Annex B target.
c
Hungary, Poland, Bulgaria, Czech Republic, Romania, Slovakia, Slovenia.
d
South Korea, Malaysia, Phillipines, Singapore, Taiwan, Thailand.
e
All countries not included elsewhere: Turkey, and mostly Asian countries.
focus on climate policy, the model further disaggregates the GTAP data for energy supply technologies and includes a number of energy supply technologies that were not in widespread use in 1997 but could take market share in the future under changed energy price or climate policy conditions.
Bottom-up engineering detail is incorporated in EPPA in the representation of these alternative energy supply technologies. The synthetic coal gas industry produces a perfect substitute for natural gas. The oil shale industry produces a perfect substitute for refined oil. These potential new sources do not enter over the time periods analyzed here. All electricity generation technologies produce perfectly substitutable electricity except for the Solar & Wind technology, which is modeled as producing an imperfect substitute, reflecting its intermittent output. Biomass use is included explicitly in electric generation.
The EPPA model production and consumption sectors are represented by nested Constant Elasticity of Substitution (CES) production functions (or the Cobb-Douglas and Leontief special cases of the CES). The model is written in GAMS-MPSGE. It has been used in a wide variety of
policy applications (e.g., Jacoby et al., 1997; Jacoby and Sue Wing, 1999; Reilly et al., 1999; Bernard et al., 2003; Paltsev et al., 2003; Babiker, Reilly and Metcalf, 2003).
In order to model the Japanese Climate Change Tax policy in the EPPA model, we introduce the tax of 3400 yen/tC on usage of fossil fuel starting from 2005 and distribute the subsidy of 952 billion yen. Because EPPA units are 1997 U.S. dollars, we convert the numbers using the 1997 exchange rate ($1 = 121 yen), which results in a carbon tax of $28/tC and the total subsidy of $7.87 billion.
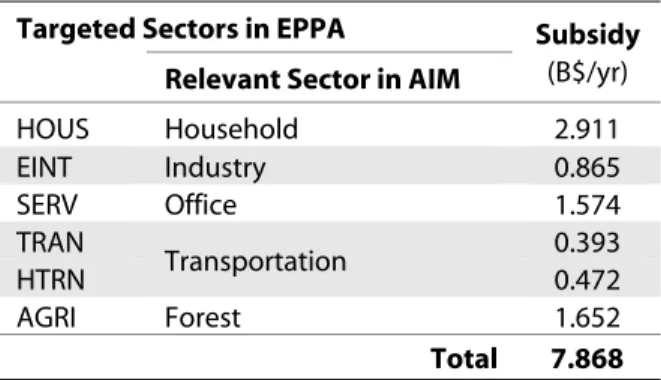
The subsidy is distributed among six sectors of the economy as reported in Table 6. The sectoral structure of the AIM and the EPPA models is different. Therefore, we have made some adjustments in the subsidy distribution (Table 7). Based on covered facilities we assign the AIM industry sector to the EPPA energy-intensive industry sector. We also divide subsidies to the AIM transport sector into the EPPA commercial and household transportation sectors based on CO2 emission shares from the sectors in 1997. The subsidy is modeled as a negative tax on non-energy inputs related to equipment purchases into these sectors that would be the source of more fuel-efficient technology. Fuel use is therefore reduced to the extent the subsidized cost of equipment allows substitution away from fuels and toward equipment.
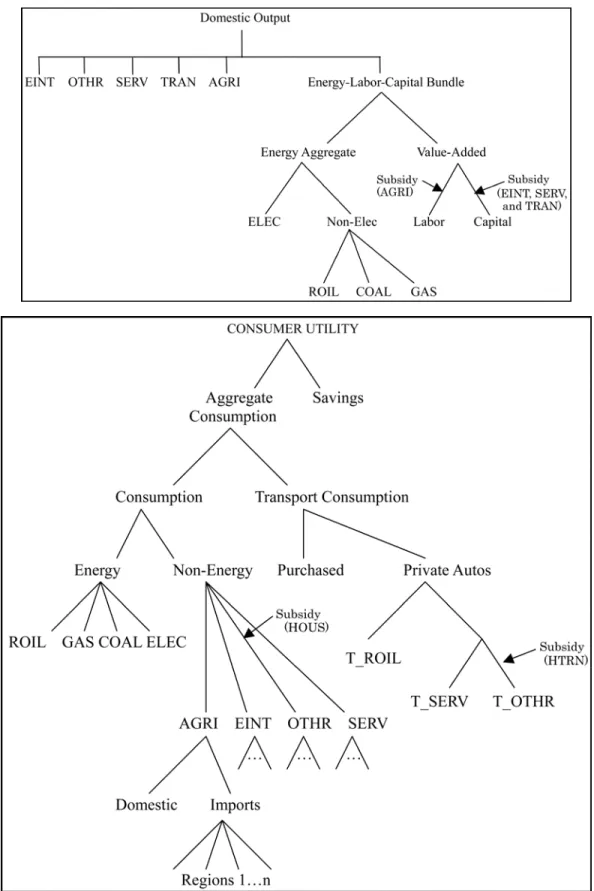
Figure 5 shows where the subsidies were applied within the nesting structures of each sector.
For three industrial sectors (EINT, SERV and TRAN), we adjust the capital input tax because the subsidy is for the equipment and facilities (top panel). For agriculture, we adjust the labor input tax because the subsidy in agriculture is for the activities such as planting, weeding and thinning (bottom panel). There is no explicit capital input into the household, and so for the HOUS and the HTRN sectors the subsidy is applied to the input of the OTHR sector (bottom panel). The OTHR sector produces energy efficient equipment such as high efficient air-conditioners or hybrid cars and these products are to be encouraged through the subsidy. To compare more
Table 6. Targeted Sectors and Subsidy in EPPA. Targeted Sectors in EPPA
Relevant Sector in AIM
Subsidy (B$/yr) HOUS Household 2.911 EINT Industry 0.865 SERV Office 1.574 TRAN 0.393 HTRN Transportation 0.472 AGRI Forest 1.652 Total 7.868
Table 7. Existing Tax, Proposed Subsidy, and Applied Net Rates.
HOUS EINT SERV TRAN HTRN AGRI
Existing tax rate 4.14% 0.00% 0.00% 0.00% 4.14% 0.00% Subsidy, as a rate -0.30% -0.70% -0.28% -0.75% -0.30% -5.23% Applied net rate 3.84% -0.70% -0.28% -0.75% 3.84% -5.23%
Figure 5. Nesting Structure in EPPA, and Application of the Subsidy. Top panel: Nesting Structure of EINT, SERV, TRAN and AGRI Production Sectors in EPPA. Bottom panel: Structure of the
directly with the AIM-EndUse results with regard to the effectiveness of the subsidy we have established the tax subsidy rates so that the subsidy level will be approximately the $7.87 billion dollars estimated in the MOE report regardless of the level of tax revenue estimated to be
collected in the EPPA model. This was done by setting the subsidy rate equal to the subsidy amount to a sector divided by the total value of the input being subsidized in that sector in the EPPA BAU. Because the policy changes input-use somewhat, the actual subsidy level will differ slightly from that estimated in the MOE study. It turns out to be the case that emissions in policy scenarios based on EPPA are as high or higher than those estimated in the MOE report. The EPPA policy thus collects revenue from the carbon tax in excess of the subsidy. We return this excess revenue via a lump sum transfer to the representative consumer.
4.1. Economic Growth
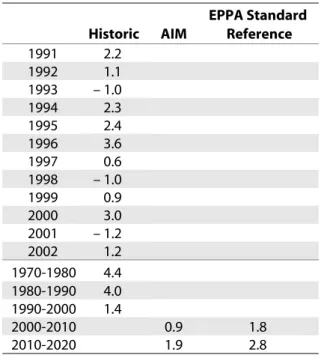
The growth rate of GDP is one of the more important factors in projecting future energy and emissions as shown in the historical relationship in the previous section and as demonstrated in many modeling studies (Weyant and Hill, 1999). Table 8 shows the variability in real GDP growth in Japan in 1990-2002. It varies from 3.6% in 1996 to a negative 1.2% in 2001. GDP grew at an annual average rate of 4.4% between 1970 and 1980 and at 4.0% between 1980 and 1990. The average for the 1990s was only 1.4%. The AIM model sets the growth rate at 0.9% between 2000 and 2010 and at 1.9% between 2010 and 2020 on the basis of Japanese
government’s economic forecast. We have adjusted Japan’s GDP growth rate in the EPPA model to the AIM assumptions. The standard reference case of the EPPA is more optimistic about Japan’s economic recovery and it uses the annual rate of 1.8% for economic growth between 2000 and 2010, and 2.8% during the following decade.
Table 8. Real GDP growth in Japan (%).
Historic AIM EPPA Standard Reference 1991 2.2 1992 1.1 1993 – 1.0 1994 2.3 1995 2.4 1996 3.6 1997 0.6 1998 – 1.0 1999 0.9 2000 3.0 2001 – 1.2 2002 1.2 1970-1980 4.4 1980-1990 4.0 1990-2000 1.4 2000-2010 0.9 1.8 2010-2020 1.9 2.8
4.2. CO2 Emissions
Using the adjusted EPPA model, we simulate the reference case from 1997 to 2020 and compare the sectoral CO2 emissions from the energy related sources in 2000 and 2010 with those from the AIM model. The results are presented in Table 9. The CO2 emissions have been
allocated to sectors following the convention of the AIM model, attributing emissions from electricity generation to end-use sectors on the basis of their electricity use. In Table 9 the corresponding EPPA sectors are listed below the AIM sectors.
Despite the difference in their structure, the AIM and EPPA models project a similar sectoral CO2 emissions distribution. In 2000 carbon emissions from the industry, transportation,
households, and services are close in the two models. However, there are some differences in the emissions from the energy sectors, although this may reflect that fact that we cannot make a sectoral aggregation from EPPA that is completely comparable to that of AIM.
For 2010, Table 9 presents the sectoral emissions from the EPPA model for two scenarios: the standard EPPA reference case and the case where we have adjusted the economic growth in Japan to match the AIM economic projections. As the table shows, the models differ in their projections for the industry sector. Even with the same assumptions about the economic growth, the AIM model forecasts a reduction in emissions from the industry sector of 5%, while in the EPPA model emissions from the industry increase by 3%. Total CO2 emissions in 2010 in the EPPA model are 2.7% higher than in the AIM model. As a result, the required reduction in CO2 emissions to reach the Kyoto target is 14% in the AIM model and 16% in EPPA relative to the BAU emissions.
Table 9. Sectoral CO2 Emissions in a Reference Case (MtCO2). EPPA
Ave. GDP growth of 1.8%/yr Ave. GDP growth of 0.9%/yr
AIM
(Ave. GDP growth of 0.9%/yr)
2000 2010 Absolute Change (%) 2010 Absolute Change (%) 2000 2010 Absolute Change (%) Industry AGRI,EINT,OTHR 524 588 +64 (+12.2) 540 +16 (+3.1) 495 470 – 25 (– 5.1) Household HOUS 151 176 +25 (+16.6) 159 +8 (+5.3) 166 193 +27 (+16.3) Service SERV 162 173 +11 (+6.8) 163 +1 (+0.6) 152 162 +10 (+6.6) Transportation TRAN,HTRN 301 340 +39 (+13.0) 310 +9 (+3.0) 256 271 +15 (+5.9) Energy Transformation COAL,OIL,ROIL,GAS 38 47 +9 (+23.7) 43 +5 (13.2) 86 88 +2 (+2.3) TOTAL 1176 1324 +148 (+12.6) 1217 +41 (+3.5) 1155 1185 +30 (+2.6)
4.3. Energy Efficiency Improvement
The conventional approach for taking technological change into account as it affects energy efficiency in long-term energy projections is to use an exogenous factor conventionally referred to as the Autonomous Energy Efficiency Improvement (AEEI). The AEEI reduces the energy
required in each sector to produce the same amount of output, assuming other things such as energy prices are unchanged. In an actual forward simulation of the model, other things such as energy prices change endogenously, and these changes also affect energy efficiency. Actual energy efficiency of production of each sector in forward simulations is thus a combination of the exogenous AEEI factor, and endogenous effects through changes in fuel and other prices. The AEEI can thus be seen as a reduced-form parameterization of the evolution of non-price induced changes in energy demand. Often it is assumed that AEEI represents technical change, but it should be seen as broadly representing other changes such as in the structure of production within the aggregate sectors (Babiker et al., 2001).
The EPPA assumptions for AEEI among the Annex B countries, implies an energy efficiency improvement in the electric sector of 0.40% to 0.45% per year while non-electric sectors increase in energy efficiency by 1.2% to 1.3% per year. In Japan, the energy efficiency of the electric sector is modeled as improving at a rate of 0.40% per year while non-electric sectors increase in energy efficiency by 1.0% per year. This rate slows gradually in Japan over the period 2000 to 2015 because Japanese energy efficiency is already quite high, and so the options for further improvement may be more limited than in other regions.
4.4. Energy Sector
Because of the domestic availability of resources and other factors, there is a large difference among developed countries in terms of the fuels used to produce electricity, and also in the efficiency of conversion and this affects CO2 emissions among countries. This, in turn, affects the options available to reduce emissions. Table 10 presents the shares of different technologies for electricity production in Japan, Europe, USA, and Canada as they are reported by IEA (1997) and implemented in the EPPA model. In the U.S., for example, more than one-half of the electricity production is from coal. Fuel-switching from coal to gas could in principle reduce emissions from the production of that electricity by one-half or more given the fact that CO2 per exajoule of gas combusted is lower than that of coal. Gas turbine technology is also considerably more efficient than the existing baseload coal generation capacity in the U.S., and this would confer further reduction benefits to a switch to gas in the United States. In contrast, Japan has a relatively low share of the coal-based electricity, limiting the degree to which fuel shifting to gas or oil could reduce emissions, and its coal capacity is more efficient on average than that in the U.S.
Table 10. Electricity Shares and Total Electricity Production in 1997.
Japan Europe USA Canada
COAL 0.19 0.28 0.54 0.17 ROIL 0.18 0.08 0.03 0.02 GAS 0.20 0.14 0.14 0.04 NUCLEAR 0.31 0.36 0.18 0.14 HYDRO 0.09 0.12 0.09 0.61 Other 0.03 0.02 0.02 0.01 Total (1012 kWh) 1.027 2.407 3.670 0.573 Source: IEA (1997)
The potential role of nuclear power in most countries is highly dependent on licensing and siting issues. To take these political factors into account, nuclear power capacity expansion in EPPA is controlled via the growth of a fixed factor that represents fuel supply. The fixed factor growth is an exogenous assumption to reflect limits on expansion because of siting and licensing issues. Generation of nuclear electricity from the installed capacity can respond to price via the ability to substitute capital and labor for the fixed factor—given the structure of EPPA this can be thought of as similar to increasing the capacity utilization factor. In Japan, the nuclear fixed factor is exogenously set to increase at 0.5% per year, thus limiting capacity expansion to this rate. This is somewhat slower than the Japanese government forecast for a 2.5% growth in nuclear capacity but more rapid than in the U.S., for example, where the growth is set to zero.
The existing energy tax system is also important because climate policy can interact with pre-existing taxes to affect the country’s economic cost of climate policy (Paltsev et al., 2004).
Table 11 presents the tax rates on energy use for private consumption as derived from the GTAP
database and used in the EPPA model. This tax is mostly related to the tax of motor vehicle fuels. The highest tax rates are in Europe, Japan is next highest, Canada has much lower taxes, and the USA energy taxes are essentially zero. In construction of these tax rates, the motor fuel excise tax in the U.S., since it is used to fund highway construction, is treated as a user charge for the highway service rather than as a tax. The tax ranking is the same for industrial use of energy. The Climate Change Tax as proposed is an additional tax on fuels beyond the existing fuel taxes in Japan. It is therefore likely to increase the economic loss from these taxes beyond the direct cost of the Climate Change Tax as shown in Paltsev et al. (2004).
Table 11. Tax Rates on Energy Products for a Private Use.
Japan Europe USA Canada
COAL 0.00 0.68 0.00 0.00 ROIL 2.66 4.70 0.00 1.30 GAS 0.28 0.81 0.00 0.09 ELEC 0.04 0.42 0.00 0.09
5. SIMULATION RESULTS
5.1 Comparison Using EPPA Reference Parameters
In order to estimate the effects of the proposed carbon tax in the EPPA model we consider the following scenarios. The business-as-usual (BAU) scenario uses the usual EPPA values and parameters with the adjusted economic growth rate as described above. The Carbon Tax (CT) scenario introduces a carbon tax of $28/tC from 2005 without distributing the subsidy to the sectors. In this case the revenue from the tax is returned to the representative agent in a lump-sum fashion. The Carbon Tax and Subsidy (CTS) scenario considers both the carbon tax and the subsidy to six targeted sectors as described in Section 4. The results of the simulations are presented in Table 12. It shows that GDP and the welfare losses are less than 1.0%.2
Carbon emissions are reduced in 2010 by 5.6% in comparison to the BAU scenario, leaving emissions in
2
Table 12. Change in Energy-related CO2 Emissions, GDP, and Welfare (%) relative to BAU. EPPA AIM CT CTS CT CTS % Change in Emissions 2005 – 5.2 – 5.2 2010 – 5.6 – 5.7 – 11.9 – 14.2 2015 – 5.8 – 5.9 2020 – 6.0 – 6.1 % Change in GDP 2005 – 0.17 – 0.12 2010 – 0.18 – 0.14 – 0.16 – 0.06 2015 – 0.19 – 0.15 2020 – 0.19 – 0.15 % Change in Welfare 2005 – 0.07 – 0.07 2010 – 0.09 – 0.10 2015 – 0.10 – 0.11 2020 – 0.11 – 0.12
2010 12% above the Kyoto target. The CTS scenario shows very little additional emissions reduction compared with the CT case, less than rounding in 2005. A small effects should be expected given the low rate of subsidy (as reported in Table 7), and the fact that we apply the subsidy only on non-energy input. As implemented in our scenario, the subsidy is thus a fairly blunt incentive instrument, not very narrowly targeted to improving energy efficiency. These results differ in important ways from the AIM results. First, BAU emissions in EPPA are somewhat higher than in AIM, as shown in Table 9, requiring a bigger reduction to meet the Kyoto Target. Second, the Climate Change Tax is less effective in EPPA than in AIM at reducing emissions. Third, the subsidy has much less impact in EPPA than in the AIM results. Together these differences mean the EPPA results for the CTS case leave Japan far from meeting the Kyoto Target, whereas AIM found this policy to be sufficient to meet the target.
5.2 Sensitivity Tests of Results
Clearly the parameters determining the baseline energy intensity improvement and response to the subsidy are important assumptions in the EPPA model results, and these are uncertain. Moreover, our approach of subsidizing capital or labor could be criticized because it may not target energy-saving technology as effectively as is possible. We thus turn our attention to further examine energy intensity given that improving energy efficiency is a central objective of the Climate Change Tax policy proposed by the MOE. We first test the sensitivity of results to the AEEI in the BAU case (i.e., without the Climate Change Tax). We then consider alternative AEEI assumptions in combination with the CTS scenario.
We study sensitivity to AEEI in the general economy, leaving the AEEI in the electric sector unchanged because the subsidy is to be paid to technologies in the energy use sectors, not to those in electric generation. We consider the following growth rates of AEEI beginning in 1997:
1.0 (default value; BAU case), 1.5, 2.0, 2.5 and 0 (zero)% in the BAU scenario. We then calculate the resulting changes in projected aggregate energy intensity. Recall that the rate of intensity change will be the combined effect of the AEEI and endogenous factors such as
structural change and response to changing prices, as well as the unchanged rate of improvement in the electricity generation sector.
At the reference AEEI of 1.0% per year energy intensity declines by approximately 0.5% per year in the decade between 2000 and 2010, and intensity improvement increases to over one percent in the following decade (Figure 6). This is a considerably more rapid improvement than in the 1990s when energy intensity was virtually unchanged, but not nearly as rapid as the rate in the 1970s and 1980s. An assumption of a zero change in AEEI still results in a 0.3 to 0.4% annual decrease in Japan’s energy intensity of GDP for the 2000-2010 period, faster than the rate of the 1990s. An AEEI of 2.0 and 2.5 results in an intensity improvement of 1.8 to 2.0% per year. This is at the high end or beyond the rate experienced in the 1970s and 1980s.
Figure 6. Energy Intensity Sensitivity to AEEI Assumptions
As shown in Table 13, these different assumptions about AEEI make large differences in the BAU emission projections. While the assumption of 1.0% growth in AEEI puts Japan in the BAU scenario 19.1% above the Kyoto requirement, the assumption of 2.5% growth in AEEI reduces the excess emissions to 2.8%. On the other hand, if intensity improvement remains very low (with AEEI at zero) Japan could find itself nearly 24% above the Kyoto target absent specific climate policies. Also note that higher energy efficiency is a form of improved productivity, meaning that products can be produced with less cost. Higher AEEI thus also increases economic growth. Note that Table 13 reports the GDP effect in terms of change from the reference in that year. A 2.0% increase in GDP in 2020 above the reference translates into less than a 0.1% increase in the annual rate of growth of GDP over a 20 year period.
Table 13. Change in GDP, CO2 emissions and excess of emissions over the Kyoto target (%) in the BAU scenario with different rates of AEEI relative to the BAU with 1% of AEEI.
AEEI rates: 1.5% 2% 2.5% 0 % Change in GDP 1997 0.00 0.00 0.00 0.00 2000 0.11 0.22 0.32 – 0.29 2005 0.24 0.47 0.68 – 0.41 2010 0.39 0.75 1.09 – 0.64 2015 0.56 1.08 1.55 – 1.15 2020 0.76 1.43 2.04 – 1.80 % Change in Emissions 1997 0.0 0.0 0.0 0.0 2000 – 1.5 – 3.1 – 4.5 2.8 2005 – 3.2 – 6.2 – 9.2 3.2 2010 – 4.8 – 9.4 – 13.7 4.0 2015 – 6.5 – 12.5 – 18.0 7.5 2020 – 8.2 – 15.6 – 22.4 11.4
% Emissions above the Kyoto target
2010 13.4 8.0 2.8 23.9
We now turn to the potential further interaction between energy efficiency improvement and the Climate Change Tax. The difference in AIM and EPPA results can be interpreted in at least two ways. One interpretation is that the EPPA model may simply underestimate the likely future energy intensity improvement in the no-policy reference. With a higher or lower rate of energy intensity improvement in the BAU, the CTS case will come closer or further, respectively, from the Kyoto target. Another interpretation is that the subsidy plan and voluntary measures
encouraged by the Japanese government may somehow stimulate energy efficiency improvement far more effectively than estimated endogenously within the EPPA model, perhaps by targeting the subsidy more effectively than we have through a subsidy of capital, labor, or other equipment purchase. In this second case the argument would be that these subsidies overcome barriers to adoption of what turns out to be economically preferable technologies.
To approximate this latter interpretation we assume different growth rates of AEEI starting after 2005, as if they were a response to introduction of the carbon tax and subsidy. The scenarios labeled CTS1.5, CTS2, and CTS2.5 in Table 14 reflect a growth in AEEI of 1.5, 2.0, and 2.5% respectively. We compare the policy results against the BAU scenario with a growth rate of AEEI of 1.0%. The calculation shows that to meet the Kyoto target with the proposed carbon tax we need to assume that the subsidy would increase the exogenous energy efficiency growth to 2.5% per year (CTS2.5). This assumption implies an overall energy intensity improvement above 2.0% per year, which is more rapid than Japan experienced in the 1970s and 1980s when the economy was growing rapidly and energy prices created large incentives to reduce fuel use. Compared with the reference case, GDP also increases in the policy cases with higher AEEI. The exogenous improvement in the AEEI is a boost to economic activity that more than offsets the negative effect of the introduction of the carbon tax. Again, it is only possible for a policy of this type to increase GDP if the subsidy and education efforts serve to overcome barriers to adoption of technologies that turn out to be economically superior to those that otherwise would have been chosen.
Table 14. Change in GDP, CO2 emissions and excess of emissions over the Kyoto target (%) in the CTS scenarios with different rates of additional AEEI relative to the BAU scenario.
Scenarios: CTS CTS1.5 CTS2 CTS2.5 % Change in GDP 1997 0.00 0.00 0.00 0.00 2000 0.00 0.00 0.00 0.00 2005 – 0.12 – 0.12 – 0.12 – 0.12 2010 – 0.14 0.21 0.53 0.83 2015 – 0.15 0.39 0.87 1.32 2020 – 0.15 0.59 1.25 1.84 % Change in Emissions 1997 0.0 0.0 0.0 0.0 2000 0.0 0.0 0.0 0.0 2005 – 5.2 – 5.2 – 5.2 – 5.2 2010 – 5.7 – 9.8 – 13.7 – 17.4 2015 – 5.9 – 11.6 – 16.9 – 21.9 2020 – 6.1 – 13.5 – 20.2 – 26.4
% Emissions above the Kyoto target
2010 12.4 7.5 2.8 – 1.5
Given that CTS2.5 achieves the Kyoto target and is thus similar to the AIM results, we examine sectoral reductions from BAU for that case and compare them to the AIM results (Table 15). Total carbon emissions are reduced by 17% from BAU in the EPPA model and by 14% in the AIM model. Sectoral emissions show differential reduction of 8-31% in the EPPA and of 9-29% in the AIM. Both models predict that the highest percent reductions come from the household and service sectors. In absolute terms, the biggest reduction comes from industry (83 Mt) in the EPPA model and from the household sector (57 Mt) in the AIM model.
Table 15. Sectoral CO2 emissions in EPPA and AIM (Mt-CO2).
EPPA AIM BAU CTS2.5 BAU CTS 2000 2010 (a) 2010 (b) (b)–(a) (%) 2000 2010 (c) 2010 (d) (d)–(c) (%) Industry AGRI,EINT,OTHR 524 540 457 – 83 (– 15%) 495 470 427 – 43 (– 9%) Household HOUSE 151 159 115 – 44 (– 28%) 166 193 136 – 57 (– 29%) Service SERV 162 163 112 – 51 (– 31%) 152 162 127 – 35 (– 22%) Transport TRAN, HTRN 301 310 286 – 24 (– 8%) 256 271 247 – 24 (– 9%) Energy Transformation COAL,OIL,ROIL,GAS 38 43 36 – 7 (– 16%) 86 88 80 – 8 (– 9%) TOTAL 1176 1217 1006 – 211 (– 17%) 1155 1185 1017 – 168 (– 14%)
Figure 7 compares sectoral emissions from the EPPA forecasts for 2010 in the BAU, CTS,
and CTS2.5 scenarios using the sectoral aggregation in EPPA that does not allocate electricity emissions to end-use sectors. In the BAU, the total CO2 emissions are 1217 Mt with the electric sector being the leading emitter, accounting for one-third of the total emissions. The energy intensive industry sector and the transportation sector follow with 20% and 13% shares of total emissions, respectively. An introduction of the carbon tax with subsidy causes the total emission to fall to 1148 Mt. The CTS2.5 case results in an additional 142 Mt reduction to 1006 Mt.
Figure 7. Sectoral CO2 Emissions from EPPA in the BAU, CTS and CTS2.5 scenarios.
Notably more than half of the additional 142 Mt reduction comes from the electric sector where we have not adjusted the energy efficiency because the electric sector does not benefit directly from the proposed subsidy. Reduced emissions from the electric sector are due instead mainly to the fact that improved efficiency elsewhere in the economy leads to a reduction in the demand for electricity, and that reduction is disproportionately from fossil fuel generation (Figure 8). In the reference case, total electric generation gradually increases from 0.913 to 0.949 x 10¹² kWh during the period, and the shares by generation type change little. In contrast, in the CTS2.5 scenario total generation is 13% lower than in the BAU, with fossil fuel generation falling by 20%.
We have focused on the CTS2.5 case because it meets the Kyoto target. However, serious questions can be raised about the likelihood of energy intensity improving at such a rapid rate. As we reviewed in Section 3, energy intensity improvement at the rate implied in this scenario
Figure 8. Electric Generation in EPPA in the BAU, CTS, and CTS2.5 scenarios.
would be faster than even that of the 1970s and 1980s, a period of rapid economic growth and major structural change in Japan, and of sharp increases in energy prices. While energy prices have risen in the last couple of years and the Climate Change Tax would further increase them, in real terms they remain below the peaks reached in the 1970s and so it is not clear that energy prices will provide the same incentive to improve energy efficiency as in the 1970s and early 1980s. In addition, the forecast BAU growth rate of GDP in these scenarios, set to match the government forecast as used in the AIM model (see Table 8), is even slower for 2000 to 2010 than the 1990s, and it only recovers to the 1990s rate after 2010. With this relatively slow rate of growth, it seems less likely that there will be a major transformation of the capital stock and restructuring of the economy as occurred in the 1970s and 1980s.
5.3 Likely Performance of Technology Subsidies
The EPPA model can be used to test likelihood that subsidy incentives in the Climate Change Tax plan can encourage energy efficiency improvements of the magnitude estimated in the AIM analysis. A large portion of the carbon saving in the EPPA estimate comes from reduced demand for electricity, and evidence of the effect of technology subsidies can be seen in the experience of demand-side management by electric utilities in the U.S. These measures became popular among utilities as a way of avoiding the need to construct new capacity, and self-reporting by the
utilities seemed to suggest they were successful at reducing energy use through subsidizing purchase of high efficiency equipment and through other demand-side measures. However, a
recent study by Loughran and Kulich (2004) seriously questions the effectiveness of these programs. They note that electric utilities in the U.S. spent $14.7 billion between 1989 and 1999 on these programs, and based on their self-reported electricity savings they calculate the cost of these programs at $0.029 per kWh of saved electricity. Other estimates in the literature they review find costs per kWh saved in a similar range. Loughran and Kulich (2004) challenge the self-reported savings by using econometric techniques to statistically estimate the electricity savings. They find much lower actual savings, and arrive at an estimated cost per kWh saved as high as $0.223. Even among the subset of utilities that they found were most effective at
demand-side management the cost per kWh was still $0.064, more than twice the self-reported cost average for all utilities.
If we assume the demand-side management experience in the U.S. is relevant to Japan’s subsidy plan, we can use these results to estimate an average cost per ton of carbon reduced. To do this, we use the average carbon emissions per kWh of reduced generation in the simulation results when we compare CTS and CTS 2.5. If the program is as successful as self-reported by the U.S. utilities and costs $0.029 per kWh, the average cost per ton of carbon is $155/tC.3
If cost is at the high end of the Loughran and Kulich estimate of $0.223 kWh saved then the cost per ton of carbon is $1193/tC. If the program can do as well as the sub-sample of utilities that Loughran and Kulich found to be most effective at demand-side management, then the cost is $342/tC.4
These results suggest that, if U.S. historical experience is only approximately relevant to Japanese conditions, the proposed subsidy program will likely prove economically unattractive. Even at the most optimistic estimate of $0.029 per kWh the average cost per ton of carbon saved is far higher than the marginal tax rate, which is only $28 per ton. Thus it is questionable whether the subsidy will bring forth the large reductions estimated in the MOE (2003) report. If anything, our EPPA model results for the CTS case may be overly optimistic unless energy intensity improvement rebounds substantially from the poor performance of the 1990s.
6. INTERNATIONAL EMISSION TRADING
If the domestic Climate Change Tax is likely to be insufficient to reduce Japan’s emissions to the Kyoto Protocol target, what role could international emissions trading play. The MOE report published in 2003 (MOE, 2003) recommends limiting the contribution of international emission trading to 1.6% of the 1990 emissions. The EPPA model can simulate the emission trading of all six greenhouse gases mentioned in the Kyoto Protocol, but here we consider only CO2 trading for comparison with the AIM model results. The constraints for the Annex B Kyoto member countries are set to include the full amount of carbon sinks provided in the Marrakesh agreement (UNFCCC, 2001). The EPPA model can also simulate a country’s domestic policy both in terms of carbon price constraint or a quantity constraint. Instead of assigning a certain carbon tax as before, here we assign the quantity constraints for the Annex B countries and analyze the
3 Our calculations of cost per ton assume a carbon intensity of electric generation of 0.686 kg-CO 2/kWh. 4
Note also that the Loughran and Kulich (2004) results are for an average cost, and the Climate Change Tax is a marginal cost. We do not have the information from Loughran and Kulich on marginal cost, which one would expect to be higher than the average.
changes in welfare, production, consumption, and the resulting carbon prices. We set a growth rate in AEEI in Japan at the original reference value of 1.0%. We introduce the carbon policy in 2010 and compare the BAU scenario with the scenarios where the Kyoto targets are imposed with or without international emission trading. Potential emission reduction credits from Clean Development Mechanism or Joint Implementation projects are not taken into account in these scenarios.
It has been widely recognized in previous studies that the potential for emissions trading to reduce cost is greatly affected by sale of “hot air” from the former Soviet Union. “Hot air” refers to the fact that the emission quotas for Russia and Ukraine appear to be in excess of their
expected emissions for the Kyoto commitment period under BAU conditions. The generous allocation came about because 1990 was used as the baseline for Kyoto reductions. Due to the severe economic downturn in these countries immediately after 1990, emissions fell by nearly one-half and few if any analysts expect emissions to recover to 1990 levels by the Kyoto
commitment period (Victor et al., 1998; Paltsev, 2000). The allocation of the “hot air” essentially relaxes the constraint on the Annex B parties if they are made available through the flexibility mechanisms in the agreement. It is not clear if Russia and Ukraine will be able to sell the full amount of their “hot air” or that it would be desirable for them to do so as they may have an interest in banking the allowances for future use or restricting sales to exercise market power (Bernard et al., 2003). There has also been resistance among some Parties, such as the European Union, to use this hot air because purchasing it does not result in any environmental benefit. One proposed solution is the Green Investment Scheme (GIS). In this scheme “hot air” would be exchanged with Annex B parties if they invested in “green” projects in the hot air countries. Green projects could be environmental management capacity-building or any project deemed environmentally friendly even if it had no particular direct effect on greenhouse gas emissions. This requirement would answer the concern of Annex B Parties that the hot air purchase had no environmental benefit (Moe et al., 2001; World Bank et al., 2004).
The various uncertainties in the availability of international emissions allowances and possible limits to trade, lead us to consider the following cases.
No Emission Trading – all Kyoto parties meet their constraints by domestic policies; Full Emission Trading – all Kyoto parties participate in the international emission trading
using the full amount of “hot air” from the former Soviet Union;
No Inclusion of FSU – same as above but the former Soviet Union is not included in the
international emission trading;
BAU Capped – same as above but the former Soviet Union is capped at its BAU level to
exclude “hot air,” and therefore emissions permit sales are possible only to the extent abatement below the BAU occurs.
Tables 16 and 17 presents the results of these simulations. Under the No Emissions Trading
case Japan reaches the Kyoto target at a domestic carbon price of $166/tC. In the Full Emission
Trading case we estimate that Japan would buy 155 MtCO2 of allowances (or about 75% of the required reduction) with an international carbon price of $24/tC to meet its Kyoto target. This amount of purchased allowances is well above the proposed MOE limit (MOE, 2003) of