HAL Id: hal-00799608
https://hal.archives-ouvertes.fr/hal-00799608
Submitted on 27 Aug 2020
HAL is a multi-disciplinary open access
archive for the deposit and dissemination of
sci-entific research documents, whether they are
pub-lished or not. The documents may come from
teaching and research institutions in France or
abroad, or from public or private research centers.
L’archive ouverte pluridisciplinaire HAL, est
destinée au dépôt et à la diffusion de documents
scientifiques de niveau recherche, publiés ou non,
émanant des établissements d’enseignement et de
recherche français ou étrangers, des laboratoires
publics ou privés.
changes: Meki River, Ethiopia
D. Legesse, T. A. Abiye, Christine Vallet-Coulomb, H. Abate
To cite this version:
D. Legesse, T. A. Abiye, Christine Vallet-Coulomb, H. Abate. Streamflow sensitivity to climate and
land cover changes: Meki River, Ethiopia. Hydrology and Earth System Sciences Discussions,
Euro-pean Geosciences Union, 2010, 14 (11), pp.2277-2287. �10.5194/hess-14-2277-2010�. �hal-00799608�
www.hydrol-earth-syst-sci.net/14/2277/2010/ doi:10.5194/hess-14-2277-2010
© Author(s) 2010. CC Attribution 3.0 License.
Earth System
Sciences
Streamflow sensitivity to climate and land cover changes:
Meki River, Ethiopia
D. Legesse1, T. A. Abiye2, C. Vallet-Coulomb3, and H. Abate1
1Addis Ababa University, Department of Earth Sciences, P. O. Box 1176, Addis Ababa, Ethiopia 2School of Geosciences, University of the Witwatersrand, Johannesburg, South Africa
3CEREGE-CNRS/UMR 6635, B.P. 80, 13545 Aix-en-Provence cedex 04, France
Received: 1 June 2010 – Published in Hydrol. Earth Syst. Sci. Discuss.: 12 July 2010 Revised: 9 November 2010 – Accepted: 11 November 2010 – Published: 17 November 2010
Abstract. Impacts of climate and land cover changes on streamflow were assessed using a hydrological modeling. The precipitation runoff modeling system of the US Geo-logical Survey was modified in order to consider wetlands as a separate hydrological response unit. Initial model pa-rameters were obtained from a previously modeled adjacent catchment and subsequent calibration and validation were carried out. The model calibration and validation periods were divided into three. The calibration period was a five years period (1981–1986). The validation period was divided into two: validation 1 (1986–1991) and validation 2 (1996– 2002). Model performance was evaluated by using joint plots of daily and monthly observed and simulated runoff hydro-graphs and different coefficients of efficiency. The model coefficients of efficiency were 0.71 for the calibration period and 0.69 and 0.66 for validation periods 1 and 2, respectively. A “delta-change” method was used to formulate climatic sce-narios. One land cover change scenario was also used to as-sess the likely impacts of these changes on the runoff. The results of the scenario analysis showed that the basin is more sensitive to increase in rainfall (+80% for +20%) than to a decrease (−62% for −20%). The rainfall elasticity is 4:1 for a 20% increase in rainfall while it is 3:1 for a 20% re-duction. A 1.5◦c increase in temperature resulted in a 6% increase in potential evapotranspiration and 13% decrease in streamflow. This indicates that the watershed is more elas-tic to rainfall increase than temperature. The proposed land cover scenario of converting areas between 2000 to 3000 m a.s.l. to woodland also resulted in a significant decrease in streamflow (11.8%). The study showed that properly cali-brated and validated models could help understand likely im-pacts of climate and land cover changes on catchment water balance.
Correspondence to: D. Legesse
1 Introduction
Climate change can cause significant impacts on water re-sources through changes in the hydrological cycle. The change in temperature and precipitation components of the cycle can have a direct consequence on the quantity of evapo-transpiration and runoff components. Consequently, the spa-tial and temporal water resource availability, or in general the water balance, can be significantly affected, which clearly amplifies its impact on sectors like agriculture, industry and urban development (Hailemariam, 1999).
Land cover change, associated with the intensification of agriculture, cattle raising and urbanization, could have a profound influence on the hydrological processes in small watersheds and at a regional level (Mendoza et al., 2002). Streamflow plays an important role in establishing some of the critical interactions that occur between physical or ecological processes and social or economic processes (Choia and Dealb, 2008).
The purpose of water resources management is often to mitigate or prevent the adverse impacts of excessive runoff or shortage of water. Hydrological models have served as a valuable tool in water resources management for many years and are usually used to simulate the impacts of proposed land use/ land cover and climate change scenarios and to evalu-ate management strevalu-ategies. Generally, hydrological models provide a framework in which to conceptualize and investi-gate the relationships between climate and water resources (Leavesley, 1994; Lazzaratto et al., 2006; Kunstmann and Stadler, 2005; Choi and Deal, 2008). Global Climate Models that simulate long-term trends in climate (rainfall, tempera-ture, humidity) are often unsuitable for regional scale stud-ies because of the course grid-size resolution. Consequently, there is a strong need for hydrological modeling tools that can be used to assess the likely effects of land cover as well as climate changes on the hydrological cycle at a catchment scale.
The Ethiopian Rift system hosts a series of lakes that are mainly fed by water flowing from the surrounding highlands and escarpments. Over the past few decades there has been a lot of activities that have modified the land use/land cover in the region (Jansen et al., 2009). Moreover, the hydrological dynamics has been strongly modified by intensive agricul-tural activities. This has a direct impact on the lakes down-stream. Therefore, it is very important to understand the functioning of these lake catchments and their hydrological response under different land use/cover and climate change scenarios. Moreover, the water resources development of the basin requires a judicious planning for the protection of the fragile ecosystem.
This study will focus on a catchment scale hydrological modeling of the Meki River basin, which is part of the Cen-tral Main Ethiopian Rift lakes system.
The main objectives of this study are:
1. Test and validate a modified Precipitation Runoff Mod-eling System (PRMS) and assess the model perfor-mance in the basin.
2. Assessing the impacts of land cover and climate change scenarios on the catchment’s streamflow.
For this study a physically based distributed-parameter catchment scale hydrological model called PRMS was se-lected. The model was then modified to accommodate the prevailing conditions of the catchment as described below.
2 Description of PRMS
PRMS is a modular-design, physically based deterministic, distributed-parameter modeling system developed by the US Geological Survey to evaluate the impacts of various com-binations of precipitation, climate, and land use on stream-flow, sediment yields, and general basin hydrology (Leaves-ley et al., 1983). Basin response to normal and extreme rain-fall events can be simulated to evaluate changes in water-balance relationships, flow regimes, flood peaks and vol-umes, soil-water relationships, sediment yields, and ground-water recharge (Leavesley et al., 1983). PRMS is physically based in that each component of the hydrological system is simulated with known physical laws or empirical relations formulated on the basis of measurable watershed characteris-tics. The modular design of PRMS provides a flexible model-ing capability while allowmodel-ing changes and adaptations to cer-tain specific catchments. Detailed description of the model as well as the model itself can be obtained from Leavesley et al. (1983) and the USGS website.
PRMS is integrated in the Modular Modeling System (MMS), which is a modeling platform that has parameter-optimization, sensitivity analysis as well as real-time display capabilities. PRMS can be run in daily and storm mode time scales. The daily mode simulates daily average runoff and
the storm mode simulates runoff at time intervals that may be shorter than a day.
PRMS components are designed around the concept of partitioning a watershed into units on the basis of char-acteristics such as slope, aspect, vegetation type, and soil type and precipitation distribution. Each unit is con-sidered homogeneous with respect to its hydrological re-sponse and is called a hydrological rere-sponse unit (HRU) (Leavesley et al., 1983; Flugel, 1995).
A water balance and an energy balance are computed daily for each HRU. The sum of the responses of all HRU’s, weighted on a unit area basis, produces the daily system re-sponse and streamflow from the watershed. Partitioning pro-vides the ability to impose land use or climate change on parts or all of a watershed, and to evaluate the resulting hy-drological impacts on each HRU and on the total watershed. In PRMS a watershed is conceptualized as a series of reser-voirs whose outputs combine to produce the total watershed response: the impervious-zone reservoir, the soil-zone reser-voir, the unsaturated subsurface reservoir and the groundwa-ter reservoir (Leavesley et al., 1983). Daily total streamflow from the watershed’s outlet is the sum of surface runoff, sub-surface interflow and baseflow.
One of the compelling reasons for the choice of this model is that it has already been tested in the same region with an apparent success (Legesse et al., 2003). Although the two catchments have similar watershed and climatic contexts, they also exhibit differences. One marked difference is the fact that the Meki River traverses a vast wetland area that modifies its hydrological behavior. Since wetlands are not explicitly represented in the original PRMS, it was modified to take into account the wetland as one HRU. This is more ap-propriate than trying to use the original model as it is, which may well provide a ’good’ result through calibration, a sit-uation which Goswami and O’Connor (2010) referred to as models that are “right for the wrong reason”.
2.1 Model building using the modular modeling system
The original PRMS doesn’t take wetlands and lakes into ac-count and hence couldn’t be directly used for this study. The original soil moisture balance module was replaced by a new one modified by Mastin and Vaccaro (2002). The gen-eral schematics of the various modules constituting PRMS is shown in Fig. 1.
In the modified soil moisture balance module, a new soil type representing water-covered areas was added (Mastin and Vaccaro, 2002). For this soil type, the actual evapotran-spiration was set to 1769 mm, which approximates the mean annual evaporation from Lake Ziway (Vallet-Coulomb et al., 2001). Moreover, land cover parameters were made to repre-sent bare ground as suggested by Mastin and Vaccaro (2002). This way the vast wetland area in the Meki catchment was modeled as one HRU.
Figure 1: Specific modules linked to build PRMS for Meki Catchment
Fig. 1. Specific modules linked to build PRMS for Meki Catchment.
3 Description of the Meki Basin
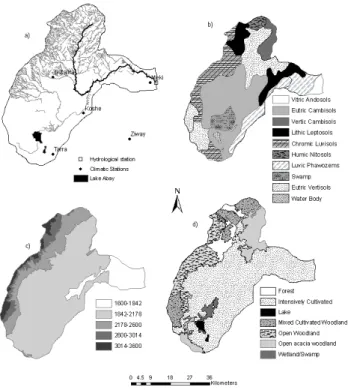
The Meki River basin, which is part of the Ziway-Shalla basin, is located in the northern part of the Main Ethiopian Rift (Fig. 2). The area extends from a chain of mountains upstream, called the Guraghe Mountains, to the low-lying Ziway Lake. The total gauged basin area of Meki is about 2154 Km2. Topography of the area is primarily determined by the rift system of faulting. The study area lies within alti-tudes ranging from 3600 m a.s.l. in the west to 1600 m a.s.l. in the rift floor with a mean elevation of 2056 m a.s.l. The upper riches of the basin are steep and mountainous while the lower basin is flat with a broad valley (Fig. 3).
The western plateau of the Gurage highlands with eleva-tion ranging from 3500 to 3600 m a.s.l. are the perennial sources of the Meki River while the tributaries in the escarp-ment and rift floor are intermittent sources. The Meki River drains the western mountains and escarpments including a vast swampy area and travels for about 100 km before drain-ing to Ziway Lake. The highland is characterized by higher drainage density than the escarpments and the flat rift floor areas. Rift faults have affected the drainage of the area both by determining the river courses and by impounding river water and causing some marshy areas (Chernet, 1982).
The land cover of the study area can be categorized mainly as agricultural, with open woodlands, forest, and water bod-ies. Some Irrigation activities are practiced along the courses of the Meki River. Teff (Eragostis tef ) is a leading cereal crop on the hilly areas covered by deep soils and higher rain-fall while maize and wheat are more prevalent on the valley floor with lower rainfall. Haricot beans (Phaseolus vulgaris), horse beans (Vicia fabal L), peas (Pisum sativum L), chick-peas (Cicer arietinum L) and Lentil (Lens culinaris Medik)
Figure 2: Location Map of the Meki Catchment with in the Ziway-Shalla basin in the main Ethiopian Rift (MER)
Fig. 2. Location Map of the Meki Catchment with in the Ziway-Shalla basin in the main Ethiopian Rift (MER).
are major pulse crops cultivated in the area. Onion, tomato, cabbage, chili pepper, carrot, and fruits are also widely culti-vated.
The study area has soils closely related to the parent ma-terial and the degree of weathering (Makin et al., 1976). Basalt, ignimbrite, acidic lava, volcanic ash and pumice, and riverine and lacustrine alluvium are the main parent mate-rials (Di Paola, 1972). Generally, soil types in the area could be grouped into three. The first group is a well-drained deep reddish brown to red friable clays to clay loams with strong structure. The second group of soil is a well-drained, moderately deep-to-deep dark gray or brown, fri-able silty loam to sandy loam soils with moderate structure and good moisture storing properties. The third group of soil is dark grayish, free draining friable silty loam to sandy loam with moderate structure and good moisture storing properties (Fig. 3). The soil data for this study was extracted from the Soil and Terrain Database for northeastern Africa CD-ROM (FAO, 1998).
Climate of the study area consists of three ecological zones: humid to dry humid, dry sub-humid or semi arid and semiarid or arid lands (Makin et al., 1976). Temperature and rainfall in the area show strong variations with altitude. Mean annual temperature ranges from about 15◦C in the highlands to around 20◦C in the rift (Fig. 4). The average annual rain-fall also varies spatially and ranges from around 650 mm in the rift floor to more than 1200 mm in the highlands.
The Indian and Atlantic Oceans are the sources of mois-ture for almost all rains in Ethiopia (Degefu, 1987). Three main seasons characterize the study area: the first one is the long rainy season in summer, which lasts from June to
Figure 3: a) Drainage network, b) Soil map, c) Topographic elevation m.a.s.l and d) Generalized land use map of Meki River CatchmentFig. 3. (a) Drainage network, (b) Soil map, (c) Topographic
ele-vation m a.s.l. and (d) Generalized land use map of Meki River Catchment.
September and locally known as “kiremt”. The “kiremt” season is primarily controlled by the seasonal migration of the Inter Tropical Convergence Zone (ITCZ), which lies to the north of Ethiopia at that time. According to Degefu (1987), the “kiremt” rain represents 50–70% of the average yearly total. The second is the dry period, which extends be-tween October and February and locally known as “bega”. In “bega” the ITCZ lies to the south of Ethiopia when the north-easterly trade winds traversing Arabia dominates the region. Degefu (1987) indicated that occasional rains during this pe-riod bring 10–20% of the yearly average. The “bega” season is known as the main harvest season in the area. The third season, which is locally known as “belg” is of a “small rain” season accounting for 20–30% of the annual amount, and stays from March to May. Figure 4 shows mean monthly rainfall distribution for stations in the Meki catchment.
4 Model application to Meki River Basin
4.1 Model data preparation
In this study PRMS was calibrated and verified using the daily-mode flow simulation. Measured daily runoff data from the Meki town gauging station was obtained from the Ministry of Water Resources and used in this study directly with no adjustments. Missing values were replaced by −9.99
0 50 100 150 200 Janu ary Febr uary March April May June July Augu st Sept embe r Octo ber Nove mbe r Dece mbe r Month M ea n R ai n fa ll (m m ) Butajira Ziw ay Meki Koshe Torra
Figure 4: Mean Monthly rainfall at some stations in the Meki Catchment
Fig. 4. Mean Monthly rainfall at some stations in the Meki Catchment.
in the model and these periods were avoided from model cal-ibration and validation.
Measured climate data including daily rainfall and maxi-mum and minimaxi-mum air temperatures were obtained from the National Meteorological Services Agency (NMSA). Since solar radiation data was not available for any of the stations in the study area, daily solar radiation data measured at Addis Ababa (about 160 Km North of the study area and found at mean elevation of about 2500 m) was used. After estimating correlation coefficients between adjacent stations and load-ing factors, statistical regression method was used to fill in missing climatic data values, which represent less than 5% of the total data. All the available climatic and hydrolog-ical data cover a period of 25 years from January 1980 to December 2005.
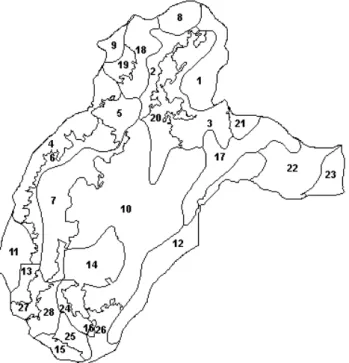
4.2 Delineating Hydrological Response Units (HRUs)
The distributed parameter capabilities of PRMS are enabled by partitioning a watershed into sub-areas that are assumed to be homogeneous in their hydrological responses, termed hy-drological response units (HRUs). There is no hard and fast rule on how to delineate hydrological response units (Leaves-ley et al., 1983). The crucial assumption for each HRU is that the variation of the hydrological process dynamics within the HRU must be small compared with the dynamics in a different HRU. Heterogeneity within an individual HRU is accounted for by computing spatially weighted averages for each characteristic (Fl¨ugel, 1995).
In this study partitioning was made based on basin charac-teristics such as soil, vegetation, elevation, slope, aspect and mean annual rainfall distribution using ESRI’s ArcGIS®. Topographic maps at a scale of 1:50 000 were digitized to generate Digital Elevation Model, slope, and aspect maps needed to delineate the HRUs. Existing digital soil map (FAO, 1998) and satellite image derived land use/ land cover map were integrated in a GIS.
Daily precipitation data recorded at five meteorological stations (four in the catchment and one nearby station were interpolated using kriging technique to obtain mean monthly and annual spatial distribution maps of the precipitation in
Figure 5: Delineated HRUs and their respective numbers.
Fig. 5. Delineated HRUs and their respective numbers.
the basin. These layers were brought together and spatial overlay analysis was used to delineate the HRUs. After sim-plification of the resulting polygons obtained from the over-lay process, 28 HRUs were delineated for the basin (Fig. 5).
In this study, initial estimates of parameter and coeffi-cient values for the basin were taken largely from a previous PRMS modeling study (Legesse et al., 2003) on Ketar River basin, an adjacent basin, with similar hydrological context, except for the physical parameters. Physical parameter val-ues were computed for the watershed using GIS analysis.
Soil texture and available water holding capacity are the two soil characteristics that are used to define model parame-ters in the PRMS. Soil texture classes and depth were derived from the FAO Soil and Terrain database. The other impor-tant soil parameter is the available water holding capacity of the soil profile in the study area, which depends on both soil texture and the rooting depth of the predominant vegetation. Unfortunately, very little is known about the rooting depths of plants in the region. For this study, values estimated by Leopold et al. (1989) based on relationships linking vegeta-tion class, soil texture, rooting depth and moisture capacity of soil were adopted.
The depth of the upper soil layer is user-defined and was assumed to consist of the top half of the maximum root zone since this is the area in which more than half the root density is found (Evans and Sneed, 1996). PRMS has predefined land cover types and hence original land cover classes were assigned one of the four vegetation types defined in PRMS (bare soil, grass land, shrubs or trees). Vegetation cover den-sity (percentage of green vegetation on a patch of land, HRU
in this case) was estimated using normalized difference veg-etation index (NDVI) from Landsat ETM+ satellite images.
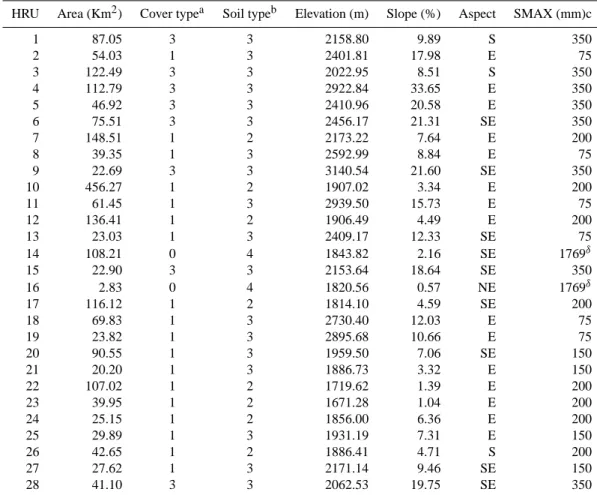
Although the geology of the Meki River watershed is non-uniform, one subsurface and one groundwater reservoirs were used to describe the unsaturated subsurface and the groundwater systems. In other words, excess soil-zone water from each of the 28 HRUs in the Meki River watershed is routed into the same subsurface and groundwater reservoirs. Values representing the physical characteristics of the HRUs are summarized in Table 1.
4.2.1 Model calibration, validation and results
The availability of concurrent runoff and climate data primar-ily dictated the selection of the time periods used for model calibration and validation. A period of one year (1980–1981) was used for model initialization. The purpose of model ini-tialization is to estimate initial conditions in the basin at the beginning of a simulation period. The model calibration and validation periods in this study were divided in to three. The calibration period was a five years period (1981–1986). The validation period was divided in to two: validation 1 (1986– 1991) and validation 2 (1996–2002). This was due to missing discharge records between the two validation periods.
The model was first run in a daily runoff-prediction mode with parameter values that were largely adopted from an ear-lier similar work in the adjacent Ketar River catchment by Legesse et al. (2003). After selection of initial parameter values, a daily sensitivity analysis was run to identify pa-rameters that had the most effect on predicting daily runoff during the calibration period.
Results of the sensitivity analysis indicated that the basin response is more sensitive to the rainfall correction tor (RAIN ADJ), a monthly temperature adjustment fac-tor for calculation of PET (jh coef), soil moisture re-lated parameter SOIL MOIST MAX and subsurface flow related parameter SSRCOEF LIN and surface runoff re-lated parameter CAREA MAX. The model results were also fairly sensitive to two other parameters related to sur-face runoff (SMIDX EXP) and (SMIDX COEF). These pa-rameters were selected for the calibration process. After preliminary model results were examined, the purpose of model calibration was to estimate realistic model parameter and coefficient values for the study area so that the PRMS model closely simulates the hydrological processes of the watershed.
A trial and error adjustment of the selected parameters was performed in an attempt to adjust volume and timing and the flow components of the simulated runoff hydrograph. Se-lected parameter values were adjusted upward and downward manually between each model run for the calibration pe-riod (1981–1986). Finally, an automatic calibration method provided by MMS, the Rosenbrock optimization technique (Leavesley et al., 1983, 1996), was applied to better improve the model performance.
Table 1. Some physical characteristics of HRUs delineated for Meki Catchment.
HRU Area (Km2) Cover typea Soil typeb Elevation (m) Slope (%) Aspect SMAX (mm)c
1 87.05 3 3 2158.80 9.89 S 350 2 54.03 1 3 2401.81 17.98 E 75 3 122.49 3 3 2022.95 8.51 S 350 4 112.79 3 3 2922.84 33.65 E 350 5 46.92 3 3 2410.96 20.58 E 350 6 75.51 3 3 2456.17 21.31 SE 350 7 148.51 1 2 2173.22 7.64 E 200 8 39.35 1 3 2592.99 8.84 E 75 9 22.69 3 3 3140.54 21.60 SE 350 10 456.27 1 2 1907.02 3.34 E 200 11 61.45 1 3 2939.50 15.73 E 75 12 136.41 1 2 1906.49 4.49 E 200 13 23.03 1 3 2409.17 12.33 SE 75 14 108.21 0 4 1843.82 2.16 SE 1769δ 15 22.90 3 3 2153.64 18.64 SE 350 16 2.83 0 4 1820.56 0.57 NE 1769δ 17 116.12 1 2 1814.10 4.59 SE 200 18 69.83 1 3 2730.40 12.03 E 75 19 23.82 1 3 2895.68 10.66 E 75 20 90.55 1 3 1959.50 7.06 SE 150 21 20.20 1 3 1886.73 3.32 E 150 22 107.02 1 2 1719.62 1.39 E 200 23 39.95 1 2 1671.28 1.04 E 200 24 25.15 1 2 1856.00 6.36 E 200 25 29.89 1 3 1931.19 7.31 E 150 26 42.65 1 2 1886.41 4.71 S 200 27 27.62 1 3 2171.14 9.46 SE 150 28 41.10 3 3 2062.53 19.75 SE 350
a 0 = Bare or Water Body, 1 = Grass (includes cultivated lands), 2 = Shrub, 3 = Trees (includes mature forests and woodlands); b 1 = Sand, 2 = Loam, 3 = Clay, 4 = Water; c Maximum available water holding capacity of the soil profile in mm; d (Ayenew, 1998).
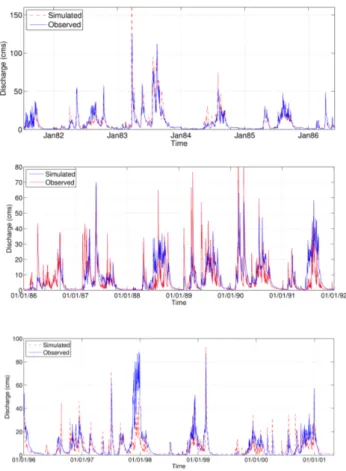
Simulation results from the modified PRMS model were examined both graphically and statistically (Figs. 6, 7, Ta-ble 2). We used the coefficient of determination r2, de-fined as the squared value of the coefficient of correla-tion according to Bravais- Pearson, Nash-Sutcliffe efficiency E (Nash and Sutcliffe,1970), and Index of agreement d (Willmott, 1981). Each of these methods of efficiency cri-teria has its merits and demerits as is well explained in Krause et al. (2005).
The mean volume of the simulated runoff is generally greater than the observed runoff values for most of the simu-lation periods. The model performed well in simulating dry season flows (base flow) for both validation and calibration periods. It also produced reasonably good results in simu-lating peak discharge values. However, some of the more complex hydrographs are not well-captured. This could be attributed eithre to discharge measurement errors or inade-quate model conceptualization for some of the more complex flow regimes. The coefficients of efficiency were 0.71 for the calibration period and 0.69 and 0.66 for validation periods 1 and 2, respectively.
Overall, it can be concluded that the PRMS model sim-ulated the timing and volume of streamflow for the water-shed reasonably well. The three components of the hydro-graph are well represented (Fig. 7). A Nash-Sutcliffe effi-ciency (E) of 0.71 and an index of agreement (d) of 0.9 are obtained between the observed and simulated runoff values for the calibration period indicating a very good fit between the two. Moreover, the very close mean and standard devia-tion values between the two indicates that the model has well simulated the overall flow both during peaks and low flows. Though relatively small, the Nash-Sutcliffe simulation effi-ciency values fulfilled the requirements suggested by Santhi et al. (2001) for ENS>0.5.
One of the main objectives of the calibration was to have a realistic flow component of the simulated flow hydrograph. The simulated hydrographs for the calibration period were composed mostly of subsurface flow (43.4%) followed by groundwater flow (32.1%) and finally surface runoff (24.5%; Fig. 7). A simple base flow separation done on the Meki River discharge has also shown a similar trend for the base flow (Dribssa, 2006). The relative proportion of the surface
Figure 6: Daily observed and simulated discharge of Meki river for the a) Calibration period, b)
validation period 1 and c) Validation Period 2Fig. 6. Daily observed and simulated discharge of Meki river for
the (a) Calibration period, (b) validation period 1 and (c) Validation period 2
Figure 7: The three flow components of the daily simulated discharge at the outlet of the Meki River
Fig. 7. The three flow components of the daily simulated discharge at the outlet of the Meki River.
runoff is smaller due to the fact that there is a vast wetland in the middle part of the catchment that may act as a retention basin favoring more subsurface flow.
The fit between observed and simulated runoff is even bet-ter at a monthly time step indicating that it has well captured the seasonality (Fig. 8). Results of mean monthly runoff sim-ulations seemed to correspond better with observed values with R2value of 0.81 for the calibration period. The monthly coefficient of efficiency was calculated to be 0.74 and 0.72 for the first and second validation periods, respectively.
Table 2. Statistical summary of simulation results for the calibra-tion and validacalibra-tion periods. Meki River catchment.
Calibration Validation1 Validation2
Mean Observed 8.2 7.27 6.12 Mean Simulated 9 6.59 6.9 Std. Dev. Observed 12.9 9.68 9.17 Std. Dev. Simulated 14.8 10.07 9.58 R2 0.7 0.53 0.61 Nash-Sutcliffe, E 0.71 0.69 0.66 Index of agreement, d 0.9 0.79 0.88 4.3 Scenario simulations
Water resources are likely to be severely affected by chang-ing climate. This is mainly because of the fact that even a mi-nor long-term change in temperature and precipitation may have significant impacts on the hydrological cycle especially at the basin scale (Loe et al., 2001). Consequently, it is quite essential to identify the level of impact on such resources.
In this study simulations under different scenario condi-tions have been performed in order to analyze the impacts of possible climate and in land cover changes on streamflow. This involves calibrating and validating the hydrological model using present conditions and running the model with parameters and input data corresponding to the proposed sce-nario conditions and comparing the two simulations.
4.3.1 Climatic scenarios
In this study we used the “delta-change” method to perturb observed historical climatology (Prudhomme et al., 2002) in the form of change factors that are applied to each day. Such scenarios do not necessarily present a realistic set of changes (Fowler et al., 2007). They are usually adopted for exploring system sensitivity prior to the application of more credible, model-based scenarios (Mearns et al., 2001). In this study a 20% change in precipitation (during summer and spring rainy seasons as well as dry season) and a 1.5◦C increase in temperature were considered. Although arbitrary, this kind of increase in rainfall is not unrealistic as it has already been proposed to explain the formation of the once joined large lake of the Ethiopian Rift Valley (Street, 1979) and which now has shrunk to from the current lakes.
Results of the simulated scenarios revealed that the runoff volume is sensitive to both temperature and rainfall changes. The runoff was found to be more sensitive to increase in rainfall than to its decrease. It also showed that increase in temperature also reduces the runoff significantly. Sim-ulated runoff values for all scenarios were compared with simulated runoff values for the first validation period (1986– 1991). An increase in temperature by 1.5◦C resulted in 13% decrease in simulated runoff and an increase of potential evapotranspiration by 6.02%. An increase in daily rainfall
Figure 8: Mean monthly simulated and observed discharge at the outlet of Meki River for a) the calibration period, b) Validation period 1 and c) Validation period 2
Figure 8: Mean monthly simulated and observed discharge at the outlet of Meki River for a) the calibration period, b) Validation period 1 and c) Validation period 2
Figure 8: Mean monthly simulated and observed discharge at the outlet of Meki River for a) the calibration period, b) Validation period 1 and c) Validation period 2
Fig. 8. Mean monthly simulated and observed discharge at the out-let of Meki River for (a) the calibration period, (b) Validation pe-riod 1 and (c) Validation pepe-riod 2
over the entire year by 20% resulted in 80% increase in sim-ulated runoff while a decrease in rainfall by the same mag-nitude led to 61.9% decrease in simulated runoff. For the summer season (June to September), an increase in rainfall by 20% brought about 50% increase in simulated runoff and a decrease in rainfall by similar magnitude caused a decrease in simulated runoff by 38%. For the spring season (March to May), an increase in runoff by 27% resulted from an in-crease in rainfall by 20% and the simulated runoff dein-creased by 20.6 % for a decrease by the same amount. The results of the rainfall and temperature scenario analysis are shown in Figs. 9 and 10, respectively.
The very high rainfall elasticity of streamflow observed for the 20% increase in daily rainfall throughout the year may in part be attributed to errors in calibration or model structure as discussed by Sankarasubramanian et al. (2001). However, the strong similarity of these results with those from the
adja-Figure 9: Simulated discharge for validation period 1 and selected rainfall scenarios
Fig. 9. Simulated discharge for validation period 1 and selected rainfall scenarios.
Figure 10: Simulated discharge for validation period 1 and temperature scenario
Fig. 10. Simulated discharge for validation period 1 and tempera-ture scenario.
cent Ketar catchment (Legesse et al., 2003) may suggest that the approach is reproducible at least in a similar hydrological context but with appropriate model formulation.
4.3.2 Land cover scenario
Land use/land cover changes occur in the country as a whole and in the Ziway-Shala basin in particular (Woldu and Tadesse, 1990) due to increasing population, which has al-most doubled in the country over the past 40 years (CSA, 1999). It is thus essential to analyze the possible impacts of these changes on streamflow at different scales. In this study, one scenario of land cover change was assumed to assess the impact of this change on the runoff.
Parameters that were adjusted with respect to changes in the vegetation cover included maximum soil water holding capacity (SMAX), and maximum interception storage. The change in runoff resulting from the change in land cover is determined by comparing the simulated flows using the cal-ibrated parameters with that obtained with parameters esti-mated for the assumed land cover change.
Assuming that the currently intensively cultivated land be-tween 2000 and 3000 m a.s.l. was once covered by dense woodland and by introducing the corresponding parameters to this change, the model produced an increase in daily evap-otranspiration of 2.2% and a decrease in the mean daily river flow of about 11.8% with respect to the actually sim-ulated value. This decrease could be attributed to the in-creased water retention capacity by the more vegetated areas there by reducing quickflow. However, the impacts of land
cover change on streamflow is a rather contentious one as is well illustrated by some previous works (Seibert and Jef-fery, 2008; Andreassian, 2004; Hewlett, 1982). This kind of change detection modeling could give a better result if used with a model that treats vegetation in a dynamic way. Here, the changes made are static and assume a one-time change. However, it still is considered as a better way of evaluating these impacts (Seibert and Jeffery, 2010).
5 Concluding remarks
In this study a modified precipitation modeling system (PRMS) was developed to assess the impacts of climate and land cover changes on the runoff of Meki River basin using the Modular Modeling System (MMS). Initial parameter es-timates were taken mainly from literature during preliminary model run, which were later modified through calibration. Both manual and automatic calibration techniques were used in this study on selected model parameters.
According to the analysis of the flow components of the simulated hydrograph, majority of the streamflow comes from subsurface flow, which was estimated to be 42% on av-erage for the entire simulation period. The contribution of the groundwater flow to streamflow was also significant, 39% on average. The contribution of surface runoff to streamflow was found to be the least which was estimated to be about 19% on average for the entire simulation period.
An arbitrary 20% change in rainfall and 1.5◦C increase in temperature were considered using the ’delta-change’ method. Rainfall change scenarios were introduced both on the entire year and on seasonal basis. This was to assess the sensitivity of the catchment runoff to both seasonal and year-round rainfall changes. This kind of analysis is particularly important for the region as it has a bi-modal rainfall distribu-tion. Much of the agricultural activity in the region is rain-fed and often suffers from seasonal as well as annual rainfall variability. Results of the scenario analyses showed that the Meki River runoff is differently sensitive to temperature and rainfall changes. The catchment was found to be more elastic to rainfall increase than to temperature. The rainfall elasticity is 4:1 for 20% increase in Rainfall and 3:1 for 20% reduction in Rainfall.
Scenario analyses were performed considering one vari-able at a time and keeping other values unchanged and hence the combined effects resulting from a proposed scenarios are not addressed in this study. One of the main reasons for not considering combined scenario analyses is the fact that this kind of models do not consider vegetation dynamics in a re-alistic way. One way of addressing such impacts could be by using a coupled dynamic vegetation – water-balance models. Most physically based models cannot fully account for the complexity and heterogeneity of processes occurring in the watershed (Yeung, 2005). The accuracy of the model cali-bration is dependent on the accuracy of the input data. Errors
associated with the assumed distribution of rainfall over the watershed affect model results. For example, overestima-tion of streamflow in the model in general may have resulted from overestimation of rainfall in the watershed or the poor performance of the model in basin with large wetland areas. Rainfall distribution in the study area was calculated by us-ing stations on highlands outside the catchment due to the insufficient distribution of rainfall stations in the basin. The available rainfall stations are not well distributed but rather limited to lower altitude areas.
Meanwhile, this study should be extended by consider-ing more scenarios of changes in land use and land cover, soil conditions and other climate variables in addition to the changes in precipitation and temperature. Continuing stud-ies; however, should consider the wide range of uncertainties associated with models and try to reduce these uncertainties by the use of different GCM outputs, and appropriate down-scaling techniques. Application of a number of GCMs can help to generate a more “reliable” ensemble mean through spatial and temporal downscaling. However, such a compre-hensive work can only be more realistic at a regional scale and can not completely replace the approach adopted in this work.
The studied area is unique and the vital resources within the broader Rift Valley Lakes System provide invaluable ben-efits with regard to agriculture, recreation, drinking water needs, industrial development, fish and wildlife habitat, and biodiversity (Ayenew and Legesse, 2007). It is also one of the most densely populated areas of the country. Lake Ziway, which is directly fed by the flows from the Meki River catch-ment, is highly susceptible to any natural and/or man-made activities within the catchment. It is therefore essential that appropriate watershed management policies be put in place in order to promote a more sustainable environment. This kind of study may contribute to this endeavors through the application of different development scenarios.
Acknowledgements. We would like to express our sincere gratitude
to the MAWARI project (French Ministry of Foreign Affairs: 2003-45) for its generous financial support, ESCARSEL(French National Research Agency ANR-VMC-06-VULN-010), for financ-ing DL to spend several short stays at CEREGE and Department of Earth Sciences (AAU) for logistics and other supports. Our thanks also go to the Ethiopian Meteorological Services Agency and the Ministry of Water Resources for providing us with daily meteorological and river discharge data free of charge. We would also like to extend our sincere gratitude George Leavesley and S. L. Markstrom of the USGS for their devotion in providing assistance on their freely available model.
References
Abiye, T. A., Legesse, D., and Abate, H.: The impact of cli-mate change on groundwater recharge: a case study from the Ethiopian Rift. Groundwater and Climate in Africa, Proceedings of the Kampala Conference, June 2008, Kampala, Uganda, 174 IAHS Publ. 334, 2009.
Albek, M., ¨Ulker Bakır ¨Oˇg¨utveren, U. B., and Albek, E.: Hydrolog-ical modeling of Seydi Suyu watershed (Turkey) with HSPF, J. Hydrol., 285, 260–27, doi:10.1016/j.jhydrol.2003.09.002, 2004. Andr´eassian, V. : Waters and forests: from historical controversy to
scientific debate, J. Hydrol., 291(1–2), 1–27, 2004.
Ayenew, T.: The hydrogeological system of the lake district basin, Central Main Ethiopian Rift, Published PhD thesis, Free Univer-sity of Amsterdam, The Netherlands, p. 259, 1998.
Ayenew, T. and Legesse, D.: The changing face of the Ethiopian rift lakes and their environs: call of the time, Lakes & Reservoirs: Research and Management, 12, 149–165, 2007.
Beven, K: Topmodel: a critique, Hydrol. Process., 11, 1069–1085, 1996.
CSA: Statistical Abstract, Ethiopian Central Statistical Authority, Addis Ababa, Ethiopia, 1999.
Chernet, T.: Hydrogeology of the lakes region, Ethiopia (lakes Zi-way, Langano, Abiyata, Shalla, Awassa), Memoir no. 7, The Provisional Military Government of Socialist Ethiopia, Ministry of Mines and Energy, Ethiopian Institute of Geological Surveys, Addis Ababa, 1982.
Choia, W. and Dealb, M. B.: Assessing hydrological impact of po-tential land use change through hydrological and land use change modeling for the Kishwaukee River basin (USA), J. Environ. Manage., 88, 1119–1130, 2008.
Di Paola, G. M.: The Ethiopian Rift Valley (between 70000 and 80400lat. North), B. Volcanol., 36, 1–44, 1972.
Dribssa, A.: Groundwater-surface water interaction and analysis of recent changes in hydrologic environment of lake ziway catch-ment, Unpub. Msc thesis, Addis Ababa University, Addis Ababa, Ethiopia, 95 pp., 2006.
Evans R. and Sneed R.E: Soil, water and crop characteristics im-portant to irrigation scheduling, North Carolina Cooperative Ex-tension Services, Publication number AG 452-1, USA, 1996. FAO: Allen, R. G., Pereira, L. S., Raes, D., and Smith, M.: Crop
evapotranspiration – Guidelines for computing crop water re-quirements – FAO Irrigation and drainage paper 56, FAO – Food and Agriculture Organization of the United Nations, Rome, 1998.
Fl¨ugel, W.-A.: Delineating hydrological response units by geo-graphical information system analyses for regional hydrologi-cal modelling using PRMS/MMS in the drainage basin of the River Br¨ol, Germany, in: Scale Issues in Hydrological Mod-elling, edited by: Kalma, J. D. and Sivapalan, M., Wiley, New York, 181–194, 1995.
Goswami, M. and O’Connor, K. M.: A “monster” that made the SMAR conceptual model “right for the wrong reasons”, Hydrol. Sci. J., 55(6), 913–927, 2010.
Hewlett, J. D.: Forests and floods in the light of recent investigation. In: Hydrological Processes of Forested Areas, 543–559, National Research Council of Canada Publ., 20548, Ottawa, 1982. IPCC: Climate Change 2001, in: The Scientific Basis. Contribution
of Working Group I to the Third Assessment Report of the Inter-governmental Panel on Climate Change, edited by: Houghton,
J. T., Ding, Y., Griggs, D. J., Noguer, M., van der Linden, P. J., Dai, X., Maskell, K., and Johnson, C. A., Cambridge University Press, Cambridge, UK and New York, NY, USA, 881 pp., 2001. Fowler, H. J., Blenkinsopa, S., and Tebaldi, C.: Review Linking climate change modelling to impacts studies: recent advances in downscaling techniques for hydrological modelling, Int. J. Cli-matol., 27, 1547–1578, 2007.
Hailemariam, K.: Impact of Climate Change on the Water Re-sources of Awash River Basin, Ethiopia, Climate Res., 12, 91– 96, 1999.
Krause, P., Boyle, D. P., and Base: Comparison of different effi-ciency criteria for hydrological model assessment , Advances in Geosciences, 5, 89–97, 2005.
Kunstmann, H. and Stadler, C.: High resolution distributed atmospheric-hydrological modelling for Alpine catchments, J. Hydrol., 314, 105–124, doi:10.1016/j.jhydrol.2005.03.033, 2006.
Lazzarottoa, P., Stammc, C., Prasuhnb, V., and Fluhlera H.: A par-simonious soil-type based rainfall-runoff model simultaneously tested in four small agricultural catchments, J. Hydrol., 321, 21– 38, doi:10.1016/j.jhydrol.2005.07.038, 2006.
Leavesley, G. H.: Modeling the effects of climate change on water resources-a review, Climatic Change, 28, 159–177, 1994. Leavesley, G. H., Litchy, R. W., Troutman, B. M., and Saindon,
L. G.: Precipitation-runoff modeling system: user’s manual. US Geological Survey Water Resources Investigative Report 83-4238, Denver, Colorado, 207 pp., 1983.
Leavesley, G. H., Restrepo, P. J., Markstrom, S. L., Dixon, M., and Stannard, L. G.: The modular modeling system (MMS) – user’s manual: US Geological Survey Open-File Report 96–151, 151 pp., 1996.
Legesse, D., Vallet-Coulomb, D., and Gasse, F.: Hydrological Re-sponse of a Catchment to Climate and Land use Changes in Trop-ical Africa: Case Study South Central Ethiopia, J. Hydrol., 275, 67–85, 2003.
Lenhart, T., Eckhardt, K., Fohrer, N., and Frede, H.-G.: Comparison of two different approaches of sensitivity analysis, Phys. Chem. Earth, 27, 645–654, 2002.
Leopold, B. L. and Dunne, T.: Water in Environmental Planning. Freeman, San Fransisco, 815 pp., 1978.
Maidment, D. R.: Hand book of hydrology, McGraw Hall, New York, 660 pp., 1993.
Mastin, M. C. and Vaccaro J. J.: Watershed models for decision support in the Yakima River basin, Washington, US Geological Survey Open-File Report 02–404, Tacoma, Washington, 2002. Makin, M. J., Kingham, T. J., Waddams, A. E., Birchall, C. J., and
Eavis, B. W.: Prospects for irrigation development around Lake Ziway, Ethiopia, Land Res. Study. Division, Ministry of Over-seas Development, 26, Tolworth, UK, 270 pp., 1976.
Mearns, L. O., Hulme, M., Carter, T. R., Leemans, R., Lal, M., and Whetton, P.: Climate Scenario Development, In: Climate Change 2001: The Scientific Basis. Contribution of Working Group I to the Third Assessment Report of the Intergovernmental Panel on Climate Change, edited by: Houghton, J. T., Ding, Y., Griggs, D. J., Noguer, M., van der Linden, P. J., Dai, X., Maskell, K., and Johnson, C. A., Cambridge University Press, Cambridge, UK and New York, NY, USA, 881 pp., 2001.
Mendoza, M., Bocco, G., and Bravo, B.: Spatial prediction in hy-drology: status and implication in the estimation of hydrological
processes for applied research, Prog. Phys. Geog., 26(3), 319– 338, 2002.
Nash, J. E. and Sutcliffe, J. V.: River flow forecasting through con-ceptual models, Part I – A discussion of principles, J. Hydrol., 10, 282–290, 1970.
Sankarasubramanian, A., Vogel, R. M., and Limbrunner, J. F. : Cli-mate elasticity of streamflow in the United States, Water Resour. Res., 37(6), 1771–1781, 2001.
Santhi, C., Arnold, J. G., Williams, J. R., Dugas, W. A., Srinivasan, R., and Hauck, L. M.: Validation of the SWAT model on a large river basin with point and nonpoint sources, J. Am. Water Resour. As., 37(5), 1169–1188, 2001.
Seibert, J. and McDonnell, J. J.: Land-cover impacts on stream-flow: a change-detection modelling approach that incorporates parameter uncertainty, Hydrol. Sc. J., 55(3), 316–332, 2010. Street, A. F.: Late Quaternary lakes in the Ziway-Shala Basin,
southern Ethiopia, PhD thesis, Cambridge University, Cam-bridge, UK, 457 pp., 1979.
Vallet-Coulomb, C., Legesse, D., Gasse, F., Travi, Y., and Chernet, T.: Lake evaporation estimates in tropical Africa (Lake Ziway, Ethiopia), J. Hydrol., 245(1–4), 1–18, 2001.
Willmott, C. J.: On the validation of models, Physical Geography, 2, 184–194, 1981.
Woldu, Z. and Tadesse, M.: The vegetation in the lakes region of the rift valley of Ethiopia and the possibility of its recoveries, SINET: Ethiopian J. Sci., 13, 97–120, 1990.
Xu, Z. X., Ito, K., Shultz, G. A., and Li, J. Y.: Integrated hydrologi-cal Modeling and GIS in water resource management, J. Comput. Civil Eng., 15(3), 217–224, 2001.
Yeung, C. W.: Rainfall-runoff and water-balance models for man-agement of the Fena Valley Reservoir, Guam, US Geological Survey Scientific Investigations Report 2004–5287, 52 pp., 2005.