Publisher’s version / Version de l'éditeur:
Construction and Building Materials, 19, July, pp. 423-429, 2005-07-01
READ THESE TERMS AND CONDITIONS CAREFULLY BEFORE USING THIS WEBSITE.
https://nrc-publications.canada.ca/eng/copyright
Vous avez des questions? Nous pouvons vous aider. Pour communiquer directement avec un auteur, consultez la première page de la revue dans laquelle son article a été publié afin de trouver ses coordonnées. Si vous n’arrivez pas à les repérer, communiquez avec nous à PublicationsArchive-ArchivesPublications@nrc-cnrc.gc.ca.
Questions? Contact the NRC Publications Archive team at
PublicationsArchive-ArchivesPublications@nrc-cnrc.gc.ca. If you wish to email the authors directly, please see the first page of the publication for their contact information.
Archives des publications du CNRC
This publication could be one of several versions: author’s original, accepted manuscript or the publisher’s version. / La version de cette publication peut être l’une des suivantes : la version prépublication de l’auteur, la version acceptée du manuscrit ou la version de l’éditeur.
For the publisher’s version, please access the DOI link below./ Pour consulter la version de l’éditeur, utilisez le lien DOI ci-dessous.
https://doi.org/10.1016/j.conbuildmat.2004.09.001
Access and use of this website and the material on it are subject to the Terms and Conditions set forth at
Temperature control of hot-poured sealants during the sealing of pavement cracks
Masson, J-F.; Collins, P.; Lowery, M. S.
https://publications-cnrc.canada.ca/fra/droits
L’accès à ce site Web et l’utilisation de son contenu sont assujettis aux conditions présentées dans le site LISEZ CES CONDITIONS ATTENTIVEMENT AVANT D’UTILISER CE SITE WEB.
NRC Publications Record / Notice d'Archives des publications de CNRC:
https://nrc-publications.canada.ca/eng/view/object/?id=5f110415-4094-469d-a112-49ae8e269faf https://publications-cnrc.canada.ca/fra/voir/objet/?id=5f110415-4094-469d-a112-49ae8e269faf
Temperature control of hot-poured sealants during the sealing of pavement cracks
Masson, J-F.; Collins, P.; Lowery, M.
NRCC-46430
A version of this document is published in / Une version de ce document se trouve dans: Construction and Building Materials, v. 19, no. 6, July 2005, pp. 423-429
Doi:10.1016/jconbuildmat.2004.09.001
Temperature control of hot-poured sealants
during the sealing of pavement cracks
†J-F. Masson*, P. Collins, M. Lowery
Institute for Research in Construction, National Research Council of Canada, Ottawa, Ontario, Canada, K1A 0R6, jean-francois.masson@nrc.gc.ca,
tel 1-613-993-2144, fax 1-613-952-8102
†
Paper presented at the 83rd meeting of the USA Transportation Research Board, Washington, D.C. January 11-15, 2004.
Abstract
Bituminous sealants are applied to asphalt concrete roadways to prevent the ingress of water, brine and debris in the road structure. This delays degradation and extends the pavement service life. Sealants are applied hot, yet little is known about temperature control and temperature variations during typical sealant installations and its affect on sealant properties and performance. To address this issue, sealant temperatures were measured at various points in three common kettles during sealant installations. Kettle temperature gauge readings were compared to true sealant temperatures and to recommended application temperatures. The results indicate a mismatch between the suggested and the true installation temperatures due to the lack of kettle gauge calibration, the contractors’ attention to and control of the sealant temperature, and the characteristics of the stirring system. To improve temperature control, it is suggested that installation specifications require a certificate of temperature calibration, that kettles with variable speeds be operated at the fastest and safest practical speed, and that the next generation of kettle be equipped with automated temperature controls.
INTRODUCTION
The service-life of asphalt concrete (AC) pavements can be extended by preventive maintenance (1), and crack sealing in particular (2). The details of the crack sealing operations are well documented (3, 4). After installation, sealants should typically resist adhesive or cohesive failure during 8 to 13 years of service. This is the time between the initial crack sealing, 3 to 5 years after construction (2), and the pavement rehabilitation, 13-15 years after construction (1, 5). Current durability is often 2-7 years (6, 7), which is too short to prevent re-sealing operations.
To achieve the longest possible sealant service life, careful consideration must be given to the selection of both the sealant and the pavement, and to sealant application (3, 4). Here the concern is with sealant application and the heating of the sealant specifically. Temperatures beyond the recommended installation temperatures or long heating times at those temperatures can lead to degradation (8). To minimize degradation, if any, it is advocated that sealants be installed at the lowest recommended application temperature and in the shortest possible time (3). The extent of temperature control during sealant application, the temperature gradients within kettles and the variation of sealant temperature within a working day all remain undocumented, although it is often recognized that the accuracy of kettle gauges can be questionable. In an effort to answer these questions, the temperatures in three different sealant kettles were monitored throughout typical installations.
EXPERIMENTAL Kettles and sealants
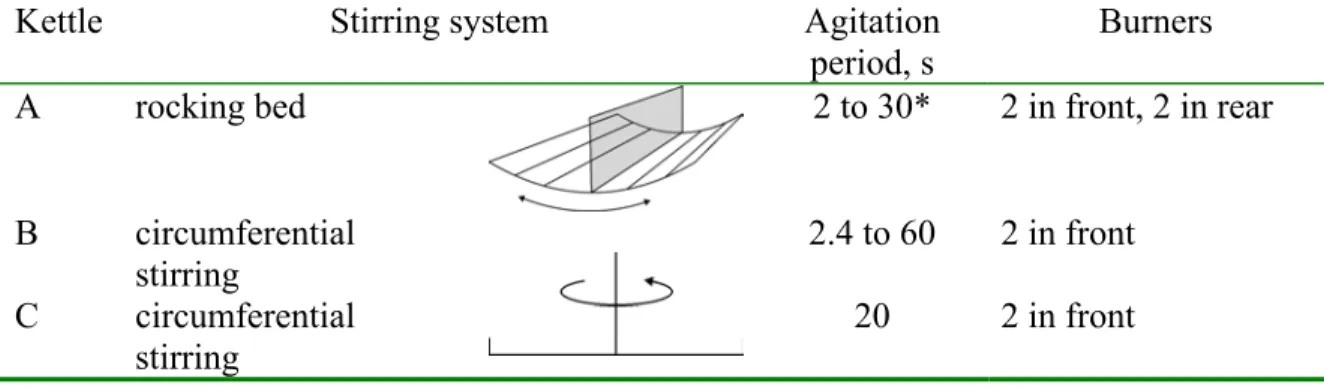
Installations from three kettles (A, B, C) were monitored. The kettles were selected to represent the state of the practice. They had capacities between 350 and 400 gal, and their characteristics are as shown in Table 1. Sealant disks of about 20 kg were melted in kettle A, whereas blocks of 20 kg were melted in the other kettles.
Thermometry
Sealant temperatures in the kettles were monitored by three methods: the kettle gauge (K), an infrared thermometer (IR), and a type-T thermocouple (T3). The kettle gauge is the means by which contractors follow sealant temperatures. The accuracy of this gauge, which provides sealant temperatures near the bottom of the kettle, is about 2°C at 200°C. The IR method, often used by inspectors, uses an infrared beam to measure the temperature at the sealant surface. The accuracy of the IR method depends on the model of the IR scope, but it is typically 2 to 4°C at 200°C. The accuracy of the type-T thermocouple is 1.5°C at 200°C.
The type-T thermocouple was used to measure the sealant temperature at different points in the kettle. Temperatures were measured at the sealant surface, at the bottom of the kettle, at the front and at the rear. For this purpose, the thermocouple was fixed within the end of a hollow 2 m long pole, with the thermocouple wires protruding about 5 mm out of an epoxy plug. The thermocouple wires ran within the pole to a data logger.
Prior to each temperature measurement, the volume of sealant in the kettle was estimated. For convenience, a relative volume of 100% was given to a kettle filled to capacity; a volume of 50% was given to a kettle half-filled, and so on. The presence of fresh
FIELD OBSERVATIONS Kettle A
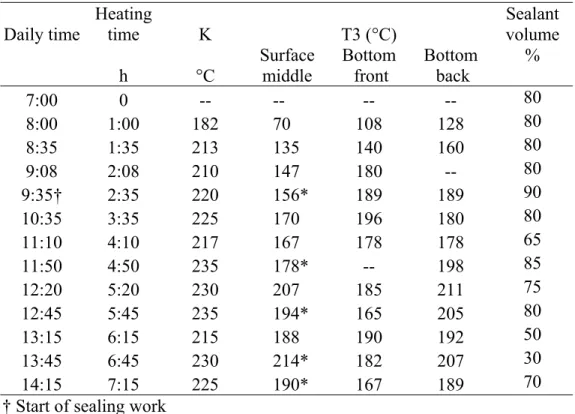
Temperatures measured during the installation with kettle A are shown in Table 2. K and T3 readings were obtained, but no IR thermometry was performed. The suggested sealant installation temperature was 185-200°C. Upon the addition of sealant, the fresh material floated over the hot and liquid sealant until the solid completely melted. An asterisk in Table 2 identifies the presence of unmelted sealant during measurements. Stirring was slow, with a rocking period of about 10s.
Kettle B
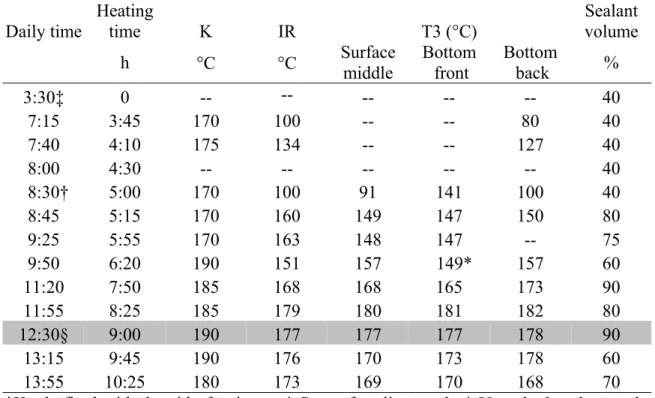
The temperatures measured during the installation with kettle B are shown in Table 3. The grey area highlights the period when agitation and heating of the sealant was maintained but no product was poured out of the kettle. The suggested sealant installation temperature was 190-200°C. Upon addition of fresh material to the kettle, the sealant block sank to the bottom of the kettle. An asterisk in Table 3 identifies temperature readings in proximity of solid sealant. Kettle B was operated at its maximum stirring speed of 25 rpm, a period of 2.4 s.
Kettle C
The temperatures measured during installation using kettle C are shown in Table 4. In contrast to the other kettles, this kettle had a standard dial gauge and a digital readout. Measurements were taken from both readouts. Grey areas highlight periods when agitation and heating of the sealant was maintained but no product was poured out of the kettle. The suggested sealant installation temperature was 190-200°C, and as with kettle B, fresh sealant
blocks sank to the bottom of the kettle. An asterisk in Table 4 identifies temperature readings in proximity of solid sealant. Stirring in kettle C was at 3 rpm, a period of 20s.
DISCUSSION Kettle A
At the beginning of the installation, the kettle dial read 220°C, yet the prescribed sealant installation temperature was 185-200°C. This suggested that the sealant was being overheated. Interestingly, the sealant was not fuming much. The sealant temperature was thus possibly lower than that indicated on the kettle dial. This was confirmed by T3 measurements that showed that the sealant temperature was only 189°C at the bottom of the kettle, near the burners. This temperature was within the suggested temperature application limits. The agreement between the true sealant temperature and the suggested application temperature was likely the result of the contractor’s experience (with a sealant he had reportedly installed many times) rather than a coincidence.
Throughout the day, the kettle dial showed temperatures between 215 and 235°C; temperatures always higher than those measured by T3. The difference between the kettle and the T3 reading at the back of the kettle near the bottom (close to the kettle thermocouple), was on average about 30°C above the true sealant temperature. Clearly, the kettle gauge needed calibration, but the contractor was aware of this need. Had the gauge been calibrated, however, it may not have remained calibrated long. Kettle A was equipped with a bi-metallic gauge, a type of gauge that requires recalibration each time the kettle travels over a hard bump, e.g. railroad crossings [Bob Rousseau. Marathon Road Maintenance Equipment. private communication, 2003].
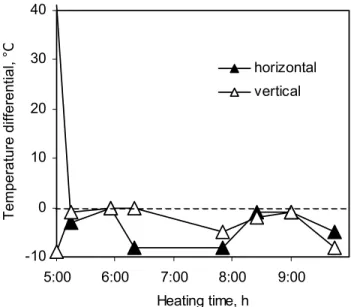
Kettle A had rocking stirrers and burners at the front and the rear (Table 1). The rocking stirrers, combined with the disk shaped sealant, may explain why freshly added sealant floated rather than sank to the bottom of the kettle. The rocking period in Kettle A was variable, but the angle of movement was only about 30° and its period, which was relatively slow, set by the contractor to about 10 s. It was thus of interest to determine the efficiency of these conditions in minimizing temperature gradients in the sealant. Figure 1 shows the horizontal and vertical temperature gradients in kettle A. The vertical differential was calculated from the T3 readings (Table 2). As would be expected, when the sealant was heated prior to the beginning of the crack sealing work, the temperature of the sealant at the bottom of the kettle was higher than that on top, with a vertical gradient of 60°C after 1h of heating. By the time the installation had started, the vertical gradient was reduced to about 30°C and then to zero at the end of the workday. Hence, stirring in kettle A was slow in distributing the heat from the bottom up. This was either because the rocking speed of the stirrers was low, or because of the small amplitude of rocking, or both.
The horizontal temperature gradient in kettle A is also shown in Figure 1. When the installation started, the temperature at the front of the kettle was equal to that at the back. After the addition of fresh sealant (after 5h of heating), the horizontal temperature gradient became quite large and lasted until the end of the day, which demonstrated that the slow rocking bed in kettle A was not the best suited to distribute heat between the front and the back of the kettle. It is doubtful that faster rocking would have reduced the back to front temperature gradient to a significant extent.
Kettle B
At the beginning of sealant installation, the kettle gauge indicated 170°C, well below the suggested installation temperatures of 190-200°C, but it increased to 180-190°C later (Table 3). The contractor, aware of the possible effects of high temperatures on sealant properties (8), confirmed his practice of keeping the temperature as close as possible to the lowest recommended installation temperature. T3 readings indicated, however, that sealant temperature was well below the recommended application temperature. When installation started the sealant temperature at the bottom of the kettle, near the front burners, was only 141°C and elsewhere in the kettle the sealant was closer to 100°C. Not surprisingly the poured sealant was very thick.
The temperature readings from the IR sensor were always lower than those on the K gauge (Table 3). To assess sealant temperatures, contractors usually rely on kettle gauges, whereas inspectors often rely on an IR sensor. Consequently, disagreements on the true sealant temperature may occur, which may jeopardize a good working relationship between a contractor and an inspector. It is not trivial to determine who is right. The temperature differential may arise from insufficient heating, from uncalibrated temperature sensors, or inefficient stirring.
The accuracy of the IR and K dial gauges was assessed by comparing their readings with surface and bottom T3 readings (Figure 2). There was most often less than a 5°C difference between the infrared thermometer and the T3 readings, but a larger difference existed between the T3 and kettle readings. The accuracy of the IR thermometer was thus good, but that of the kettle’s gauge was not as good.
The sealant temperature gradient within kettle B was obtained by a comparison of T3 readings at various points. Figure 3 shows that once the sealant was hot (i.e. after more than 5h of heating) the vertical and horizontal temperature gradients in kettle B were less than 10°C. This indicates that when installation had started the rapid circumferential stirring in kettle B was efficient at maintaining a constant temperature throughout the kettle. This was also shown by the T3 and IR readings obtained at 12h30 on a kettle filled to near capacity (Table 3). After 20 min of continuous stirring without any sealant being added or removed, the temperature gradient was effectively zero.
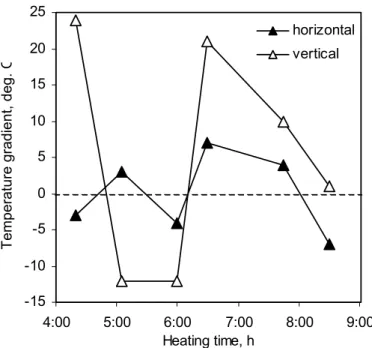
Kettle C
The first measurement on the kettle digital gauge was at 190°C, identical to the IR reading (Table 4). The correspondence between the digital kettle and IR temperatures was maintained throughout the day. The digital readout on kettle C had been calibrated a few months before the work, and the above correspondence suggest that it was done with sealant surface temperatures rather than at the bottom of the kettle where the kettle thermocouple is positioned and where the sealant is hottest.
Interestingly, T3 surface temperatures, taken both in the front and back of the kettle, were significantly different from those obtained by IR or read on the kettle digital gauge. This was initially attributed to a faulty T3 gauge, but another T3 gauge gave the same results. Kettle C was a recent model equipped with both a digital and a dial gauge, and only in late morning was it noticed that the dial gauge reading was 20-30°C lower than that from the digital gauge, which only reinforces the need for gauge calibration, including digital gauges.
After 1h of heating without sealant removal, complete temperature equilibrium within the kettle was expected, but T3 readings at various points in the kettle were different, despite
a low sealant volume (shadowed area in Table 4). This demonstrates that the circumferential stirring in kettle C (3 rpm) was too slow to efficiently redistribute heat. This is also illustrated by a plot of the time dependant vertical and horizontal temperature gradients (Figure 4), which shows that the vertical gradient was larger than the horizontal gradient. In addition to stirring speed, it may also be that the stirring bars in kettle C were thinner or profiled such that the upward movement of sealant was not as great as in kettle B, where little difference between horizontal and vertical gradients existed (Figure 3). As will be discussed later, a statistical analysis of the temperature variation in the various kettles also shows the difference between stirring systems.
Contractors’ perspective
Material and construction specifications call for the heating and pouring of sealants at recommended installation temperatures, e.g. 185-200°C. This temperature provides a compromise between the beneficial effect of temperature on viscosity and the effect of degradation due to heat (8). High temperatures reduce sealant viscosity and enhance flow (8). There is some indication that lower viscosity improves adhesion (9) and that it enhances performance (10). Notwithstanding the possible benefits of high pouring temperatures, high heating temperatures and long heating times can also lead to sealant degradation and stiffening (8), which can lead to premature sealant failure. Consequently, the effect of heating on sealant properties and performance can be large, and (in)consistent heating and application temperatures may be responsible, at least partly, for (in)consistent field performance for a given sealant. Possibly for this reason, contractors are often blamed first when sealants fail.
From the contractors’ perspective installations A, B and C were adequate. Contractor A knew that the kettle gauge was overestimating temperature, so he adjusted the heating to obtain a reasonable pouring consistency, and excessive heating was assessed through the density of fumes emitted by the sealant. This approach, based on experience with a sealant installed many times before, resulted in a true (i.e. T3) mean pouring temperature that was well within the range of suggested application temperatures (Table 5). Contractors B and C reportedly aimed for the lowest suggested application temperatures to minimize possible sealant degradation due to heat. The mean kettle gauge readings for the installations with B and C were 181 and 187 °C, respectively, and it could be argued that these temperatures were reasonably close to the lower suggested application temperature of 190°C and that maintaining sealants at temperature around 180°C really minimized sealant degradation (8).
Public agencies’ perspective
From a transportation or public agencies’ perspective, there is an implicit understanding that pouring sealants anywhere within the temperature range suggested by the sealant formulator ensures adequate performance (provided the sealant meets the material specification), and that installations outside the temperature range are best avoided. From this perspective, installations A, B, and C, although typical, did not represent the state of the art, and may have been unacceptable, as the true pouring temperatures were often outside the range of suggested application temperatures (Table 5).
Three reasons explain the difference between the target and the actual sealant application/heating temperatures: a) the lack of kettle gauge calibration requirements in most construction specifications. An informal survey of seventeen transportation departments
across Canada and the USA revealed that none specified kettle gauge calibration; b) the contractors’ control over the sealant temperature; and c) the efficiency of the stirring systems in the kettle. Point a) is readily observed by the difference between the kettle and true pouring temperatures in Table 5. Point b) can be assessed from the standard deviation (SD) on the true pouring temperature. The standard deviation was 12°C for installations A and B, but only 6°C lower during installation C. The digital readout used during installation C thus helped the contractor maintain a greater control over the sealant temperature than the dial gauges used during installations A and B. Note, however, that a standard deviation of 6°C still leads to a range of application temperatures of 24°C (M ± 2SD), more than twice the 10°C range suggested by the sealant formulator (for a normal distribution, 95% of the cases fall in the range M ± 2SD, where M is the mean value (11)).
Point c) can be assessed by the difference in the standard deviations on the sealant temperatures calculated from T3 readings throughout the kettles and the pouring temperature obtained at the bottom of the kettle (Table 5). This difference was 3°C, 0°C and 4°C for kettles A, B and C, respectively, which indicates that in kettle B the strong agitation provided for good temperature equilibration throughout the kettle. This is consistent with the temperature equilibrations measured when no sealant was poured from the kettles, as discussed earlier.
Despite the work on sealant temperature, viscosity, adhesion and performance (8-10), the effect of temperature variation during installation and the ensuing performance is not well understood. In this context, the suggested installation temperatures provided by sealant formulators become provisional guidelines on installation temperatures. Table 5 shows,
is many times larger than the sought variation, are inconsistent with the provisional guidelines. There are two ways to ascertain a better agreement between them: i) enlarge the limits of permissible application temperatures when the contractor controls the temperature, e.g. 195±15°C rather 195±5°C, ii) maintain a short range of application temperatures, but control the sealant temperature through an automatic temperature adjustment system. At present, only option i) is viable, but this may change in the future when a firm understanding of the effect of a large change in sealant temperature or viscosity on performance is obtained, or when a new generation of kettles equipped with automatic temperature adjustment systems becomes available. Notwithstanding, it may be stated that a kettle with both a vigorous stirring and an automatic temperature control would provide for the greatest control of sealant temperature during application and likely lead to more consistent sealant performance.
SUMMARY AND RECOMMENDATIONS
In an effort to assess the extent of temperature control and measure temperature variations during typical crack sealing operations, sealant temperatures were measured in three common kettles during installations and compared to suggested installation temperatures. In this study, it was found that:
A. Kettle dial or digital gauges often did not show the true sealant pouring temperature; B. Kettle agitation mechanisms and speed governed temperature gradients in hot
sealants. Rapid circumferential stirring provided for the lowest gradients;
C. A mismatch existed between the suggested and the true installation temperatures due to the contractors’ attention to and control of the sealant temperature, the
characteristics of the stirring system, and the lack of specification requirements for kettle gauge calibration.
D. A digital temperature gauge increased temperature control, which resulted in more consistent application temperatures.
To improve the temperature control and reduce the temperature variation during crack sealing operations, it may be suggested based on this study that:
1. Installation specifications require a recent certificate of temperature calibration for the kettle to be used. Calibration should be done against bottom sealant temperatures and not sealant surface temperatures.
2. Kettles with variable speeds be operated at the fastest and safest practical speed. 3. The next generation of kettles allow for variable stirring speeds, and be equipped with
a digital gauge and an automated temperature control such that a temperature feed-back loop allows for automatic reading and readjustment of heating to a mean temperature set by the contractor.
REFERENCES
[1] Hicks RG, Seeds SB, Peshkin DG. Selecting a preventive maintenance treatment for flexible pavements. Report FHWA-IF-00-027, Foundation for Pavement Preservation, Washington, D.C., 2000.
[2] Chong GJ. Rout and seal cracks in flexible pavements: a cost effective preventive maintenance procedure. Transport Res Rec 1990; 1268:8-16.
[3] Masson JF, Boudreau S, Girard C. Guidelines for sealing and filling cracks in asphalt concrete pavement : A best practice. National Guide to Sustainable Municipal Infrastructure, National Research Council Canada, 2003. http://www.infraguide.gc.ca/ bestmunicipal.html. [4] Smith KL, Romine AR. Materials and procedure for sealing and filling cracks in asphalt-surfaced pavements: Manual of practice. Publication No. FHWA-RD-99-147, Federal Highway Administration, Washington D.C. 1999.
[5] Ponniah JE, Kennepohl GJ. Crack sealing in flexible pavements: A life-cycle cost analysis. Transport Res Rec 1996;1529:86-94.
[6] Masson JF, Collins P, Légaré P. Crack sealant performance in cold urban conditions. Can J Civil Eng 1999; 26:395-401.
[7] Corbett MA, Lauter K. Field evaluation of crack sealing in cold climate. Proceedings of the Canadian Technical Asphalt Association, 2000; 45:192-202.
[8] Masson JF, Lauzier C, Collins P, Lacasse MA. Sealant degradation during crack sealing of pavements. J Mat Civil Eng 1998;10(4):250-255.
[9] Masson JF, Lacasse MA. A review of adhesion mechanisms at the crack sealant/asphalt concrete interface. In : Wolf AT, editor. Durability of Building and Construction Sealants, RILEM PRO 10. Cachan (Fr): RILEM Publications SARL, 2000. p. 259-274.
[10] Svec OJ, Kennepohl G, Ponniah J. Development of testing pavement crack sealing techniques. In: DiBenedetto H, Francken L, editors. Mechanical tests for bituminous materials. Brookfield: A. A. Balkema Pub, 1997. p. 137-144.
[11] Havlicek LL, Crain RD. Practical statistics for the physical sciences. Washington DC: American Chemical Society, 1988. p.131.
Captions
TABLE 1 Kettle characteristics
TABLE 2 Sealant temperatures in kettle A TABLE 3 Sealant temperatures in kettle B TABLE 4 Sealant temperatures in kettle C
TABLE 5 Mean sealant temperatures and standard deviations (SD) during applications†
FIGURE 1 Temperature gradients in kettle A. The pouring of sealant began after 2.5 h of heating (dotted vertical line).
FIGURE 2 Temperature differential between T3, infrared and kettle temperature readings from the start of sealant installation with kettle B.
FIGURE 3 Temperature gradients in kettle B after the beginning of sealant installation. The temperature scale is the same as that in Figure 4.
FIGURE 4 Temperature gradients in kettle C after the beginning of sealant installation.
TABLE 1 Kettle characteristics
Kettle Stirring system Agitation
period, s
Burners A rocking bed 2 to 30* 2 in front, 2 in rear
B circumferential stirring 2.4 to 60 2 in front C circumferential stirring 20 2 in front *estimated range
TABLE 2 Sealant temperatures in kettle A Daily time Heating time K T3 (°C) Sealant volume h °C Surface middle Bottom front Bottom back % 7:00 0 -- -- -- -- 80 8:00 1:00 182 70 108 128 80 8:35 1:35 213 135 140 160 80 9:08 2:08 210 147 180 -- 80 9:35† 2:35 220 156* 189 189 90 10:35 3:35 225 170 196 180 80 11:10 4:10 217 167 178 178 65 11:50 4:50 235 178* -- 198 85 12:20 5:20 230 207 185 211 75 12:45 5:45 235 194* 165 205 80 13:15 6:15 215 188 190 192 50 13:45 6:45 230 214* 182 207 30 14:15 7:15 225 190* 167 189 70 † Start of sealing work
TABLE 3 Sealant temperatures in kettle B Daily time Heating time K IR T3 (°C) Sealant volume h °C °C Surface middle Bottom front Bottom back % 3:30‡ 0 -- -- -- -- -- 40 7:15 3:45 170 100 -- -- 80 40 7:40 4:10 175 134 -- -- 127 40 8:00 4:30 -- -- -- -- -- 40 8:30† 5:00 170 100 91 141 100 40 8:45 5:15 170 160 149 147 150 80 9:25 5:55 170 163 148 147 -- 75 9:50 6:20 190 151 157 149* 157 60 11:20 7:50 185 168 168 165 173 90 11:55 8:25 185 179 180 181 182 80 12:30§ 9:00 190 177 177 177 178 90 13:15 9:45 190 176 170 173 178 60 13:55 10:25 180 173 169 170 168 70
‡Kettle fired with the aid of a timer. † Start of sealing work. * Unmelted sealant at the bottom § Equilibration period. See text for details.
TABLE 4 Sealant temperatures in kettle C
Daily time
Heating
time K, digital K, dial IR T3 (°C)
Sealant volume h °C °C °C Surface front Surface back Bottom back % 5:00 0 -- -- -- -- -- -- 30 7:30† 2:30 -- -- -- -- -- -- -- 9:20 4:20 190 -- 191 152 155 179* -- 10:05 5:05 194 -- 191 187 184 172* 50 11:00 6:00 174 -- 175 168 172 160* 75 11:30 6:30 183 -- 191 168 161 182 50 11:45§ 6:45 185 163 190 -- -- -- 20 12:15 7:15 192 163 190 -- -- -- -- 12:45 7:45 191 163 185 165 161 171 20 13:30 8:30 183 157 178 171 178 179 --
† Start of sealing work * Unmelted sealant at the bottom. § Equilibration period. See text for details.
TABLE 5 Mean sealant temperatures and standard deviations (SD) during applications†
Kettle
A B C Suggested application temperature, °C 185-200 190-200 190-200 Target gauge reading and SD, °C 192 (3.75) 195 (2.5) 195 (2.5) Kettle gauge, °C 224 (9) 181 (9) 187 (7) Pouring temperature, °C* 194 (12) 169 (12) 177 (6) Sealant temperature, °C** 187 (15) 166(12) 170 (10) † Standard deviations are in parenthesis
* From T3 readings at the back of the kettles near the bottom, i.e. the sealant exit point ** From T3 readings at the top, bottom, back and front of the kettles
-40 -20 0 20 40 60 1:00 2:00 3:00 4:00 5:00 6:00 7:00 8:00 Heating time, h Temperature gradient, °C vertical horizontal
FIGURE 1 Temperature gradients in kettle A as measured with T3. The pouring of sealant began after 2.5 h of heating (dotted vertical line).
-10 0 10 20 30 40 5:00 6:00 7:00 8:00 9:00 Heating time, h Temperature differential, ° C IR-T3(top) K-T3 (bottom)
FIGURE 2 Temperature differential between T3, infrared and kettle temperature readings from the start of sealant installation with kettle B.
-10 0 10 20 30 40 5:00 6:00 7:00 8:00 9:00 Heating time, h Temperature differential, ° C horizontal vertical
FIGURE 3 Temperature gradients from T3 readings in kettle B after the beginning of sealant installation. The temperature scale is the same as that in Figure 2.
-15 -10 -5 0 5 10 15 20 25 4:00 5:00 6:00 7:00 8:00 9:00 Heating time, h
Temperature gradient, deg.
C
horizontal vertical
FIGURE 4 Temperature gradients from T3 readings in kettle C after the beginning of sealant installation.