NUCLEAR MAGNETIC RESONANCE SPECTRA
by 4T. OF TECHN
by
JUL 16
1958
Richard Warren Fessenden ' IR RA
B.S., University of Massachusetts
(1955)
SUBMITTED IN PARTIAL FULFILLMENT OF THE REQUIREMENTS FOR THE
DEGREE OF DOCTOR OF PHILOSOPHY
at the
MASSACHUSETTS INSTITUTE OF TECHNOLOGY June, 1958
Signature
Certified
of Author
by
Department of Chemistry, May 16, 195d
Th silg STpervisor Accepted by
Cha man, Depitmenfalf Committee on Gradua /Students
I
Thesis~ommi~ttee Chairman
SThesis ommittee Chairman
Thesis Supervisor
MCI'
V V-
, o,
THE ANANLYSIS AND INTERPRETATION OF
HIGH RESOLUTION NUCLEAR MAGNETIC RESONANCE SPECTRA by
Richard Warren Fessenden
Submitted to the Department of Chemistry on May 16, 1958
in Partial Fulfillment of the Requirements for the Degree of Doctor of Philosophy
ABSTRACT
The high resolution nuclear magnetic resonance spectra of three ompounds containing three nonequivalent spin 1/2 nuclei (H ) have been observed at several magnetic field
strengths. The compounds studied were styrene, 2,4-dichloro-aniline and 2,5-dichloro2,4-dichloro-aniline. The spectra, which depart considerably from first order behavior, have been analyzed and it was found that the sam.e set of parameters describe the spectra at all the magnetic fields used. Using these compounds, combination lines have been observed for the first time and it was demonstrated that these lines are
not always of small intensity, as had been commonly supposed. It was shown that in styrene the spin-spin coupling constants have the same sign.
Methods were developed which aid greatly in the analysis of spectra of systems of three spins, when these spectra
show the results of intermediate coupling between the nuclei.
A Using these methods it is possible, in favorable cases, to determine the relative signs of the coupling constants without a complete analysis.
Two substituted ethanes, CHCIBrCBrF2 and CHCI CC1F were studied; the spectra were found to exhibit the effects
Sof
internal rotation. The temperature dependences of certain chemical shifts and spin-spin couplings were measured, and an attempt made to interpret them in terms of the simple theory of rotational averaging which has appeared in the literature.Thesis Supervisor: John S. Waugh Title: Assistant Professor of
It is with great pleasure that I acknowledge the guidance of Prof. John S. Waugh during the course of this research. His help in selecting the problem, opportune suggestions regarding both the work in progress and that contemplated, and leadership in many inspiring discussions made the research pleasant,
stimulating and productive.
I am grateful for the many opportunities of discussing the three-spin problem with Dr. Salvatore Castellano, for the many discussions with Dr. Donald M. Graham, and for the latter's pioneering efforts with the thermostat. I would also like to express my appreciation to those who have already left the
laboratory for leaving much experimental "lore", and to those who are still here for helping me to realize the value of perpetuating it. I am grateful,
too, to my wife for her help in preparing the manuscript. I wish to thank both the National Science Foundation, for their fellowship support, and the directors of the Research Laboratory of Electronics, for making the
I. Introduction: Spectra of Three-Spin Systems ... II. Theory of the Case ABC...
III. Experimental ... IV. Results and Discussion... V. Conclusion... VI. Introduction: Internal Rotation VII. Theory of Rotational Averaging. VIII: Theory of the Case ABX...
IX. Experimental... X. Results and Discussion... XI. Conclusion... Appendix A ... Appendix B ... Literature Cited ...
... 7
..11S.33
.. 38
*.59 . .61 .. 62..
69
*
.73
•.79
..
88
..90- .95
.103 ...First Order Spectrum for ABC ... Spectrum of Styrene, 40 Mc... ... ...20 ... 39 1. 2.
3.
4.
5.
6.
7.
8.
9.
10. 11. 12. 13. 14..40
.44
.45.48
.51 .56 .72.76
Two Alternate Calculated Spectra for Styrene Spectrum of Styrene, 22.55 Mc... Spectrum of Styrene, 10 Mc ... Correlation Diagram for Styrene... Spectra of 2,4-Dichloroaniline... Spectra of 2,5-Dichloroaniline ... Spectrum Calculated for ABX = F1F2H... Thermostat for Rotating Sample... Spin-Spin Coupling Constant in CHC12CC1F 2 vs. Temperature... AHF in CHC12CC1F2 vs. FB, EB - EA 0... AHF in CHC12CC1F2 vs. FB, EB - EA( 0... VF2 - V at 40 Mc. in CHClBrCBrF2 vs. Tempei 15. The Two H-F Spin-Spin Couplings in CHClBrCBrF2 vs. Temperature ...... 86
LIST OF TABLES
Matrix Elements of Y
...
First Order Transitions -i j... The Aij as They Appear in a First Order Spectrum. Styrene, 40 Mc... Styrene, 22.55 Mc. and 10 Mc... 2,4-Dichloroaniline, 40 Mc. and 22.55 Mc... 2,5-Dichloroaniline, 40 Mc. and 22.55 Mc... Energy Levels for the Case ABX... .14 .18 .21 .42.46
.53
.57
.70 ... 80 ... ... 82 ... ... 83 rature...85 i. II. III. IV. V. VI. VII. VIII.in the nuclear magnetic resonance spectra of liquid and gaseous samples was proposed by Hahn and Maxwell (17) and
by Gutowsky et al. (16), and has been justified by Ramsey (32, 33) and Ramsey and Purcell (34). There are two
kinds of effects involved: shielding of the nucleus from the external magnetic field by induced electron currents and orientation-independent coupling of pairs of magnetic nuclei by the electrons. The Hamiltonian describing these two effects can be written
(0) 1(/,)
where (0) --_ itiHiizi (1)
and -1
-Z
2AiiHere'r has the usual significance, Ti is the magnetogyric ratio of nucleus i, Hi the magnetic field at nucleus i,
Izi the z component of the spin angular momentum, Aij a coupling constant, and I. and I. the spin angular momenta.
()-i (1)
ýV(O) is dependent upon magnetic field while j ) is not,
because A.. is assumed to be independent of magnetic field, as predicted by Ramsey and Purcell (34). There is good experimental and theoretical justification (32) for assuming Hi to be of the form Ho(1-%i), that is, linear in the external field. The Ai for some selected compounds have been shown to be independent of magnetic field between the values 200--6000 gauss, to within the experimental error of approximately 10/o (31, 16). Over the temperature range studied by Gutowsky et al. (16), no change in the values Aij were detected. The dependence
method of measuring the effects by which Hi ( i) and
A.. are manifest. The work described herein deals with
13
this question only indirectly.
The ability of the Hamiltonian to describe the
positions of lines and their intensities -- the observable features of a magnetic resonance spectrum -- has been
tested in many cases. If
2wAij <<
IYHi-HjI
for all pairs of nuclei, then the interpretation is simple: a first order perturbation treatment is sufficient, and it has always been possible to determine a set of para-meters, the i andAij, which adequately describes the experimental spectra.
Some simple cases where first order theory is not adequate have been investigated. Following the notation used by Bernstein, Pople, and Schneider (7), nuclei i and
j for which .\. Y 1 will be denoted by the first letters 13
of the alphabet A,B,C---; nuclei i, for which .ij<< 1 with all others j, will be called by other letters, such as P, X, or Y. In this notation, three nuclei with only
1-2 1 would be called ABX. Systems AB (17), ABn with
n = 2,3,4 (6), and A2X2 (24) have been treated exactly. Some other systems have been discussed (7, 15, 20, 30), but the results are not easily presented in closed form. One of these systems is ABX, which has been treated by Bernstein, Pople, and Schneider (7) and Gutowsky et al.
(15). This is a special case of the general system of three nuclei which will be treated in detail in section II.
A perturbation treatment has also been presented (2) for
cases in which the N.. are appreciable but still less than unity. Here the perturbation is expanded in terms
satisfactory agreement between theory and experiment, and the parameters a. 1 and A.. have been obtained.
ij
The case of three non-equivalent nuclei, ABC, is more complicated than those previously mentioned, and
it is quite worthwhile to determine for this case whether satisfactory agreement with experiment exists when the values of
>i
approach unity or even exceed it. Here the perturbation treatment may not be valid because there is a possibility that the series in the A's will notconverge. In fact, the three-spin system is the simplest one in which it is possible that neither a series in A nor one in 1/? will converge.
For one to be able to interpret the spectra of three-spin systems conveniently, the spectra cannot depart greatly from those in which a first order theory is appropriate. If this is true, the three hij are significant but not large, and the case does not present a difficult enough test to the theory. It is possible, however, to analyze a spectrum taken at a higher magnetic field (in which some A• 1/2) and then to take a spectrum at a lower magnetic field, where the A's are larger. If the same set of parameters is assumed to hold at the lower field and the spectrum calculated on that basis agrees with experiment, then the theory has been put to a significant test (A r 2) and has withstood that test.
The spectra at several magnetic fields can be used at the same time to verify that the same set of parameters, ai and Aij, describes the spectrum at different magnetic fields. This relates to the dependence of Hi and Aij on magnetic field, but the proper dependence has been shown
Systems containing three or more spins are of particular interest because of some additional properties of their
spectra. As Anderson (2) has mentioned, in this case it is possible to determine the relative signs of the three or more Aij, although the absolute signs can never be
-ij
determined (Appendix A). Several theories (16, 21, 33) indicate that for protons all the coupling constants should be positive; however, one paper has appeared in the literature (1) in which the author claims to have found an instance in which all the proton couplings are not of the same sign. Since it has been possible to find the signs of the A's in very few cases, it is important
to do so in more cases in order to verify or reject theories of their origin.
case of three spin 1/2 nuclei in which one or more ij .
In this case the coupling of nuclei i and j cannot be
treated as a perturbation on -- H (a• - i ) and the problem
must be solved exactly. The Hamiltonian for this case is
h-
1J= - (v1-al1) + V(l-ai,)I
+ v (1-C )Iz12 Z1 13 2 1 3
+
A
12
1
1
*1
2
+ A
13
L
1
i
3
+
A
23
1
2
1
3
1
where v = -•- H, H being the external applied magnetic0 27 o0 o
field and y the magnetogyric ratio for the unshielded
nuclei. ai is the fractional shielding of nucleus i, and Ji Izi, etc., are the spin angular momenta and their components.
z is taken along the direction of the magnetic field. As has been noted above, vo is the frequency of pre-cession of a bare nucleus in the external field. Although the value of v a is important in some theories, experi-mentally only differences between frequencies, such as
vo(1-i)-Vo(l-oj), can be measured easily because there is no good way in nuclear resonance techniques to intro-duce a standard with frequency v0. For this reason it is convenient to modify the Hamiltonian, letting
v (1-
v = V '-v.'
= V '(1-5i)
where vo ' is any convenient reference such that the vi'
are of the same order of magnitude as v (l-oi)-vo(l- 1).
Because v and v ' differ by less than 0.01 %,/o Becus o adv O
V -v . V.-V vL-v ( )
V
i V. V 1
3
11i 0
The values .i-aj will be given in parts per million; however, values of vi-v j will be given in cycles per second when
the value of v is given (40 Mc., for instance). It is apparent that V.Si , V.= 5 = V Ho5 t 1 1 0 1 o0 v 27
Henceforth the prime on vo will be dropped, and it will be understood that vo is some convenient reference, rather than the Larmor frequency for free nuclei. This lengthy discussion of a minor problem in notation is neceQsary
since there is no standard notation used in the literature, and often the meaning of the symbols used is not explicitly given; fortunately, it is usually fairly clear to those working in the field.
The zero order wave functions to be used are simple
product functions of a and D, the two spin states for spin
1/2 nuclei. One such wave function is a(l)ý(2)a(3), by which is meant nuclei 1 and 3 in the a state, and 2 in
the ý state. This will be abbreviated a8a. In the'present case with three nuclei there will be 2 = 8 wave functions. Each of these wave functions is characterized by an
eigen-value of the operator Fz = i I , which represents the
total spin of the system and is a good quantum number. There will be one wave function for each of the values Fz = t 3/2, and three each for the values ± 1/2.
The rules for finding the matrix elements of the Hamil-tonian in this representation are easily derived by consid-ering the effects of the spin operatorsappearing in the Hamiltonian upon the wave functions (13). These rules have been presented in a simple form by Bernstein, Pople,
and Schneider (7), and their notation, modified somewhat, will be used.
With the Hamiltonian in the form
(o) -h vo(1-al)Izi
(1)=
h
i(j
A.I.*I..
their rules give
(o) m = - Ih vi(1-cli) S i
("m
(1) m):= -
h
Zi<jAijTij
(Y
(I1)I(n)
I
hA.UL.
where Si =+ 1 as nucleus i is in the a or $ state
Tij = + as nuclei i and j are parallel or
Tij
antiparallel
Ui. = 1 if m and Kn differ by the interchange of spins i and j only, and is zero otherwise.
With these rules the matrix elements given in Table I can be found. The values actually given are h -H m n and from here on all energies will be in cycles per second. The wave functions are grouped according to the values of the total spin F z. Because FZ is a good quantum number,
MATRIX ELEMENTS OF Function Ba$ Bpa maa apa Baa ' maa F 3 3 -i I 3 3 t V
v 0
V 0
o 0 V o 3 oE V
! oH
2 3 H 2 4 H 314 Hnn-
{(+v
1+v
2 +31')
- (-v 1'+v
2+v
)+1 2
3
(+v '-v '+v ') (+ 1 23
- 1 '+v I -V ) + j(-v 1 2'+ 31)+ t(+v l' -v
2+v
3')
+ (-'+v+L(vl
2
'+v3
')+
-(+v
--1
1'+
v
2'+v
3')
H
67 -A
1 2 H P 57 2• 13 H6 . A23-
#(+A
1 2+A
1 3+A23
)
-
(-A
12+A
13-A
23)
- (+A 12-A13-A23)(-A
12
+
13
A
23
)
-(+AA
+A
-A)
-L(+A +A +A2 )q 12 13 23
All matrix elements are real, so the matrix
is symmetric about the main diagonal. No. 1 2
3
45
6
7
8
6, and 7. Functions 1 and 8 are then eigenfunctions, and the corresponding diagonal matrix elements are the energies for these states.
There will be some discussion later of a "first order" spectrum, and it is helpful to define the term at this
point. The situation considered is one in which / (1) is considered to be a perturbation upon •(o). The first order correction to the energy is just the expectation value of the perturbation; for state m, for instance,
this is just
(
nmli(1) m) . This is equivalent to usingan approximate Hamiltonian in which -h Ai ziIz is substituted for the ýY(1) given above. This approximate Hamiltonian gives the correct diagonal terms but gives
no off-diagonal ones such as are being included here. To solve the problem exactly, two cubic equations will have to be solved to get the energies corresponding to the diagonal elements 2, 3, and 4, and 5, 6, and 7.
Because all the diagonal matrix elements include (1/2)v or (3/2)v in addition to terms in v1j, V2 A1 2,
etc., it is advantageous to subtract the term involving v , which is some 105 times the other terms. The diagonal terms will always have the form (H - E) and the v term
nn o
can be considered to be included in E. For the energies 2--4, let E' = E - -v, and for the energies 5--7, let
E' = E + - v , etc. An energy difference taken to find
a transition frequency will be, for instance,
+
(E
2-
g
)(2
(E
+
j
)
-
(E
5'
-
V)E2' - E5 o
With this convention, E.' will henceforth be called just Ei ,
and it will be understood that the value of v should be included.
The eigenfunctions can be found by standard techniques (10). There is a set of equations
(H2 2 - E2)a 2 2 + H2 3a2 3 + H2 a2 4 = O0
H2 3a2 2 + (H3 3 - E2)a 2 3 + H3 4a2 4 = 0
H24a22 + H3 4a2 3 + (H4 4 - E2)a2 4 = 0
which give the coefficients for the proper wave function corresponding to E2 and there are two more sets for E3
and E 4 . Energy levels E5, E6 , and E7 are treated similarly.
To get a unique set of numbers a2 2, a2 3, and a2 4 the
additional condition of normalization is imposed:
2 2 2
22 + a23 + 24 =1. The eigenfunction for level 2 is then
2 = a22 2 + a2 3 Y3 + a24?4
The intensity of the transition
pi--.j
is proportional towith Ix = ixi
The value for I ji can be found if i and .j are expanded
in terms of the product wave functions .
Si Z kZaik Zk j = ,aj p
( J(Ixl
Yk)
is zero unless V1, and(k
differ in the spinof one nucleus only, in which case it has a constant value for nuclei of the same species (7), experimental conditions remaining constant. This value will be taken as unity.
Up to this point the calculation of a spectrum, given the values v.' and Ai , has been considered. In practice, the inverse is necessary: the determination of the parameters from an experimental spectrum. Because of the cubic equations involved, it is not feasible to do this by explicit solution of the general secular equation. The method of assuming a set of parameters, calculating a spectrum, and adjusting the parameters for the best fit can be used, and in the cases discussed here it is not impractical to do so.
The correspondence between the system with A 1
and that at an imagined high magnetic field where ..
<<((l
13can be used to aid in the initial choice of parameters. Under the latter condition, the off-diagonal terms can
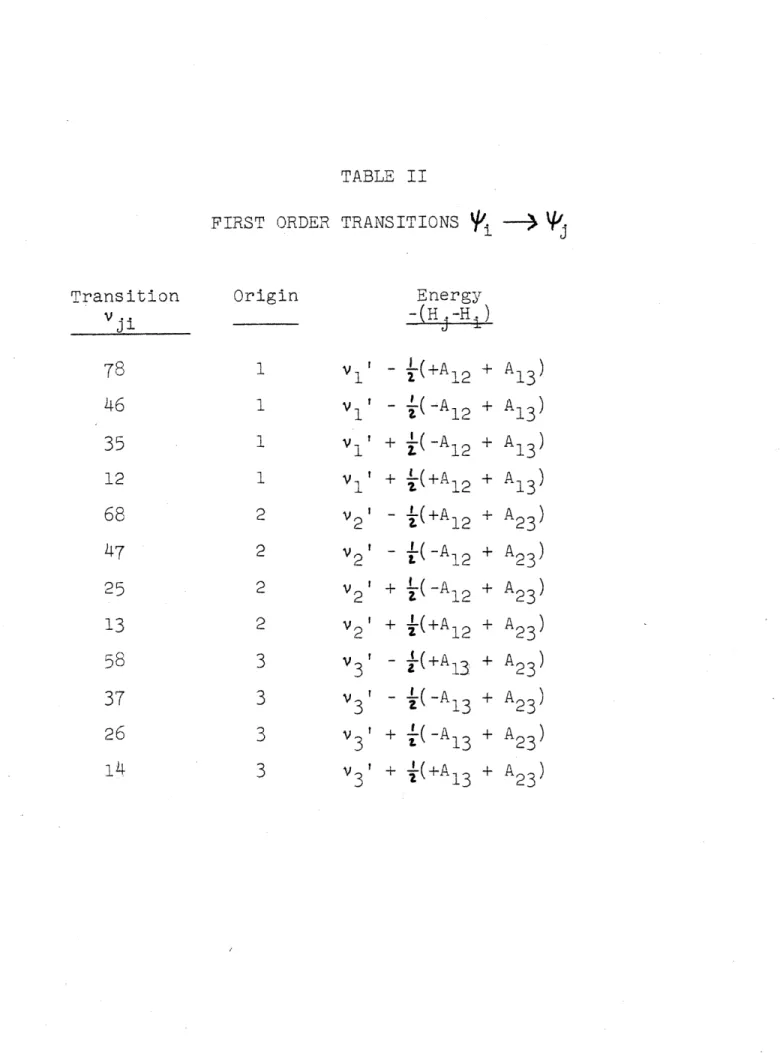
be neglected, and the energies will be just the diagonal elements; the transitions will all have the same intensity. The transitions allowed by the selection rule, AF = -1, and their frequencies are given in Table II.
Experimentally the spectrum is observed by changing the external field Ho. Increasing H is taken toward the
0 0
right so that the nucleus with the largest a (all a>O) will give the signal farthest to the right. This signal would appear at the lowest frequency for a given Ho
The inverse relation can be seen from the Bohr condition which must be satisfied for the transition to occur
v = 2w H (1-)0
2wv 1 27v 2
TABLE II
FIRST ORDER TRANSITIONSi -- (j
Transition vji
78
46
35
1268
47 2513
58 37 26 14 Origin v! v1 v1 v2 v 2 v 2 v 3 v3 v3 ' v 31 3 Energy -(H -H,)-
-
(-A
t(+A
+
A
1
3
)
12
+
13
)
+
t(-A
2
+
A
13
)
+
-(+A
12
+
A
13
)
- •(+A1 2 + A23) - -(-A12 + A23)
+
(-A
12
+
A
2
3
)
+
l(+A
+
A
23
)
-
f(+A1
3
+
A
2
3
)
-
(-A.
i
+
A
23
)
+
j(-A
1
3
+
A
23
)
+ (+AI3 + A2 3)S13
23
for this reason that the negatives of the energy differ-ences are given in Table II. v' and 5 have been chosen to have the same sign, and this sign is such that if the transition occurs at a higher magnetic field than that of the reference (to the right of the reference in a standard spectrum), then v' or 5 will be positive. The correspond-ence of a and 5 is then complete.
The spectrum corresponding to the energy differences in Table II can be represented by plotting -(Ej-Ei),
the frequency of the line, across the page with a vertical line for each transition; the height of the line represents the intensity of the transition. (The zero on the abscissa is understood to be at vo, the reference frequency.) With all AijO and A2 3) A1 3 A1 2, the twelve lines are as
shown in Figure 1. There are three more spectral lines which are forbidden in first order because they are those for transitions such as aa-- ýBý, in which all three spins flip. These transitions are called combination
lines.
The lines can be divided into three groups of four lines, each group corresponding to the transitions of a particular nucleus as influenced by the four possible orientations of the other two. These relations are shown
in Table III. The two values for Ai2 given in Table III are the same because
1 = - H5 - HE - H7
H8 = - H2 - 3 - H
-I
-t
_________A1
4
_ _ N~ N I-~ tO 2 (0 In N co 0 J 1 O O-O
0o
LLu cI- LL-2 2 N t II II II () ZO. Q,THE Ai.. AS THEY APPEAR 13 A12 = 4 6 - V 7 8 v47 - v68 v12 - 351
V1
3
V
25
A13 = V 3 5 - V7 8 ' v37 - V 5 8I
V1 2 - V 4 6 V1 4 - V26 A2 3 = 13 - V 4 71 V14 - V37 V25 - v6 81
V2 6 -v58 = H4 = H = H1 = H3 - H 6 - H2IN A FIRST ORDER SPECTRUM
H7 + H 8 - H3 + H5 - H2 - H4 + H 6
- H5 - H7 + H8
58
HL
H33
- H4 +H7
= H2 - H5 - H6 + Hp Here H1 = H1 1and H4 - Hg - H7 + H8 = - H3 - H6 - H7
therefore H - H2 - H3 + H = H - H - H7 + H8
Similar relations hold for A1 3 and A23. The spacing between the centers of two groups of lines will be the value of v .'-v.
J
i
It is now possible to show that any spectrum of a system of three spin 1/2 nuclei is of the same form as
a first order spectrum as far as line positions are concern-ed; that is, it is possible to find an assignment of lines into three groups of four lines each, which has the same property of repeated spacings, although the spacings are not now just the Aij, but are more complicated functions. Some other properties of the spectrum will also be
investi-gated which will make possible some statements regarding the uniqueness of the assignment. To do these things, the correspondence between the spectrum for all values of ? and a first order spectrum must be demonstrated.
First it is useful to demonstrate that in the calcula-tion of the energies from a set of parameters, each energy can be identified with a particular diagonal element ofN , in the sense that if the diagonal element and the energy are observed as functions of magnetic field, in the limit
of infinite magnetic field the two must approach a common value. In proceeding from parameters to energies, the identification of the energies with the diagonal elements can be considered in each of the 3x3 determinants separately.
One factor of the secular determinant is H 22-E 5H22 5H24
5H23 H33-E H34 = O0
5H2 4 5H34 H44-E
(E-H 2 2 )(E-H 3 3 )(E-H 4) = 5(H232+H242+H34 )E +5 H23H24H34 -52 (H22H 2+H33H24 2+H44H23)2
or
f(E)
=aE
+
b
i+- -V N 771l 1 O r PLUtUU 6LE+b
E
If 5 = O, then aE + b = O, the E axis, and the roots of f(E) = aE + b are just the diagonal values. Now if 5 is changed continuously from 0 to 1, the line aE + b will move until it arrives at the final position shown and
the values of E at the intersection of f(E) and aE + b will be the proper solution for this part of the problem. It is obvious in the construction shown that the largest root E2 corresponds to the largest diagonal value H
2 2.
A similar correspondence holds for the other two values. If the convention (vA' VB < V C') is established,
then at high magnetic fields where the chemical shifts are much larger than the spin-spin couplings, the diagonal
values will be in the order H2 2)H 3 3 H 4 . Now if the
magnetic field is reduced, the values of the Hnn and En
values, for instance H2 2 and H33, can become equal. This
situation is illustrated below by three plots of the cubic equation for successively smaller magnetic fields.
2
_E2
E3
H
33,Ha
E2
H33
In the second diagram it seems meaningless to ask: to which diagonal value does E2 correspond? However, as the magnetic field is changed, the energy levels must
change continuously, therefore, the labeling of the roots is correct as shown in the second and third diagrams. Even though at the field considered above there is a
change from H2 2> H3 3 to H22( H3 3 ' E2 remains larger than
E . The only possibility of a change in the order of the
energies is in the case considered above. Because no change occurred there, the levels must remain in the order
E2 E 3 E4 for all magnetic fields.
2 / _:
At all magnetic fields of interest there can be no crossing of energy levels of differing F because the v.'
z 1
and A.. constitute very small additions to the Zeeman energy vo. There exists, then, a non-crossing rule for the energies, similar to that used in other forms of spectroscopy. Here the variable is magnetic field, and the energies do not cross as it is changed. Presumably some modification of this rule is necessary when two or more nuclei become equivalent.
If, in the sums given in Table III, the diagonal values of 91 are replaced by the corresponding energy values, the four spacings which were equal to some Aij will remain equal to one another, but will no longer equal that Aij. This relation can be proved by using H = El = - E5 - E6 - E7 (and H8 = E8 = -E2 - E3 - E4 )
which is true because the expanded determinant for Fz= -(1/2) given above has the same coefficient of E2 as (E-H
2)(E-H 3)
(E-H4 ). This coefficient is minus the sum of the roots
of the cubic equation in either case; therefore,
H2+H4+H = E2+E 3+E4. This relation is also demonstrated by noting that under the unitary transformation from the
's to the proper wave functions p, the trace of the sub-matrix representing the F = -(1/2) state is preserved.
If the spacings which correspond to the A.. are added, there results one very useful bit of information. Remember-ing that Table iI lists -(H -Hi ),
-(E1-E2-E +E,) - (E1-E
2-E
+E)
-
(E
1
-E
-E
4) =
-3E 1+2E2+2E3 +2E -E5- 6 -E =2(E2+E3+EE+E +EE6+E) = -2(E 1+Eg) = A1 2 + A13 + A2 3
Therefore, although complete information is lacking, the sum of the coupling constants is known. Any set of trial
parameters should take advantage of the sum of the Ai4 in order to reduce the number of parameters which need to be determined.
In finding the sum of the A's, care must be used
to take the differences v1 2 - 35, etc., in the proper
direction. If, as has been assumed, the A.. are all positive, the absolute values of the spacings can be used. There is another procedure which may be simpler. If a change is made from A1 2( A13 to A12) A1 3, it is obvious from Table II that the inner lines in the group of four corresponding to nucleus 1 interchange assignment, while the outer ones remain the same. Because of the
correspondence between the diagonal matrix elements and the energies, this change in assignment holds whether a
first order spectrum or one in which some Ai• I is
being considered. Therefore, in all cases the sum of the frequencies of the lowest field line in each group is
SI = 78 + V68 + v58 = -(E7 + E6 + E5 - 3E8) = El + 3E
8
The sum of the highest line in each group is
S2 V12 2 + V1 + V1 = -- 3E 3 + E+ E2 E E E4 = - 3E1 - E 8 Now, S2 - Sl = - 4E 1 - 4E8 = 2(A1 2 + A1 3 + A2 3)
which also yeilds the sum of the coupling constants. In
addition, taking S2 + Sl = - 2E1 + 2E = v 2 + 3
gives the sum of the chemical shifts. This sum is based on the reference v so that no information is found about
the two values v3 ' - v1 ' and v' - v1 , which are actually
the parameters which are important in determining the spectrum of the group of three spins. The sum 1/3 (vl' +
v2 + v3 ') tells only where the center of the transitions
The centers of the multiplet groups may be in the same order as the vi ', but a more detailed treatment of
the energy levels is necessary to show this (if it is indeed true), and it has not as yet been possible to perform such a treatment.
It is useful to sum up what has been found -so far. Any spectrum of three spins can be broken down into three groups of four lines, each group corresponding to transi-tions of a particular nucleus (the word "corresponding" has been used in the same sense as above, exact identifi-cation being possible only in the limit of infinite magnetic field). These three groups of first order lines have the same property of repeated spacings as in a first order spectrum. There are, in general, three more lines which are the combination lines forbidden in first order, but
which become observable in a strongly perturbed case because of mixing of the wave functions. Not all of these are
usually observable, although one or two often are. The intensities of the first order lines can very greatly from unity, and some may not be observable if the \ij are
large. These facts should be remembered in trying to assign lines in a spectrum.
Some information about the line intensities can be obtained by considering only the form of the solution for them. The allowed transitions
6
Fz = -1 occur inthree groups: transitions from state 8 to the three 5, 6, and 7, from 2,3, and 4 to 1, and from 5, 6, and 7 to 2, 3, and 4. There are obviously fifteen altogether. The forms of the proper wave functions are as follows:
i=
aiJaij
'j
where i, j = 1--8. The matrix of the a. must be unitary, because one orthonormal set of wave functions is being carried into another. The form of the total matrix of the a ij is:
0
(3x3)
(3x3)
If the matrix is unitary, the individual 3x3 ones must of course be unitary also. Using this property and
•.i aij j j =i = aij j i, J = 2, 3, 4 i, j = 5, 6, 7 it follows that: 1i aij a a = 3j k
and i aji aki = 5jk
If
it is noted that (
~iIx
q
3
j)
for i, j, k = 2, 3, 4 or 5, 6, 7
is one if i=8, j=5,6,7 or i=2,3,4 j=1
and for a given i=5, 6, or 7 there are two values for
the matrix element of one, and one value zero when j takes on 2, 3, and 4, some relations among the line intensities can mow be demonstrated. Considering the first group of transitions 8 -- 5, 6, 7:
GrouIj
Group I1i
1ix8
)
2
i = 5,6,7=
T
aij
( IIx
8
)
2
j = 5,6,71i,j,k (
'jIx
kI8)(Wk
Ix 8
)a
ik
k = 5,6,7 =yj,k
(
jI
Ix
k
kIx
8)
-i aij aik
=
j,k (
IkI
L
8
(k
Ix
8
jk(
•~xl •
2
=
3
with the previous convention that (Vj IX
1&8)
= 1 when j = 5, 6, or 7. The proof for the lines in Group II, levels 2, 3, and 4 -- 1 is identical.In Group III:
I
I
ij
Group III1
z-jz
-Ii
(
k aik
ikI
i = 2,3,4
j
=
5,6,7
Ix
a,
=1i
I i,k,mk
= 2,3,4
2 = 5,6,7 [Zk Z aikaj( klxI V )J 2zj,
,n
aikajVaimajn('k
Ix
l)
m = 2,3,4n
=
5,6,7
k, m 1 k,mi,n
Y''kjIx
Ix £
•
,m
Ix
'
'n
)X Ii aikaim z aj~
a n]
,n( k Ix I ) ( ý m Ix I $n) km' n(
I'klIx
I
P')2
=6
Obviously all I Iij lines = 12 Tj9m( Im
Ix
I
n
I
The fact that the sums of the intensities of two sets of lines must be one-fourth of the total intensity helps greatly in assigning transitions to lines in a spectrum. Up to this point it has been possible to assign the lines into three multiplets. The assignment may be some-what tentative if less than the theoretical number of first order lines is observable because of degeneracy, if
some lines are very weak, or if there appear to be more than four repeats of some line spacing.. The change from A1 2( A1 3 to A12) A13 does not change the assignment of
the outer lines in the four line %ultiplet", so that if all the Aij are assumed to be positive (the case in which
this is not true will be considered later) the line at the lowest magnetic field in each four line group belongs to Group I. The highest field ones are those in Group II. Any assignment must meet the additional test that the
sums of the intensities of the lines in groups I and II must have the proper values.
Because of the possibility of negative values of Ai, the effect on the spectra of such changes in sign should be investigated. With three Aij which can each be either positive or negative, there are eight possibili-ties, but four of these are related to the other four by the reversal of all the signs. As is shown in Appendix A, there is no way to distinguish between systems related by reversal of the signs of all Aij; therefore, only four possibilities need to be considered: one with all Aij positive, and three with one negative.
In the first order spectrum of Figure 1, reversal of the sign of an A.. interchanges the assignment of the pairs of lines separated by that A.. In the figure, changing to -IA1 21 will interchange assignments of lines
i and 2, 3 and 4, etc. In any spectrum for three spins, the corresponding change occurs, and there will be four possible ways to assign lines to transitions. These
alternate assignments should be considered to see what effects they have upon the rules set up to test the grouping of lines into four line multiplets.
The sum of the chemical shifts can still be deter-mined because only the sum of the center positions of
each multiplet is needed. To use the intensity sums, the assignment which corresponds to some A.. negative can be set up (assuming the assignment into groups of four which is for all A's positive has been found) by interchanging the assignments of all pairs of lines whose separation corresponds to the A.. which is to be negative. The
3ij
new values for the appropriate transitions are then used in the sums. In some cases which depart considerably from first order, the intensity sums over groups I and II will be three for only one or two of the four possible
assignments, allowing some to be eliminated. In a first order spectrum, there exists no difference among the four possible arrangements of the signs of the A...
In finding the sum of the Aij, the correct assignment
must also be used. If (v12 - V3 5 + v1 2 - v46 + v 1 3 - v4 7)
is chosen as the sum of the splittings in the assignment corresponding to positive A's, then the same sum with new values for the v's should be used in other assignments. The algebraic sum of the A's results.
For there to be more than one assignment, other than the four possibilities discussed so far, there must exist a fortuitous relation among the parameters such that some line spacings repeat more than four times. In this case it is probable that the A.. are large, in which case the
Ij
intensities can probably determine the correct assignments. If this fails, the only recourse is taking the spectrum at another value of the magnetic field, H . If a set of
parameters can be found that predicts the spectrum at two magnetic fields, it is extremely likely that-it is the
assignments differing only in the signs of the A's. It should be added here that in the specific cases discussed later, trying to use a set of parameters with a negative A.. causes some small change in all parameters; however, by far the major change is that the A has a different sign.
After using the methods just described to determine a correct assignment, there remains the problem of find-ing the six parameters A1 2, A1 3, A2 3, v1 , 2, and v . The method used here is that of assuming a set of para-meters, calculating a spectrum on that basis, and adjust-ing the parameters for the best fit, defined as the point at which the differences between experimental and calculated spectra are equal to or less than the estimated error in the experimental spectrum. There remains a small range for each of the parameters in which there is agreement between calculated and experimental spectra. One comment on this method is helpful: it is found that if in first order a change in A1 2, for instance, is indicated by comparison of the experimental and calculated spectra, then making a change in this direction improves the fit between them. The choice of parameters is restricted by the fact that the sums of chemical shifts and coupling constants are known.
III. EXPERIMENTAL
Three systems of three spins, each of which has three nonequivalent protons coupled to each other, were selected for study. 2,4- and 2,5-dichloroaniline were studied in
solution, the three protons on the benzene ring being of interest in both cases. The protons studied are completely independent of the amine protons, which have a transition in a different region of the spectrum. The 2,5-dichloro-aniline (Eastman Kodak, White Label) was studied as a
saturated solution in carbon tetrachloride (reagent grade). This solution was in the neighborhood of three molar, but
the exact concentration is not important because any
changes in the spectra with concentration are very small, and because the same sample was used for all spectra. To increase solubility, the 2,4-dichloroaniline (Eastman Kodak, White Label) was dissolved in 80 ~6 carbon tetra-chloride with 200/oacetone by volume. The total length of the spectrum was about 3 cps. less (at 40 Mc.) than when pure carbon tetrachloride was used, probably because of a change in the chemical shifts. No explanation is offered for this effect, although it could be a basis for further work. The dependence of this effect upon the
concentration of the dichloroaniline is small, since several samples made up at different times gave the same spectra.
The third sample was styrene (Eastman Kodak, White Label), the three vinyl protons being those of interest. There is probably very little interaction between ring
protons and those on adjacent carbon atoms in side chains, since no splitting of spectral lines attributable to a coupling between these protons has been observed.
All samples were outgassed on a vacuum line by freezing, pumping and melting several times, and sealed into 5 mm. Pyrex tubes. This procedure is necessary for
the atmosphere, widens the lines noticeably by shortening the spin-lattice relaxation times. The styrene was
sub-jected to a crude distillation while under vacuum, reducing the concentration of the inhibitor to a level such that the samples had to be used within several days to prevent polymerization products and increased viscosity from
affecting the spectra.
All spectra were taken on a conventional Varian V4300B High Resolution NMR spectrometer, operating at 10 and 40 megacycles. For the 22.55 Mc. work, a transmitter-receiver following the Varian design was used. The standard 40 Mc. Varian crossed coil probe was used in this case, but
with a different receiver coil, constructed so that it resonated at the proper frequency with the capacity
included in the probe. It was not necessary to change the tuning of the transmitter coil in the probe when working at 22.55 Mc.
The spectra were recorded on the attached Sanborn recorder, using only the center portion of the chart to reduce nonlinearity to an acceptable level. At present
it is possible to measure line intensities more. accurately than when these data were taken, and the use of a more
linear recorder is advisable. Also, it is recognized
now that in some cases accurate intensities are very impor-tant. The error introduced by the recorder used here is not considered to affect any of the results in an important way, however.
The spectra were recorded as functions of time, as is usual. Fortunately the method of changing magnetic field is such that the deviation from a linear change of field with time is so small as to be negligible. There are some other factors which influence the magnetic field,
However, the changes in field introduced by these factors do not preclude the assumption that the magnetic field
changes linearly with time.
The samples were in 5 mm. O.D. Pyrex tubes, so that it was possible to spin them for best resolution (3, 8).
The procedure used to measure the line positions is standard, but several precautions are necessary to reduce error to a minimum. The spectra were taken at a sweep rate (magnetic.field sweep) chosen to reduce the effects
of the several experimental err6rs. For rapid sweeps,
the line positions become uncertain and resolution decreases because of transient effects. One particular transient
effect, "wiggles" (9), is especially disturbing where several lines occur close together. Too large a sweep rate, then, causes deterioration of the spectrum. If
the sweep rate is too slow the change of magnetic field with time may not remain linear, since the changes in
magnetic field caused by other factors (such as temperature changes) become relatively more important, Furthermore, changes in magnetic field caused by variation in the power line voltage occur mainly in small "steps" and the
longer the time spent in scanning a spectrum, the more likely that one or more of these "steps" is to occur. For measurement of positions it appears best to err (if at all) toward the faster sweeps, since the uncertainty
in line positions increases more slowly there than in the opposite case. For intensity measurement and for observa-tion of small lines near larger ones, it is decidedly
better to reduce the transient distortion as much as possible by employing a slow sweep.
Twelve or more spectra were taken at the chosen
sweep rate and the best of these spectra -- those showing no obvious effects of change in magnetic field -- were
selected and the relative positions measured. Two prominent lines at each end of the spectrum were used to establish
by interpolation and extrapolation. The individual line positions were averaged; this procedure is possible since the positions are on a common basis. This average spectrum can be used for calculation of parameters; however, the
parameters will differ from the true ones by a scale factor. To determine this scale factor it is necessary to
measure the length of the selected interval (100%0/) in the spectrum. This calibration is done by the standard method of modulating the magnetic field 1o and observing the side bands produced (38). For each line in the spectrum there will be two or more side bands symmetrically disposed around the line'. For suitable adjustment of the modulation level and frequency, it is possible to observe three essenti-ally identical spectra with the spacing between equivalent points just AH = 2wVm where AH is the difference in magnetic field of the two points, and vm the frequency of the audio modulation. If one prefers, the spacing of the spectra can be left in frequency units. From a recording
of the three spectra with a known audio modulation frequency, the spacing between the lines selected as 0 and 100 0o can be determined. Several such calibrations are averaged.
The frequency of the audio oscillator used for pro-ducing the modulation was calibrated against a tuning
fork, the frequency of which had been measured to better than 0.i
/oby
a frequency counter. The 60 cycle power frequency was also used as a secondary standard. At present it is known that this frequency is within 0.1 cps. of 60.0 cps., by direct measurement with a Hewlett-Packard frequency counter.The intensities can be measured from either the peak height or the integrated area under the curve. Both
methods seem to give similar reproducibility. If, as in the spectra taken here, there is no indication of
differing line widths, the peak height method is probably better. This statement is true because field instability is the mat important source of error and a change in mag-netic field during the time a line is being traversed will affect the width of the line, and hence the area, but will not appreciably change the height. If the radio frequency power level is too high for a given sweep rate,
there occurs the phenomenon known as saturation (9).
The main result is that the lines become broader, reducing the resolution and modifying the intensities observed. The complications introduced by this effect are avoided by keeping the power level low, but still large enough
to maintain a proper signal-to-noise ratio. Finally, both methods of intensity measurement are subjected to error because of uncertainty in the positioning of the base line. This uncertainty occurs most commonly when the lines are not all completely resolved.
The intensities from each spectrum are normalized so that the total intensity is twelve. This number is used because it is that which appears in a calculated spectrum
if the definitions given in Section II are used. The
intensities of a set of spectra may now be averaged, since they are on a common basis.
IV. RESULTS AND DISCUSSION
In Figures 2, 4, 5, 7, and 8 are shown typical spectra of the three compounds studied. These of course are
individual spectra, and their line positions and intensities are not in all cases identical to the average of these
quantities used in the analysis. Shown with the spectra are ones calculated using parameters which result in the best fit between the calculated and average experimental spectra at 40 Mc. This determination is discussed in more detail later. The results for the three compounds will be given individually.
Styrene
The upper trace in Figure 2 shows the spectrum of styrene at 40 Mc. Eleven of the first order lines of the vinyl protons are obvious toward the right. The large line on the left and several small satellites on each side are from the five ring protons. The twelfth line of the vinyl group is somewhat obscured by the satellites on the large line. In addition, there is a small combina-tion line which is observable at a larger amplificacombina-tion. Its position is at about 37 cps. on the scale and agrees with that given in the calculated spectra. Below the
experimental trace are twn ca~lculaRted spectra based upon two possible assignments of transitions to line frequencies. The two given here match the average experimental one to within experimental error. (In Figure 3 are given two
other assignments which do not fit the experimental
intensities, but do fit the line positions.) The chemical shifts are designated by the solid triangles; these are the positions where the resonances for the three protons would occur if there were no spin-spin coupling. It is seen that these positions are not exactly in the centers
C\j
0
(0
ra i i a. B i j i r I t r i 0 0 (D O O c(i
L
w
t - w o W ('JO 0 Jo -3 4Ww 06 IX I•NO
;I
Table IV lists the thirteen observed and calculated line positions and intensities at 40 Mc. The calculated ones are for assignment 1. For styrene at 40 Mc. the
probable error in a line position, based upon deviations from the mean, is about 0.15 cps., varying somewhat for different lines. There is some additional error introduced when the scale factor is measured, so the absolute line
positions have a probable error of about 0.20 cps. Measure-ment of the frequency of the audio oscillator probably
does not increase this error. The probable error in the intensity of a line is 50 6 or 0.05 units (based on a total of 12 for all lines), whichever is larger; the error in the intensity of the small combination line is about 25 /.
The quality of the analysis of the spectrum is indi-cated by the average of the deviations IVexp - VcalcI• The average for styrene is 0.22 cps., approximately the
probable error in a line position. The average deviation in intensity is about 0.1, somewhat larger than the
probable error in the experimental line intensity. There are some systematic errors in measuring intensities, such as recorder nonlinearity and saturation of the lines, which cannot easily be taken into account, so the agree-ment here is considered to be good also. The errors in line positions are comparable with those in the latest work involved with measurements on this scale (2, 7, 15, 30). The line intensities are somewhat better than those given by Bernstein, Pople, and Schneider (7).
The parameters used to calculate the spectrum 1l are:
5- 2 1 = 0.98 + 0.01 ppm.
5 5 = 1.50 _ 0.01
TABLE IV STYRENE - 40 Mc. Transition 1 2
78
46
35
12
46 78 12 35 Origin 1 1 1 1 36 36 comb. or x68
47
25 13 47 68 13 2558
58
26 26 37 37 14 14 2 2 2 23
3
3
3
Position* Observed 2.6013.50
20.78
31.78 36.87 51.23 53.05 68.68 70.60 74.15 75.96 84.4186.05
Calculated Obse 3.00 13.74 20.74 31.47 36.6751.07
52.8768.81
70.60 74.00 75.80 84.74 86.52 Intensity .rved Calculated 0.28 0.53 0.941.60
0.o18
1.51
1.86 0- 750.48
1.28
1.100.78
0.86
0.51 0.64 1.12 1.70 0.025 1.191.65
0.70o.48
1.30 1.050.81
0.82*Because positions were not measured relative to any standard, a constant was added to these positions to have them agree with the scale in the figures. The position of the observed lines has been adjusted in a similar way to get the best fit. Lines of intensity less than 0.01 have
A2
3=
1.2
+ 0.5
The numbering of the nuclei corresponds to the order of their chemical shifts across the spectrum toward the right in Figure 2. The errors quoted here are larger than those in line positions. If the spectrum were first order, the error should be V-times the error in one line position, since A1 2, for instance, is just a difference in two line positions. Here there is not a first order case, so the values of the parameters are coupled somewhat. A crude analysis of the error introduced into the sum, T Ivex p
VcalcI, by changing one parameter was made, and the errors stated are based upon this. For purposes of discussion, the values A.. are listed at the three frequencies used.
13 Frequency l2 13 23 40 Mc. 0.45 0.19 0.06 22.55 0.80 0.34 0.11 10 1.80 0.75 0.25
The spectra calculated at 22.55 Mc. and 10 Mc., using the same parameters as for spectrum :I, are shown in Figures 4 and 5. The experimental ones are shown in the same figures. The assignments and detailed positions and intensities are shown in Table V. Here the probable error in line position is 0.10 cos.; the mean deviation
IVexp - VcalcI has about the same value. The intensities
for the 22.55.Mc. spectrum agree about as well as at
40 Mc., but the deviations and experimental errors increase to about 0.2 units at 10 Mc. because the lines are no longer completely resolved. The agreement is considered excellent nevertheless. The assignment*2 which agrees at 40 Mc. does not agree at all at 10 Mc., showing that it is incorrect,
I
o
0
NJ (L) I. 0rII
, aTransition Ori0in 78
35
4636
1268
25
58
26
4713
37
14 STYRENE - 22.55 Mc. Position Observed Calculated3.7
3.38
14.0 13.60 21.2 20.72 27.6 27.20 31.2 30.9536.3
36.14
38.8
38.81
50.0 49.74 52.4 52.4153.7
53.48
55.9
56.16
59.9
59.96
62.4
62.64
Intensity Observed Calculated 0.27 0.32 0.27 0.36 0.93 0.93 0.25 0.23 1.80 2.14 1.37 1.11 2.00 2.18 1.59 1.58 1.10 0.95 o.96 0.800.13
0.11
0.54 0.52 0.79 0.76 STYRENE - 10 Mc. 7.9 10.8 13.5 15.1 18.6 23.1 24.2 28.7 35.4 -11.95 -6.26 1.438.03
10.81 13.72 15.41 18.5o 23.09 24.19 28.79,35.39
78
45 4636
68
12 2558
26 4713
14 0.11 0.09 0.05 1.09 0.59 2.673.20
2.30 0.45 1.10 0.10 0.23 0.87 0.84 3.503.11
2.03 0.59 0.89c.10
0.17and illustrating the value of having data corresponding to more than one value of the magnetic field.
The assignment of transitions to lines at 40 Mc. is given with the line frequencies in Table IV. Figure 6 then
correlates the lines observed at several frequencies and shows the relationship of the spectra. It also shows which lines remain with nonzero intensity in the limit of no
chemical shift. The line which corresponds to the transi-tion v3 6, the one observable combination line at 40 Me.,
is seen to be one of the five largest lines at 10 Me. It has intensity 1.00 in the limit of no chemical shift.
Assignment l corresponds to all Aij positive. The assignment- 2, which also fits closely at 40 Mc., is also given in the table. This new assignment has interchanged all labeling of lines separated by the splitting correspond-ing to A1 2. Now, there is a negative value for AI2 and
the parameters are:
6 - 51 = 0.99 ppm.
63 - 61 = 1.51
A1 2 -17.8 cps.
A 3 11.3
A23 = 1.4
As was mentioned earlier, this set is incorrect since it does not at all agree with experiment at 10 Mc.
It is interesting to note what occurred in changing from AI2>0 to Al2 <0. The changes made in the other
para-meters are small, but are necessary to get the best fit of the line positions. The assignments 3 and 4 are based upon sets of parameters with A1 340 and A2 3 (0. These two
can be rejected even at 40 Mc. That all assignments correspond-ing to some A.. negative have been eliminated has shown that-J the relative signs of the three coupling constants must be the same. There is no other assignment with different
mag-X - 0 I \ I I
S- co
I I I I II II / ~I / / 'I ' I 'I I' I' I II II Ihydrogens, are vl' = 25, v2' = 65, and v3' = 85 cps. Using as model compounds a-methyl styrene and trans-0-methyl styrene (prepared by C. Bumgardner), numbers 1,
2, and 3 can be assigned to particular protons in the vinyl group. In a-methyl styrene the protons have chemical
shifts of about 72 and 86 cps., relative to the ring. If it is assumed that the ring differs by only a small amount between these compounds, which is certainly correct
to the degree of accuracy needed here, then the *1 proton is evidently the a one in styrene. Therefore, the unusual chemical shift of this proton is probably connected with the well known ability of the ring to conjugate with the
a• position.
In trans-P-methyl styrene the spectrum is complicated by coupling of the methyl protons to one ethylenic proton. No complete analysis has been made, but there appears to be a coupling between the two vinyl hydrogens of 17 + 1 cps. It would appear that the 17.8 cps. coupling in styrene is that between trans hydrogens. This is in accord with the observation that in several compounds, the coupling between HH and F1 9 is larger if they are trans, instead of cis,
on a double bond (25). The assignment then is:
nitudes of v's and A's possible at 40 Mc., because there is no other with the proper repeated spacings.
In Appendix B are given some details pertaining to the calculation of the spectrum at 22.55 Mc. It demon-strates vividly the effects of the spin-spin couplings in mixing the zero order wave functions.
The values of the parameters calculated from the spectrum of styrene are rather unusual. Proton 1 is far removed from the position usually associated with ethylenic hydrogens (37). Also A2 3 is extremely small.
These values should be examined more closely. The chemical
n~ · ~r Tr~ r\ 17u ~or~ ur· iu Ir Ir ri