Publisher’s version / Version de l'éditeur:
Durability of Building Materials, 4, pp. 45-66, 1986
READ THESE TERMS AND CONDITIONS CAREFULLY BEFORE USING THIS WEBSITE.
https://nrc-publications.canada.ca/eng/copyright
Vous avez des questions? Nous pouvons vous aider. Pour communiquer directement avec un auteur, consultez la première page de la revue dans laquelle son article a été publié afin de trouver ses coordonnées. Si vous n’arrivez pas à les repérer, communiquez avec nous à PublicationsArchive-ArchivesPublications@nrc-cnrc.gc.ca.
Questions? Contact the NRC Publications Archive team at
PublicationsArchive-ArchivesPublications@nrc-cnrc.gc.ca. If you wish to email the authors directly, please see the first page of the publication for their contact information.
NRC Publications Archive
Archives des publications du CNRC
This publication could be one of several versions: author’s original, accepted manuscript or the publisher’s version. / La version de cette publication peut être l’une des suivantes : la version prépublication de l’auteur, la version acceptée du manuscrit ou la version de l’éditeur.
Access and use of this website and the material on it are subject to the Terms and Conditions set forth at
Dependence of fineness of calcium carbonate on the hydration
behaviour of tricalcium silicate
Ramachandran, V. S.; Zhang, C. M.
https://publications-cnrc.canada.ca/fra/droits
L’accès à ce site Web et l’utilisation de son contenu sont assujettis aux conditions présentées dans le site LISEZ CES CONDITIONS ATTENTIVEMENT AVANT D’UTILISER CE SITE WEB.
NRC Publications Record / Notice d'Archives des publications de CNRC: https://nrc-publications.canada.ca/eng/view/object/?id=1a664087-d0c2-40a9-8528-83dbfdbb35de https://publications-cnrc.canada.ca/fra/voir/objet/?id=1a664087-d0c2-40a9-8528-83dbfdbb35de
Ser TH1
N2ld
National Research Conseil national
no,
1435
I$
c . 2 ouncil Canada de recherches Canada
BLDG
Institute for lnstitut deResearch in recherche en Construction construction
Dependence of Fineness of
Calcium Carbonate on the
Hydration Behaviour of
Tricalcium Silicate
by V.S. Ramachandran and Zhang Chun-Mei
Reprinted from
Durability of Building Materials Vol. 4 (1986), p. 45-66
(IRC Paper No. 1435)
Price $4.00 NRCC 27141 L 1 NRC
-
CISTI I R CL I B R A R Y
MAY
15
2 5 7
B I B L I O T H ~ Q U E
6I R C
On a hydrate du silicate tricalcique (C3S) dans des rapports eaulsolide de 0,7 et 2,O en presence de 0, 5, 10, 15 et 50 % de CaC03. Des particules de carbonate de calcium de dimensions moyennes diverses (3,2, 4,4, 10.7, 14,5, 21,O et 77,O pm) ont St6 ajoutees au C3S, et on a observe le rythme d'hydratation en determinant la teneur du C3S en Ca(OHI2 et en eau non Cvaporable, ainsi que son degrg d'hydratation. L'addition de CaC03 a acc616rC l'hydratation, l'effet augmentant avec la quantits de produit ajout6 et sa finesse. Le rapport CaO/Si02 a augments 1BgSrement en presence du CaC03. 11 appert que 25 %
du CaC03 ajout6 ont St6 incorpores la phase C-S-H lorsque le C3S a St6 hydrate avec 5 % de CaC03 pendant trois jours. L'examen au microscope Blectronique a balayage a rsv6lB que les produits d'hydratation croissaient sur les particules de C3S et sur celles de CaC03.
Durability of Building Materials, 4 (1986) 45-66 4 5 Elsevier Science Publishers B.V., Amsterdam - Printed in The Netherlands
DEPENDENCE OF FINENESS OF CALCIUM CARBONATE ON THE HYDRATION BEHAVIOUR OF TRICALCIUM SILICATE
V.S. RAMACHANDRAN
i
Materials Section, Division of Building Research, National Research Council ofs Canada, Ottawa, Ontario KIA OR6 (Canada)
,
and ZHANG CHUN-ME13 Nanjing Institute of Technology, Nanjing (China)
(Received January 2 4 , 1 9 8 6 ; accepted April 1 7 , 1 9 8 6 )
Keywords Cements Properties Admixtures Physical Chemical Microstructure ABSTRACT
Ramachandran, V.S. and Zhang Chun-mei, 1986. Dependence of fineness of calcium car- bonate on the hydration behaviour of tricalcium silicate. Durability of Building Materials, 4 : 45-66.
Tricalcium silicate (C,S) was hydrated at waterlsolid ratios of 0.7 and 2.0 in the presence of 0 , 5 , 10, 15 and 50% CaCO,. Calcium carbonate of various mean particle sizes (3.2, 4.4, 10.7, 14.5, 21.0 and 77.0 fim) was added t o C,S and the rate of hydration followed by determining Ca(OH), and non-evaporable water contents as well as degree of hydration of C,S. Addition of CaCO, accelerated hydration, the effect increasing with the amount and fineness of CaCO, . The CaO/SiO, ratio increased slightly in the presence of CaCO,
.
There is evidence that as much as 25% of the added CaCO, was incorporated into the C-S-H phase when C,S was hydrated with 5% CaCO, for three days. Scanning electron microscope (SEM) examination revealed that hydration products grow o n both C,S and CaCO, particles.-i
D 1 INTRODUCTION
Limestone (Ls) is used for various purposes in concrete technology, as raw material for clinker production, partial replacement of gypsum, and as coarse or fine aggregate. Limestone dust, produced in quarrying operations, poses disposal and environmental problems and has been suggested for use as an additive to Portland cement. Some standards allow its use as an addi-
tive in cement provided the properties of the concrete made with such a cement are not adversely affected.
Studies of the effect of calcium carbonate on hydrating cement show that physical and mechanical characteristics are influenced t o different extents. These differences, particularly at early ages, are attributed t o interactions between calcium carbonate and the tricalcium aluminate
-
phase (Bensted, 1980, 1983; Berthonneau and Marseault, 1981-82;Longuet, 1983; Lyubimova et al., 1972; Mortureux et al., 1982; Spohn
and Lieber, 1965; Timashev and Kolbasov, 1981). I t is implied that the ; hydration kinetics of the C3S phase remains unaffected. Some workers have I
indicated that higher strengths in Portland cements containing CaC03 may be related t o an overall increase in the rate of cement hydration (Soroka and Setter, 1977; Soroka and Stern, 1976). Recent work shows that finely 1 divided CaCO, accelerates the hydration of C3S and influences other prop- erties (Ramachandran and Zhang, t o be published).
In practice, crushed limestone contains particles of various sizes, and ' each fraction may have its own effect on the hydration of C3S. I t was the
objective of the study to show how the hydration characteristics of C3S are influenced by CaCO, of differing particle size fractions, since this may have implications in terms of the durability of concrete containing CaC03 as an aggregate.
2 EXPERIMENTAL
2.1 Materials
Tricalcium silicate (triclinic) was supplied by the Portland Cement Asso- ciation, U.S.A., with a Blaine surface area of 3600 cm2/g. Calcium carbonate powder was supplied by the Anachemia Chemical Company. Its N2 surface
E Q U I V A L E N T S P H E R I C A L D I A M E T E R . prn
Fig. 1. Particle size distribution of different types of CaCO, : ( 1 ) Anachemia (Ac) CaCO, ;
( 2 ) Fisher (Fr) CaCO,; ( 3 ) Limestone (Ls) < 1 0 pm; ( 4 ) Limestone (Ls) 10-20 pm; ( 5 ) Limestone (Ls) 20--45 pm; (6) Limestone (Ls) 74-149 pm.
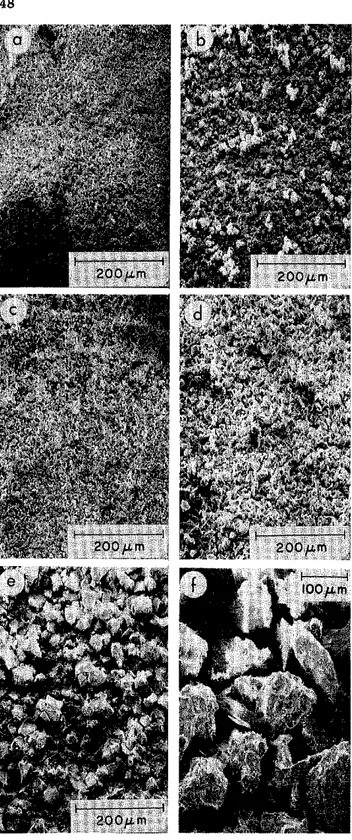
Fig. 2. Morphological features of CaCO, : (a) Ac CaCO, ; (b) Ac CaCO, (high magnifica- tion); ( c ) Fr CaCO, ; ( d ) Ls < 10 lim; (e) LS 10-20 ilm; ( f ) LS 20-45 pm; (g) Ls 74- 149 pm; ( h ) Ls 74-149 pm (low magnification).
Fig. 3. Examination of CaCO, particles by SEM, all at same magnification: (a) Ac CaCO,; (b) Fr CaCO, ; ( c ) Ls < 10 rrm; ( d ) Ls 10-20 #m; ( e ) Ls 20--45 #m; ( f ) Ls 74-149 pm.
TABLE 1
Physical characteristics of calcium carbonate samples
Sample Material Designation Particle Mean particle N, surface
no. size range size area
( @ m ) (w) (m'lg) 1 Anachemia CaCO, Ac <10 3.2 6.5 2 Fisher CaCO, Fr <25 14.5 0.4 ' 3 Limestone Ls <10 4.4 1.5 4 Limestone Ls 10-- 20 10.7 0.7 5 Limestone Ls 20- 45 21.0 0.4 6 Limestone Ls 74-149 77.0 0.2
area was 6.5 mZ/g and the mean particle diameter about 3 pm. Another
sample, reagent CaC0, with a surface area of 0.4 mz/g, was supplied by Fisher Scientific Company. Limestone containing 98.23% CaCO, was ground to different particle sizes varying from 143 pm t o less than 1 0 pm
and divided into four fractions. Details are given in Fig. 1 and Table 1. The
CaCO, used in this work was also examined by SEM and by optical micro- scope.
The Anachemia CaCO, (Ac CaC0,) has an elongated shape with well-
developed scalenohedral faces. The mean crystal size is about 1 pm in the
long axis and 0.4 pm in width (Fig. 2a,b). The Fisher CaCO, (Fr CaC03 )
has a variable grain size and is much coarser than Ac CaCO, (Fig. 2c). The individual crystals of rhombohedra vary in size from about 4 to 1 5 pm.
The morphology of the crushed limestone is shown in Figs. 2g,h and 3f. Most of the fraction is below 150 pm in size and consists of irregularly shaped particles, some exhibiting rhombohedra1 cleavage planes. Optical examination (Fig. 2h) showed some cleavage fragments. The grain size changed with the degree of grinding and sieving. In the 10-pm material the particle size varied from 2 t o 10 pm (Fig. 2d); in the fraction of size 74-149 pm the mean particle size was about 100 pm. Sedimentation anal-
ysis showed a value of 77 pm (Fig. 1).
Figure 3 comprises micrographs of samples of CaCO,, all with the same magnification. They clearly show that particle size has a significant influence
on texture. The Anachemia CaCO, and limestone (GI0 ~ m ) appear to be
similar.
2.2 Sample preparation Series I
Tricalcium silicate was mixed with different amounts of CaCO, (0, 5 and 15% with respect to the total weight of CBS + CaCO,) and transferred
the dry mix and vibrated on a Spex high-speed mixer for 2 minutes. Carbon dioxide-free distilled water was added at a waterlsolid (w/s) ratio of 0.4, then the mixture was capped and vibrated for 20 s. The polyethylene vials were placed in a plexiglas tube that was put on rollers and rotated for up t o one day. After this, the sealed samples were left t o hydrate for varying intervals of time. Before examination they were dried by continuous vacuum pumping for
a
day. Care was taken throughout t o prevent contamination with CO,. Individual samples were prepared for any required period of hydration, viz. 1 , 3 , 7 and 28 days.Series II
A second series of C3S pastes was similarly prepared using 0 , 1 5 and 50% CaCO, at a waterlsolid ratio of 2.0. These samples were hydrated for differ- ent periods and examined by SEM before the solution phase was analysed for Ca2+ determination.
2.3 Method
Thermal analysis
Differential thermal analysis (DTA) and thermogravimetric analysis (TGA) were carried out using a 1090 DuPont thermal analyser contain-
ing a 951 TGA accessory. In each experiment a 30-mg sample was heat-
ed at 20°C/min in a continuous flow of nitrogen gas. The TGA equip- ment gave both thermogravimetric and differential thermogravimetric curves. The DTA cell could be used up t o 1200°C. These methods were used to estimate C3S, Ca(OH),, CaCO, and non-evaporable water.
Conduction calorimetry
The rate and amount of heat development by C3S with and without CaCO,, for w/s ratios of 0.7 and 2.0, and for a temperature of 25"C, were measured using a conduction calorimeter supplied by the Institute of Ap- plied Physics, Delft, in the Netherlands (Ramachandran, 1973). For data acquisition and processing, the calorimeter was interfaced with an Apple IIe computer using a Taurus One 12-bit analogue-to-digital converter and an Apple super serial interface card.
Estimation of Ca2+ in the solution phase
Two grams of C,S with 0 , 1 5 or 50% CaC03 were mixed continuously by hand at a w/s ratio of 2.0 for 30 s. At specified intervals the mixture was subjected t o high-speed centrifuge at 12,000 rpm. The supernatant solution (1 ml) was taken, diluted, and analysed for CaZ* with a Perkii-Elmer 403 atomic absorption spectrophotometer.
Particle-size distribution
meritics, Sedigraph 500E particle-size analyser. Sedisperse A-12 solution (density 0.810 g/ml and viscosity 4.542 X Pass at 24°C) was used as a dispersant for particle-size measurement of CaC03.
Specific surface area
Surface area was obtained with N, as adsorbate, using a Quantasorb
.
Model 68-7 sorption system.I : Scanning electron microscope (SEM)
I Microstructural examination was conducted on fractured pieces of spec-
i
imen using a Cambridge Stereoscan, Mark 2A. These were given a conductiveI
coating of carbon and gold.~
I RESULTS AND DISCUSSION
3.1 Hydration kinetics
The rate of hydration of C,S may be followed by estimating the amount of Ca(OH), or the non-evaporable water formed at different times of hydra- tion, or by following the rate of disappearance of C3S.
The Ca(OH), formed during hydration may be estimated by chemical extraction, using thermoanalytical or QXRD methods. The chemical ex- traction method yields higher values. In the present work the thermogravi- metric method was used. Calcium hydroxide exhibits a peak at about 460- 475°C. The area of this endothermal effect was used to determine the amount of Ca(OH),
.
Figures 4 and 5 show, respectively, the effect of 5 and 15% CaC03 on the formation of Ca(OH), at different times. The TGA curves indicate that the amplitude of the peak at 460-475'C increases as hydration period increases. In quantitative terms, the amount of lime formed at 0% CaCO, (C3S basis) increases from 8.1% at 1 day to 22.3% at 28 days. A literature survey (Celani e t al., 1966; Collepardi and Massidda, 1971a; Kantro et al., 1966; Kurczyk and Schwiete, 1960; Locher, 1966; Ramachandran and Feldman, 1984; Rio et al., 1970; Valenti and Sabatelli, 1974) indicates that the amount of Ca(OH), formed at 28 days varies from 20 to 40%. This large variation results from the different techniques adopted, the differences in the physical and chemical properties of the C,S material, and the prep- aration method. Addition of CaC03 increases the amount of Ca(OH), at all times of hydration. Rate of hydration is greater with larger amounts of CaCO,, indicating that CaCO, increases the rate of hydration of C3S. The rate also depends on the particle size of CaC03, larger sizes leading to lower accelerating effects. For example, at 28 days the amounts of Ca(OH), formed with 16% CaCO,, Ls (74-149 pm) and Ac CaCO,, are 24.3 and 25.576, respectively.
6 0
u
5 1 0 15 20 25 3 0 TIME, d a y s 26-
,',I.
2 4 - 2 0 - . . .-
0 -0 REFERENCE (0% C a C 0 3 1 . a---o ii C a m 3 - i s 1 0 - 2 0 p m . . . L s 2 0 - 4 5 p m.-
. -.-.
L i 7 4 - 1 4 9 pm .Fig. 4. Formation o f Ca(OH), a t different hydration times of C,S, 5% CaCO,
Fig. 5. Formation of Ca(OH), a t different hydration times of C,S, 15% CaCO,
estimated using percent non-evaporable-water content. This required deter- mination of chemically-held water by CH and C-S-H phases. Weight loss was based o n the loss between 1 0 0 and 100O0C in the TGA apparatus. The results (based on C3S) for the samples containing 5 and 15% CaC0, are shown in Figs. 6 and 7, respectively.
The values for non-evaporable-water content are higher as the period of hydration increases. At a particular period of hydration they decrease as follows: C,S-15% CaCO,
>
C,S-5% CaCO,>
C,S-0% CaCO,. For samples containing no CaCO,, the value a t 1 day is 4.9%, increasing t o 16.1% a t 2 8 days; values in the literature vary between 13% and 17% for C,S hydrated for 2 8 days (Locher, 1966; Odler and Skalny, 1973; Valenti and.
Sabatelli, 1974). The non-evaporable water contents are highest for C,S containing 15% Ac CaCO,. At 1 day, the addition of 15% Ac CaCO, t o C,S increases the non-evaporable water content by 120%, the correspond- ing value a t 2 8 days being 30%. This indicates that acceleration of hydra- tion is particularly high at early periods of hydration. As the particle size of CaCO, increases, the effect on acceleration decreases, the coarsest sample,0
-0 REFERENCE (0% CaC031
.-- -.
15 < l o pmFig. 6 . Non-evaporahle water content as a function of hydration time of C,S, 6% CaCO,. Fig. 7 . Non-evaporabie water content asa function o f hydration time of C,S, 15% CaCO,
.
size 74-149 pm, showing a 19% increase at 1 day and 5% at 28 days with respect t o the reference sample (Fig. 7).
The hydration rate may also be monitored by determining the amount of C3S remaining unhydrated at different times. Generally, the QXRD method is adopted for this purpose. Ramachandran (1971a) has shown that C3S can be estimated by determining the area of the endothermal peak occurring a t about 915°C (Triclinic t Monoclinic Transition, heat of trans-
formation, 1 cal/g) in DTA.
Figure 8 shows the amount of C3S hydrated at different times in mix- tures with 0 and 5% CaC03. The results indicate that at all times more hy- dration has occurred in pastes containing higher-surface-area CaC03. These trends are similar t o those based on determinations of Ca(OH)> and non- evaporable water content.
C3S containing no CaC03 shows a degree of hydration of 21.5 and 63.0% at 1 and 28 days, respectively (Figs. 8-10). According t o published values, the degree of hydration of pure C3S may vary between 55 and 90% at 28 days, depending on surface area, estimation method, and curing conditions (Bentur and Berger, 1979; Berger et al., 1979; Birge, 1983; Celani et al., 1966; Collepardi and Massidda, 1971b; Kantro et al., 1966; Kurczyk and Schwiete, 1960; Lawrence and Young, 1973; Locher, 1966;
Milestone, 1979; Mukherjee and Ludwig, 1973; Odler and Skalny, 1973; Ramachandran and Feldman, 1984; Rio e t al., 1970; Valenti and Sabatelli,
1974; Young et al., 1973). Almost all CaCO, additions show an accelerat-
ing effect. In samples containing 15% CaCO, it is more significant, especially
6 0 50 as 0 40 + " < " 30 a D o REFERENCE 10% CaC031 - ". " 20 o---o
.---.
FI CaC03 - L i < l O j r n LS 10-20 pm 1 0 ... O L i 20~45 urn -Fig. 8. Amount of C,S hydrated as a function of hydration time, 5% CaCO, (C,S basis).
70 ___..=
__---
a 5 0 a-
REFERENCE 109. CsC031 Om 30.---.
A t CaCo 0 - - - 9 ii caco a-..-' 20.
Lr 10-20 prn -. - . -.
L i 14~149 pm 10-
0 5 10 15 20 2 5 30 T I M E , d a y sFig. 9. Amount of C,S hydrated as a function of hydration time, 15% CaCO, (C,S + CaCO, basis).
Fig. 10. Amount of C,S hydrated as a function of hydration time, 15% CaCO, (C,S basis).
when determined on the basis of C3S (Figs. 9, 10). At 28 days Ac CaCO,, Ls (<10pm) and Ls (74-149 pm) show increases in hydration (with respect to the reference) equal to 21.6, 11.0 and 5.8%, respectively. Thus, the sub- stantial accelerating effect of CaCO, is evident at 15% addition (Fig. 10). Some correlation is also evident in the plot of percentage C3S reacted versus percentage Ca(OH), (Fig. 11). In the presence of CaCO,, therefore, the C/S ratio of the C-S-H product may not be significantly affected, especially after hydration has proceeded beyond about 20%.
C 3 S R E A C T E D . 5
Fig. 1 1 . Percentage C,S hydration versus Ca(OH), content in C,S pastes, 0 , 5 and 1 5 % CaCO,
.
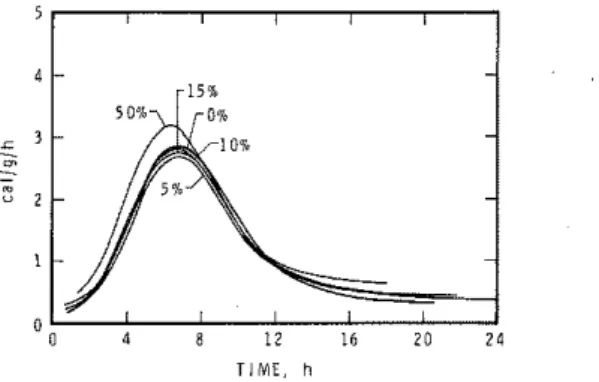
3.2 Rate of heat development
Conduction calorimetric curves giving the rate of heat development of C3S during hydration up to 24 h, in the presence of 0, 5, 10, 1 5 and 50% CaCO,, are shown in Figs. 12-16. Figures 12 and 1 3 refer to the effect of Ac CaCO,. The onset of the accelerating period representing hydration of C,S with 0% CaCO, occurs at about 1 h. In the presence of CaC0, it may occur about 30 min t o 1 h earlier (Fig. 12). The larger the amount of added CaCO,
,
the sooner acceleration starts. The amplitude of the peak is affected, the intensity (on C,S basis) increasing as the amount of CaCO, increases. Comparison with the total amount of heat developed shows that at 24 h the total heat development decreases in the following manner: C,S-15% CaCO,>
C,S-10% CaCO,>
C,S-50% CaCO,>
C,S-5% CaCO,>
C,S--0% CaCO, (based on C3S + CaCO, total weight). I t may be concluded that CaCO, accelerates the hydration of C,S. To eliminate the dilution effect of CaCO,, the heat effect was re-calculated on the basisT I M E , h TIME, h
Fig. 12. Conduction calorimetric curves of C,S hydrated with different amounts o f Ac
CaCO, (C,S + CaCO, basis), wls = 0.7.
Fig. 13. Conduction calorimetric curves of C, S hydrated with different amounts o f Ac
CaCO, (C,S basis), wls = 0.7.
Fig. 14. Conduction calorimetric curves of C,S hydrated with different amounts o f Fr
CaCO, (C,S basis), wls = 0.7.
Fig. 15. Conduction calorimetric curves of C,S hydrated with different amounts o f
powdered limestone, Ls < 1 0 fim (C,S basis). wls = 0.7.
of C3S (Fig. 13). The accelerating effect decreased as follows: C3S-50% CaC03
>
C3S-15% CaCO,>
C3S-10% CaC03>
C3S-5% CaC03>
C3 S - 0 % CaC03.Figure 1 4 refers to the effect of Fr CaCO, (coarser than Ac CaC03) on heat development. The effect is marginal during the induction period and the amplitude of the peaks is increased, although not t o the same extent as shown in Fig. 13. Figure 1 5 shows the effect of fine particles of lime- stone ( < l o ~ m ) . The induction period is practically unaffected, and the peak is shifted towards longer times (with respect t o the sample with 0% CaC03 ).
The amplitude of the peaks, especially at 10, 1 5 and 50%, is higher, how- ever. The slow rate of heat developed in the earlier period (in these mixes)
may be due to a coating formed on the particles during grinding. This coating matter may have originated with impurities present in the lime- stone or with the steel discs in the grinder. Water did not wet these particles as easily as i t did the coarser ones.
The influence of CaCO, on the rate of hydration depended on the time interval chosen. At 1 0 ~ 1 5 % CaCO, it is slightly retarding a t 3-4 h, but accelerating at 1 day. Addition of admixtures such as triethanolamine induces such behaviour in C3S (Ramachandran, 1972). As can be expected from other results, the coarser particles of CaCO, have a significantly lower accelerating effect on C3S than fine particles (Fig. 16). The heat develop- ment a t 1 day with 5% fine CaCO, (Fig. 1 3 ) is more than that developed in the presence of 50% coarse CaCO, (74-149 pm).
T I M E , h
Fig. 16. Conduction calorimetric curves of C,S hydrated with different amounts o f powdered limestone, Ls 74-149 rrm (C,S basis), w/s = 0.7.
3.3 CaO/Si02 ratio
In the presence of certain admixtures such as CaC1, the C/S ratio of the C-S-H product changes, so that the degree of hydration based on either Ca(OH), or non-evaporable-water content may not show a good correlation with the rate of hydration of C,S (Ramachandran, 1971b). The CaO/SiO, ratio of the C-S-H phase in C3S pastes was calculated a t different hydra- tion times as follows.
By using a known amount of vacuum-dried paste and carrying out TGA, the percentage of ignited weight (m,) and percentage Ca(OH), ( m 3 ) were determined. Applying DTA, the percentage of unhydrated C3S remaining in the paste was determined (m4). The CaO/SiO, molar ratio can be com- puted (Ramachandran and Zhang, t o be published) t o be:
where M c a o , M c , ~ , M C H and
Msio*
are the molecular weights of CaO, C,S, Ca(OH), and SiO,, respectively.This can be simplified to
A small amount of carbonation in some of the pastes has been taken into account for calculation, but it is not included in the equation. Similar calculations were also carried out for mixtures with added CaCO,. TGA was used to estimate CaCO,
.
The CIS ratios of the C-S-H product are shown as a function of time in Fig. 17. The ratio increases more significantly between 1 and 3 days than a t later periods. There is evidence that the paste containing CaCO, has a slightly higher CaO/SiO, ratio than that without CaCO,. As the particle size of CaCO, increases (not shown in the figure) the CIS ratio approaches the values for C-S-H formed in C3S paste with 0% CaCO,.
c REFERENCE 10% C d C 0 3 1
.---.
A c c a c o 31 . 6 r-.--v
.---.
i r t a c o lL i < l o i r m
Fig. 17. CaOiSiO, ratios o f C-S-H formed during hydration of C , S , 15% CaCO,
A part of the explanation for higher CIS ratios is that some CaC0, is incorporated into the C-S-H phase. At 28 days, the CIS ratio of the C-S-H phase for C3S paste with 0% CaCO, is 1.86, compared with 1.95 for paste containing 15% Ac CaCO,
.
The CIS ratios quoted in the literature for C,S paste hydrated for 28 days vary between 1.4 and 2.0 (Dent Glasser et al., 1978; Kondo and Daimon, 1969; Le Sueur et al., 1984; Taylor and Roy, 1980). The values depend on the w/s ratio and the method of deter- mination. Use of lower w/s ratios tends t o give higher CIS ratios. The chem- ical-extraction method yields lower values than thermal methods. For pastes prepared a t a w/s ratio of 0.45, Locher (1966) obtained a CIS ratio of 1.5-1.6 using the chemical-extraction method, and a value of about 2.0 using the thermogravimetric method. It is possible that the chemical method may extract some of the bound CH from the C-S-H phase.3.4 State of CaCO,
It has been shown that, in the hydration of C3A, calcium carbonate reacts with it t o form a carboaluminate complex. Similarly, CaC1, forms a chloro- aluminate complex with C,A. Although it is assumed that CaCl, is inert with respect t o hydrating C3S, both Rarnachandran ( 1 9 7 1 ~ ) and Richartz (1969) found evidence that it is bound strongly as a complex with the C,S paste. Experiments were therefore carried o u t t o investigate whether CaCO, is also bound t o the C3S paste as a complex.
Thermogravimetric analysis of the C,S
+
CaCO,+
H,O system indicates that as hydration proceeds the peak due t o CaC03 diminishes. This suggests that some CaC03 is consumed during the hydration reaction. Figure 18 shows the amount of free CaCO, remaining a t different hydration times. I n the C,S-CaCO, mixture containing 15% Ac CaC0, and 5% Ac CaCO,, 14.5 and 25.0% of the added CaCO, reacted with the hydrating C3S a t three days. Consumption of CaC0, decreased as particle size increased, indicating that the reaction is influenced predominantly by the exposed surface. After three days of hydration there was little consumption of CaCO, in most samples.Earlier work, in which the paste was heated t o different temperatures, showed that the part of CaC0, that is combined with the C-S-H phase is released at or before 525°C (Ramachandran and Zhang, t o be published). This has implications in terms of the accelerating effect of CaCO, o n C,S,
Flg. 18. Free CaCO, remaining in C , S pastes at different times o f hydration (based on C , S + CaCO,).
the determination of the optimum amount of CaCO, needed
to
replace gypsum (wholly or partly) in cement, and the durability of concrete contain- ing CaCO, as a coarse or fine aggregate.3.5 Accelerating mechanism
Some understanding of the hydration mechanism may be obtained by following the Ca2+ concentration in the solution. This is facilitated by
using a higher w/s ratio than 0.7. Experiments were therefore conducted a t
:
a w/s ratio of 2.0, using 0, 1 5 and 50% Ac CaCO,.
The conduction calorim-eter curves are shown in Figs. 1 9 and 20.
Concentrations of CaZt in solutions of pastes containing 0, 1 5 and 50% Ac CaCO, are shown in Fig. 21. In pastes with 0% CaC03, the Caa+ con- centration exceeded the saturation level at 1 5 min. continued t o increase
Fig. 19. Conduction calorimetric curves o f C,S hydrated with different amounts of Ac CaCO, (C,S + CaCO, basis), w/s = 2.0.
Fig. 20. Conduction calorimetric curves of C,S hydrated with different amounts of Ac CaCO, (C,S basis), wls = 2.0.
T I M E . I?
Fig. 21. Influence of CaCO, on concentration of Ca" in the solution phase during C,S hydration.
to a peak at about 5 h, then decreased. Several investigators have observed that the peak of the CaZ+ concentration curve coincides with the termina- tion of the induction period ( Skalny and Young, 1980; Young et al., 1977). In the present work, the peak occurred several hours after the induction period had terminated (Figs. 19 and 20). In other words, at 5 h a substantial amount of C3S had already hydrated. That the maximum CaZ+ concentra- tion does not correspond to the end of the induction period has already been reported (Fierens and Verhaegen, 1976; Kurdowski and Nocun-Wezelik, 1983; Menetrier et al., 1980; Odler and Dijrr, 1979; Skalny and Young, 1980; Slegers and Rouxhet, 1977; Taylor et al., 1984). This may imply
Fig. 22. Micrographs of C,S pastes containing 0 or 50% CaCO,, hydrated for 1 day (w/s = 0.7) (C: Growth on C,S; L : Growth on caleium carbonate). (a) 0% CaCO,; (b) 50% Ac CaCO, ; ( c ) 50% Fr CaCO, ; (d) 60% Ls < 1 0 rm; (e) 50% Ls 74-149 irm.
that the nucleation of Ca(OH)z crystals does not control the induction period. A possibility exists that crystalline Ca(OH), forming near the grain surfaces may act as nuclei. Localised Ca(OH), concentrations at or near the C3S particles may be high (Berger and McGregor, 1973; Skalny and Young, 1980).
Conduction calorimetric curves for C3S hydrated with 1 5 and 50% Ac CaCO, at wls = 2.0 indicate that the rate of heat development in these mixes was higher than that with 0% CaC0, (Figs. 1 9 and 20). SEM studies
,'
show that very little hydration had taken place in any of the samples in the first 2 h. At 3 h only a small amount of hydration had occurred with 0% CaCO,, but a larger amount had formed with 50% CaCO,. At 6 h more hydrated products were formed in samples with 0% and 50% CaCO,. The microstructural results are in agreement with heat-development curves in Fig. 19. Total heat development was also higher in the presence of CaC03. It is clear, therefore, that the addition of Ac CaCO, accelerates C,S hy- dration.The CaZi ion concentration of the solution increased sharply in the presence of Ac CaCO,
,
that with 50% showing a peak at about 1 h and that with 15% having a peak at 2 h (Fig. 21). In both samples the peak of the Ca2' ion concentration occurred close to the acceleration peak effect. SEM studies (of C3S hydrated at w/s = 0.4 and 0.7) show that the hydration product grows in the form of fibres on both C3S and CaCO, (Figs. 22 and 23). SEM microanalysis of the surface indicated the existence of Si and Ca in these fibrous particles. The paste hydrated with 0% CaCO, showed columns of Ca(OH), dispersed in the matrix (Fig. 23a,f), but that with CaC03 only occasionally showed columns or plates (Fig. 23b-e, g-j).The fibrous growth of the hydrated products on CaCO, may indicate that calcium carbonate particles are acting as nuclei. Growth of CH and C-S-H would decrease the concentration of ions in the solution phase and accelerate their transfer from the C3S surface to the solution phase. C-S-H formed on the CaCO, surface may incorporate some CaCO,
.
The preferential formation of large crystals of Ca(OH), in paste without CaCOB may be explained as follows: in normal hydration of C3S, Ca(OH), grows into large crystals in the pore spaces. In the presence of high-surface- area CaC03, Ca(OH), grows preferentially on the innumerable sites avail- able and this would prevent local growth in a particular area.
Figure 1 8 shows that in the early period of hydration some CaC03 is incorporated into the C-S-H phase. If this were to occur in the C-S-H
Fig. 23. Micrographs of C,S pastes containing CaCO, of different particle sizes, hydrated for 28 days. (C: Growth on C,S; L: Growth on calcium carbonate). (a) 0% CaCO,
,
wls = 0.4; (b) 15% Ac CaCO,, w/s = 0.4; ( c ) 16% Fr CaCO, , wls = 0.4; (d) 15% Ls < 1 0 r m ,WIS = 0.4; (e) 15% Ls < 74-149 rrm, w/s = 0.4; ( f ) 0 % CaCO,, w/s = 0.7; (g) 50% Ac CaCO,, wls = 0.7; (h) 50% Fr CaCO,, wls = 0.7; (i) 50% Ls < 1 0 r m , wls = 0.7; (j)
formed at the surface of C,S it could result in the formation of a higher permeable C-S-H membrane, or this phase might itself be a nucleating agent for the hydrated products. Either possibility could result in accelerated C,S hydration.
Fibrous growth occurrd over all the particles of CJS and CaC0, (Fig. 23) and C/S ratio (by microanalysis) varied between 1.9 and 17, indicating that C-S-H formed on both C3S and CaCO,. Generally, the CIS ratios of the hydrated C,S particles varied between 1.9 and 2.4; those on the CaC0, particles varied in the range 5-17. The higher values on CaC03 can be at- ,'
tributed to (1) background excitation from CaCO,, because the hydrated products on the CaCO, surface are thin, and (2) the incorporated CaC03 in the C-S-H phase. Generally, it is known that C-S-H forms as an "inner" and an "outer" product close to the original unhydrated C3S (Fig. 23b), whereas CH formation is not confined to this boundary (Dent Glasser et al., 1978; Pommersheim and Clifton, 1982; Skalny and Young, 1980). In the presence of CaCO, it appears that silicate ions can migrate farther from the confines of the C,S phase and grow as C-S-H on the CaCO, particles.
As already shown, the rate of hydration is increased as the amount and surface area of CaC0, are increased. This is reflected in the growth of hydration products (Fig. 22). It is expected that both factors also enhance nucleation and surface interaction effects on the hydrating C,S surface.
CONCLUSIONS
Addition of CaCO, increases the rate of hydration of C,S and this accel- erating effect increases as the particles sizes become finer and the amount of CaCO, is increased. The CIS ratio of C-S-H is modified slightly. There is evidence of partial incorporation of CaC0, into the C-S-H phase. The hydrate products form on both CaCO, and C,S particles. Acceleration may result from a nucleating effect of CaC0, and modification of the C-S-H membrane forming over the hydrating C3S surface. In addition t o existing as "inner" and "outer" products, the C-S-H phase may also grow outside the confines of these zones.
ACKNOWLEDGEMENT I
The authors are very grateful to G.M. Polomark for providing extensive experimental assistance and to E.G. Quinn for SEM work. This paper is a contribution from the Division of Building Research, National Research ' Council of Canada.
REFERENCES
Bensted, J., 1980. Some hydration investigations involving Portland cement
-
effect of calcium carbonate substitution of gypeum. World Cem. Technol., 11(8): 396-406.Bensted, J., 1983. Further hydration investigations involving Portland cement and the substitution of limestone for gypsum. World Cem. Technol., 14(10): 383-392.
Bentur, A. and Berger, R.L., 1979. Chemical composition of C-S-H gel formed in the
hydration of calcium silicate pastes. J. Am. Ceram. Soc., 62(3-4): 117-120.
Berger, R.L., Bentur, A,, Milestone, N.B. and Kung, J.H., 1979. Structural properties
of calcium silicate vastes: I. Effect of the hvdratine comoound. J. Am. Ceram. Soc..
62(7-8): 358-366:
-
Bereer. R.L. and McGreeor. J.D.. 1973. Effect of temverature and water-solid ratio o n - . - . growth of Ca(OH), crystals formed during hydration of Ca,SiO,. J. Am. Ceram. Soc., 56(2): 73-79.
Berthonneau, 0 . and Marseault, J.C., 1981-82. Influence of limestone filler in cement. In: Rapport de fin d'etudes, ENSAM, Paris.
Biirge, T.A., 1983. 14,000 psi in 24 hours. Concr. Int., 5(9): 36-41.
Ceiani, A,, Collepardi, M. and Rio, A,, 1966. The influence of gypsum and calcium chloride on the hydration of tricalcium silicate. Ind. Ital. Cem., 36(7): 669-678. Collepardi. M. and Massidda. L.. 1971a. Hydration of tricalcium silicate. J . Am. Ceram.
Sic., 54(9): 419-422.
Collepardi. M. and Massidda, L., 1971h. L'idratazione in pasta del silicato tricalcio in prksenzi di solveuti organ&. Ann. Chim. (Rome), 61: 149-159.
Dent Glasser, L.S., Lachowski, E.E., Mohan, K. and Taylor, H.F.W., 1978. A multi- method study of C,S hydration. Cem. Concr. Res., 8(6): 733-740.
Fierens, P. and Verhaegen, J.P., 1976. Hydration of tricalcium silicate in paste - kinetics
of calcium ions' dissolution in the aqueous phase. Cem. Concr. Res., 6(3): 337-342. Kantro, D.L., Weise, C.H. and Brunauer, S., 1966. Paste hydration of beta-dicaicium
silicate, tricalcium siiicate, and alite. Highw. Res. Board Spec. Rep., 90: 309-325. Kondo, R. and Daimon, M., 1969. Early hydration of tricalcium silicate: a solid reaction
with induction and acceleration periods. J. Am. Ceram. Soc., 52(9): 503-508.
Kurdowski, W. and Nocun-Wezelik, W., 1983. The tricalcium siiicate hydration in the presence of active silica. Cem. Concr. Res., 13(3): 341-348.
Kurczyk, H.G. and Schwiete, H.E., 1960. Elektronenrnikroskopische und thermoche- mische Untersuchungeu iiber die hydration der Calciumsilikate 3CaO.Si0, und p- 2CaO.Si0, und den Einfluss von Calciumchlorid und Gips auf den Hydrationsvorgang. Tonind. Ztg., 84: 685-598.
Lawrence, F.V. and Young, J.F., 1973. Studies on the hydration of tricalcium silicate pastes. I. Scanning electron microscopic examination of microstructural features. Cem. Concr. Res., 3(2): 149-161.
Le Sueur, P.J., Double, D.D. and Groves, G.W., 1984. Chemical and morphoiogical studies of the hydration of tricalcium silicate. Br. Ceram. Soc. Proc., 35: 177-191. Locher, F.W., 1966. Stoichiometry of tricalcium silicate hydration. Highw. Res. Board
Spec. Rep., 90: 300-308.
Longuet, P., 1983. Reactivity of calcareous fillers. Cim. BBtons Platres Chaux, 742-3:
176-179.
Lyubimowa, T.Yu., Nismevich, M.L., Levkova, N.S. and Mikhailov, N.V., 1972. Struc- ture formation kinetics during hardening of cements in the presence of carbonate fillers. Koiloidn. Zh., 34(6): 868-877.
: Menetrier, D., Jawed, I. and Skalny, J., 1980. Hydration of tricalcium silicate
-
a studyby high resolution scanning electron microscopy. Silic. Ind., 1 2 : 243-248.
Milestone, N.B., 1979. Hydration of tricalcium silicate in the presence of lignosulfonates,
glucose, and sodium gluconate. J. Am. Ceram. Soc., 62(7-8): 321-324. . - . , - .
Mortureux, B., Hornain, H. and Regourd, M., 1982. Cement paste-fillers bond in blended cements. Revort. Centre d'Etudes e t de Recherche de I'Industrie des Liants Hydrau- liques ( C E R ~ L H ) ; Paris, pp. 1 - 4 .
Mukherjee, K. and Ludwig, U., 1973. Uber die Beeinflussung der Hydrationsgeschwindig- keit des C,S und des p-C,S durch Calciumchlorid und Calciumsulfatzusltze. Tonind. Ztg., 97(8): 211-216.
Odler, I. and Dorr, H., 1979. Early hydration of tricalcium silicate. 11. The induction period. Cern. Concr. Res., 9(3): 277-284.
Odler, I. and Skalny, J., 1973. Hydration o f tricalcium silicate at elevated temperatures. J . Awwl. Chem. Biotechnol.. 23: 661-667.
~ o m m e r s h e i m , J.M. and ~ l i f t d n , J.R., 1982. Mathematical modeling of tricalcium silicate hydration. 11. Hydration sub-models and the effect of model uarameters. Cem. Concr. ~ e s . , 12(6): 765--772.
Ramachandran, V.S., 1971a. Estimation of tricalcium silicate through polymorphic
transformation. 3. Therm. Anal., 3 : 181-190.
Ramachandran, V.S., 1971b. Kinetics of hydration o f tricalcium silicate in presence of calcium chloride by thermal methods. Thermochim. Acta, 2(1): 41-65.
Ramachandran, V.S., 1971c. Possible states of chloride in the hydration of tricalcium silicate in the presence of calcium chloride. Mat&. Constr. (Paris), 4(19): 3-12.
Ramachandran, V.S., 1972. Influence of triethanolamine o n the hydration characteristics of tricalcium silicate. J. Appl. Chem. Biotechnol., 22: 1125-1138.
Ramachandran, V.S., 1973. Action of triethanolamine o n the hydration o f tricalcium aluminate. Cem. Concr. Res., 3(1): 41-54,
Ramachandran, V.S. and Feldman, R.F., 1984. Cement science. In: V.S. Ramachandran (Ed.), Concrete Admixtures Handbook, Noyes, Park Ridge, NJ, U.S.A., pp. 1-53. Ramachandran, V.S. and Zhang, C.M. Influence o f CaCO, o n the hydration and micro-
structural characteristics o f tricalcium silicate. (To be published).
Richartz, W., 1969. The combining of chloride in hardening cement. Zem.-Kalk-Gips,
22(10): 447-456.
Rio, A,, Celani, A. and Saini, A,, 1970. New investigations o n the action mechanism of
gypsum and calcium chloride and their influence o n the structural and mechanical characteristics of the hydrosilicates produced by the hydration of C,S. Cemento, 67: 17-26.
Skalny, J. and Young, J.F., 1980. Mechanism of Portland cement hydration. In: Proc. 7 t h Int. Cong. Chem. Cem., Paris, Vol. 1 , 11-1. Editions Septima, Paris, p. 45.
Slegers, P.A. and Rouxhet, P.G., 1977. The hydration of tricalcium silicate: Calcium concentration and portlandite formation. Cem. Concr. Res., 7(1): 31-38.
Soroka, I. and Setter, N., 1977. The effect o f fillers o n strength o f cement mortars. Cem. Concr. Res., 7(4): 449-456.
Soroka, I. and Stern, N., 1976. Calcareous fillers and the compressive strength o f Port- land cement. Cem. Concr. Res., 6(3): 367-376.
Spohn, E. and Lieber, W., 1965. Reactions between calcium carhonste and Portland
cement. Contributions t o the systems C,A-CaC0,-H, 0 and C,AF-CaCO, -H, 0.
Zem.-Kalk-Gips, 18(9): 483-485.
Taylor, H.F.W., Barret, P., Brown, P.W., Double, D.D., Frohnsdorff, G., Johansen, V., Menetrier-Sorrentino, D., Odler, I., Pamott, L.J., Pommersheim, J.M., Regourd, M. and Young, J.F., 1984. The hydration of tricalcium silicate. RILEM Committee 68.MMH. Mat&. Constr. (Paris), 1 7 ( 1 0 2 ) : 457-468.
Taylor, H.F.W. and Roy, D.M., 1980. Structure and composition of hydrates. In: Proc. . '
7th Int. Cong. Chem. Cem., Paris. Vol. 1. 11-2. Editions Seotima. Paris. u. 13. . .
Timashev, V.V; and ~ o l h a s o v , v.M., 1981. Properties of cements with carbonate addi-
tives. C.R. (URSS), 10: 10-12.
i
Valenti, G.L. and Sabatelli, V., 1974. Contribution of thermogravimetric analysis t o the study o f the stoichiometry of tricaicium silicate hydration. Cemento. 3: 141-148. Young, J.F., Berger, R.L. and Lawrence, F.V., 1973. Studies on the hydration of trical-,
cium silicate pastes. 111. Influence of admixtures on hydration and strength develop- ment. Cem. Concr. Res., 3(6): 689-700.
Young, J.F., Tong, H.S. and Berger, R.L., 1977. Compositions of solutions in contact