Publisher’s version / Version de l'éditeur:
Journal of Adhesion Science and Technology, 8, 5, pp. 473-484, 1994
READ THESE TERMS AND CONDITIONS CAREFULLY BEFORE USING THIS WEBSITE. https://nrc-publications.canada.ca/eng/copyright
Vous avez des questions? Nous pouvons vous aider. Pour communiquer directement avec un auteur, consultez la première page de la revue dans laquelle son article a été publié afin de trouver ses coordonnées. Si vous n’arrivez pas à les repérer, communiquez avec nous à [email protected].
Questions? Contact the NRC Publications Archive team at
[email protected]. If you wish to email the authors directly, please see the first page of the publication for their contact information.
NRC Publications Archive
Archives des publications du CNRC
This publication could be one of several versions: author’s original, accepted manuscript or the publisher’s version. / La version de cette publication peut être l’une des suivantes : la version prépublication de l’auteur, la version acceptée du manuscrit ou la version de l’éditeur.
For the publisher’s version, please access the DOI link below./ Pour consulter la version de l’éditeur, utilisez le lien DOI ci-dessous.
https://doi.org/10.1163/156856194X00177
Access and use of this website and the material on it are subject to the Terms and Conditions set forth at
Swelling and adhesion characteristics of lignin-filled polyurethane
sealant
Lacasse, M. A.; Feldman, D.
https://publications-cnrc.canada.ca/fra/droits
L’accès à ce site Web et l’utilisation de son contenu sont assujettis aux conditions présentées dans le site LISEZ CES CONDITIONS ATTENTIVEMENT AVANT D’UTILISER CE SITE WEB.
NRC Publications Record / Notice d'Archives des publications de CNRC:
https://nrc-publications.canada.ca/eng/view/object/?id=409da701-6ded-41d2-81c6-c9b74dad5149 https://publications-cnrc.canada.ca/fra/voir/objet/?id=409da701-6ded-41d2-81c6-c9b74dad5149
J. Adhesion Sci. Techno/. Vol. 8, No. 5, pp. 473-484 (1994)
© VSP 1994.
Swelling and adhesion characteristics of lignin-filled
polyurethane sealant
M. LACASSE1 and D. FELDMAN2·•
1Jnstitute for Research in Constmction, National Research Council, Ottawa, Ontario, Canada KIA OR6 2Centre for Building Studies, Concordia University, Montreal, Quebec, Canada H3G JMS
Revised version received 1 November 1993
Abstract-Previously, polyurethane (PU)-lignin polyblend sealants from the point of view of adhesion to various substrates, morphology based on scanning electron microscopy, and miscibility based on differential scanning calorimetry (DSC) and 13C nuclear magnetic resonance (NMR) were studied. In this study the same polyblends together with PU filled with a few mineral fillers were used. Swelling tests were applied to establish the number average molecular weight between crosslinks of the PU and to assess the degree of interaction between various fillers including different types of lignin and the PU matrix. Lignins were found to restrict less the degree of swelling of PU than that by the Sillitin (siliceous clay)-Titanox Ti02 3.17:1 wt/wt mixture. Data based on the swelling method show that lignins do not interact with the elastomer matrix to as great an extent as Sillitin/Titanox filler mixture, a finding which is in good agreement with the former DSC and NMR results.
Keywords: Swelling; adhesion; lignin; polyurethane sealant.
1. INTRODUCTION
Previously it was shown that polyurethane (PU)-based sealants, when blended with Kraft lignin, have tensile properties superior to those of the unblended elastomer [1]. Such sealants were tested in a detailed programme where lignin-sealant polyblends with up to 20 parts by weight (pbw) lignin were supplied to substrates such as aluminum, mortar, and wood, and subjected to different weathering conditions. The results of tensile tests showed that, generally, lignin acts as a reinforcing agent which adds rigidity to the elastomer matrix, as indicated by the increase in the modulus of blended sealants with the addition of lignin.
The results of these studies also showed that lignin when incorporated in such poly-meric systems acts as a reinforcing filler in the two-phase polypoly-meric particulate system. Evidence of phase separation was obtained through studies of the morphology of a PU-based sealant modified with lignin using scanning electron microscopy (SEM) and differential scanning calorimetry (DSC) [2]. The latter technique indicated that the two polymers are immiscible. Similar conclusions were drawn from studies using solid-state high-resolution 13C-NMR [13].
In this study swelling tests were used to determine the number average molecular weight between crosslinks (Me, s) of various elastomer formulations and to assess the
*To whom correspondence should be addressed.
degree of interaction between the various particulate fillers including different types of lignin and the elastomeric matrix.
2. EXPERIMENTAL 2.1. Materials
For the control PU formulation the following components were used: isocyanate pre-polymer, polyol prepre-polymer, catalyst and solvent, molecular sieve, plasticizer, antioxi-dant, and filler.
Tables 1 and 2 present the prepolymers, used in this research project. The catalyst was a mixture of lead octoate (24% Pb) and calcium octate (5% Ca), and the solvent was a naphthalene derivative (Solvesso 100, Esso Canada). The molecular sieve was compounded from an alkali alumino-silicate dispersed in castor oil (50% by weight) (Baylith L paste, Bayer Canada) having a density of 1.25 g/cm3 and a water absorption capacity of 10% (wt).
Table 1.
Physical and chemical properties of isocyanate prepolymers
Structure Trade name
MDF polyisocyanate Desmodur VLd prepolymer
MDic polyisocyanate Mondur XP 743d
prepolymer
TDie dilsocyanate Desmodur E 14d prepolymer a EW = Equivalent weight. b f = Functionality. NCO content (%) 30 8 3.5
cMDI = 4, 41 -diphenyl methane diisocyanate. eTDI = Toluene diisocyanate.
dTDI = Produced by Bayer Co. Canada.
Table 2. Density (at20°C) (g/cm3) 1.22 1.16 1.05
Physical and chemical properties of polyol prepolymers
Structure Trade name OH Density Viscosity (at20°C) EWa fb (mPa s) (g) 130 160 3000 525 2 8500 1200 2 Viscosity content (at 20°C) (at20°C) EW
(%) (g/cm3) (mPa s) (g) Branched polyether Desmophen 550Ua 11.5 1.01 600 148 Branched polyglycol having Desmophe.n 1140a 8 1.04 1400 215 ether and ester groups
Branched polyglycol having Desmophen 1920D 5 1.01 3500 340 ether and ester groups
Branched dispersoid grade Desmophen 1920D 0.85 1.08 3300 2000 polyether
EW
=
Equivalent weight; f=
functionality; M0=
molecular weight (number average).a all products are those produced by the Bayer Corporation, Canada.
Mn (glmol) 1050 2400 f Mn (glmol) 3 6000
Data from Bayer Technical Publication No. LS 44399e (4.83 ed.), Bayer A.G., L.S. Group, Leverkusen, Germany, 1983.
Swelling of lignin-filled PU sealant 475
An alkyl phenol sulphonic ester (Mesamoll, Bayer Canada) having a density of 1.03 g/cm3 and a viscosity of 95-125 mPas and butyl phthalate (Santicizer, Bayer Canada) with a density of 1.11 gjcm3 and a viscosity of 2.12 mPas were used as plasti-cizers. 2,2-Methylene-bis( 4-methyl-6tert.-butylphenol) (Vulcan ox BKF, Bayer Canada) was the antioxidant.
The molecular sieve acts as a sponge to absorb excess moisture from hydrophilic polyols and from the surface of fillers. Free surface moisture is the cause of bubble for-mation in elastomers due to the reaction of water with isocyanates which produces C02 .
Bubble formation, although not itself detrimental to the overall strength of the resulting elastomer, is not considered advantageous from the point of view of forming products with predetermined properties.
In some cases, inorganic fillers were replaced by Kraft lignin to obtain polyblends of PU-Iignin. The following types of Kraft lignin were used: Tomlinite (TO), Indulin AT (AT), and Eucalin (EU).
2.2. Procedure
2.2.1. Compounding formulations. Unfilled PU: The hygroscopic nature of the
iso-cyanate and pol yo! prepolymers necessitated that precautions be taken with respect to the storage of materials and the level of moisture present while blending the components. For this purpose, a double-size glove box was used in which all moisture-sensitive chemicals were stored and formulations were prepared. A two-step procedure was used to ensure a dry atmosphere in the chamber; a positive pressure was maintained using dry nitrogen (purged of moisture by passage through a packed column of desiccant), so that the moisture-laden air could not enter, and a bed of desiccant was placed in the bottom of the chamber to absorb any traces of moisture present in the nitrogen atmosphere.
Various unfilled formulations were prepared in order to study the change in thermal and mechanical properties as a function of three parameters: the stoichiometric ratio (SR), the plasticizer content (PC), and the Baylith paste-polyol ratio (BPR).
The stoichiometric ratio refers to the molar ratio of active components, namely, the ratio of active isocyanate to hydroxyl groups. The plasticizer content is measured in relation to the amount of polymeric components [polyether, toluene-2,4-diisocyanate (TDI) and Baylith paste] in the formulation on a wt% basis. The polyol ratio refers to the molar ratio of hydroxyl groups provided by the Baylith paste (which contains 50 wt% castor oil) to that provided by the primary polyol.
Formulations were blended by weighing individual components and stirring these manually for 3 min after each component had been added. The order of mixing of these components was as follows: (i) polyol prepolymer, (ii) Baylith paste, (iii) plasticizer, (iv) isocyanate prepolymer, (v) catalyst and solvent. Blended formulations were then poured into the various moulds. The cast elastomers were permitted to cure in the glove box at room temperature for at least 24 h, depending on the rate of cure of the system, after which they were allowed to complete their curing process in standard laboratory conditions (25
oc
and 50% relative humidity). The curing process was monitored on a regular basis using hardness tests.Filled PU: The use of fillers results mainly from the requirement for certain physical
properties. With suitable fillers, the modulus of elasticity can be increased over a greater temperature range; stability and heat distortion can be increased; and the thermal expansion coefficient can be decreased.
Table 3.
Physical properties of inorganic particulate fillers
Type Trade name Specific Specific Average gravity surface particle
area size (m2 /g) (pm) Ground silicab Sil-co-Sil #400 2.65 0.6 7.4 Silica/kaoline Sillitin Z86 2.60 12 1.35 (AI silicate)
Titanium dioxided Titanox 2101 4.00 10 0.3 Chemical analysis of inorganic fillers
Filler type Si02 Fez03 Alz03 Ti02 CaO Ground silica 99.8 0.015 0.047 0.013 < 0.01 Al silicate (ST) 80.5 0.7 12.5 0.7 0.5
Titanium dioxide 92
a¢m =Maximum packing factor.
bottawa Industrial Sand Co., Ottawa, Canada.
cHoffman Mineral, Franz Hoffman & Sehne KG, Neuburg/Donau, Gennany. dNL Chem Canada Inc., Montreal, Canada.
•LOI = Loss on ignition.
Table 4.
Physical characteristics of organic particulate fillers
Filler type Name Specific Specific Average gravity surface particle pH
area size (m2 /g) (pm) Oil absorption ᄁセL@ (g/100 g) 33 0.52 45-55 0.42 25 0.48 MgO Lor• 0.01 0.09 0.5 3.6 8 Oil absorption
¢::,
(g/100 g) Kraft lignin- Eukalinb (EU) 1.379 10.5c 9-10 40 0.63 eucalyptus woodKraft lignin-softwood Indulin ATd (AT) 1.238 1.5 Kraft lignin-hardwood Tomlinite• (TO) 1.295 0.7
a Maximum packing factor.
bEmpresa Nacional de Celulosas, S.Q., Madrid, Spain. cEstimated visually from photomicrographs of EU particles. dWestvaco, Chemical Division, Charleston, SC, USA. •Domtar Corporation, Cornwall, Ontario, Canada.
8 6.5 85 0.471 16 6 74 0.49
The various particulate fillers used in this study are given in Tables 3 and 4, which also list the respective properties relevant to the formulation of elastomeric sealants.
The preparation of filled formulations required two additional steps in comparison with the formulation procedure used for preparing unfilled specimens. The particulate matter was dried in a forced air oven at 105 oc for 24 hand then allowed to cool to room temperature in a desiccator. The dried matter was then dispersed in the plasticizer in appropriate proportions, using a high-speed disk dispenser operating at 5000-6000 rpm. The dispersion process continued until a uniform paste was obtained.
The amount of fillers used when compounding the various specimens was varied from 5 to 15% v/v. The mixing order for filled formulations was the same as that for
Swelling of lignin-filled PU sealant 477
unfilled ones with the exception that the dispersed phase was added, whereas in the case of unfilled fonnulations plasticizer was required.
2.3. Characterization of fillers
Fillers were chracterized in tenns of particle size and size distribution, maximum packing fraction, oil absorption, and specific gravity. An estimate of the various size filler types was established from a series of colour and monochrome photomicrographs taken with an Olympus model BHM reflected bright-field incident light microscope, using magnifications of 50x, lOOx, and 500x. The particle sizes were measured directly from the photomicrographs. The particle size distribution of particulate fillers was detennined in accordance with ASTM D3360 and ASTM D422. The method uses the sedimentation technique as a means of obtaining a particle size distribution curve.
Fillers, when incorporated in a rubbery matrix, always increase the modulus of the composite and the extent of the increase is essentially dependent on the packing char-acteristics of the filler particles [ 4]. The packing charchar-acteristics of a filler may be detennined using the methods described by Patton [5], in which the packing factor is related to the absorption of wetting liquid by a filler in the following manner:
100
Dr
¢m
=
Mッ]aセNZNMKNNNNNLQGBGBBGPBBGBBP@ ' 0.935 Drwhere ¢m is the maximum packing factor, OA is the oil absorption (g/100 g), and Dr is the density of filler (gjcm\
The technique described in ASTM D281, referred to as the spatula rubout method, is commonly used to detennine the value of OA of a given filler. In this method, the weight of linseed oil taken up by a given weight of dried filler, in sufficient quantity to fonn a required paste, provides a value of OA.
OA values were detennined for Sil-co-Sil (silica), Titanox (titanium dioxide), Tomlin-ite (hardwood Kraft lignin), Indulin AT (softwood Kraft lignin) and Eucalin (eucalyptus Kraft lignin) fillers. These results, together with the corresponding values for the max-imum packing fraction, are given in Tables 3 and 4. They are based on an average calculated from at least ten detenninations. Included in these tables are the results ( av-erage data of at least six detenninations) of the specific gravity established according to ASTM D153.
2.4. Swelling tests
Swelling tests were used to detennine the number average molecular weight between crosslinks (Mc,s) of the elastomer obtained with different fonnulations and to assess the degree of interaction between the various particulate fillers and the elastomeric matrix. It is known that a three-dimensional network of polymer chains will swell in the presence of a non-reactive solvent, in which the long chain portions (soft segments) are extended in proportion to the amount of solvent present in the polymer [6-8].
An
elastic retractive force opposes the swelling such that after a limited time of irnJ]}er-sion in the solvent (e.g. 5-10 days), the swelling reaches an equilibrium ーッゥョエᄋHlセZ[N@theory developed by Flory and Rehner [8] indicates that the molecular weight between crosslinks is inversely proportional to the elastic forces at equilibrium. This may be expressed as
( A-1 /3
u 'l'p,s 0'
Mc,s RT(o:-o:-2)'
where 8 is the density (g/cm\ Mc,s is the number average molecular weight between crosslinks (g/mol); cPp,s is the volume fraction of polymer in the swollen sample; a is the force per unit area (of the unswollen sample) required to deform the sample to the deformation ratio, o: (MPa); o: is the deformation ratio(= dh/ha); h0 is the height of
the unswollen disk (em); R is the universal gas constant (82 057 em g/K mol); and T is the absolute temperature (K).
The method adopted by Damusis et al. [9], based on the work undertaken by Cluff
et al. [10], was used to determine the elastic properties of the swollen polymer.
Cylin-drical disks [height = 12.5 mm (0.5''); diameter = 32 mm (1.25")] were swollen in toluene until equilibrium was attained, after which they were subjected to compres-sion load-deflection measurements while immersed in solvent. An Instron Universal Testing machine operating at a crosshead speed of 0.1 mm/min was used to obtain the load-deformation curve. The slope of the linear portion along the curve was used to evaluate the number of effective network chains per unit volume, ve/V, based on the equation
Ve haS 0
V 3aaRT Mc,s '
where ve/V is the number of effective network chains per unit volume; h0 is the
height of the unswollen disk (em), S is the slope of compression load-deflection curve (g/cm), a0 is the cross-sectional area of the disk (cm
2), R is the universal
gas constant (82 057 em g/K mol), T is the absolute temperature (K), 8 is the den-sity of the polymer (g/cm\ and Mc,s is the number average molecular weight between crosslinks (g/mol).
An average value of the slope obtained from three specimens was used to calculate the required data. For the different formulations used in this study, the slope of the compression load-deflection curves varied in the range of 4.73-8.32 kg/mm.
The swelling for a large number of elastomers containing reinforced fillers has been found to obey an equation of the form [11]
Vra cPf [ ( 1/3) ]
- =
1-1- - 3C 1 - Vro
+
Vro - 1 ,Vr - cPr
where Vro is Vr of the unfilled elastomer; vr is the volume fraction of elastomer in the swollen specimen; cPr is the volume fraction of filler in the filled elastomer; and C is a constant, which is characteristic of the filler (but independent of the polymer, solvent, or degree of crosslinking).
The data suggest that the restrictions in swelling depend, to a fair degree of ap-proximation, only on the filler and the extent to which an otherwise identical unfilled elastomer will swell. This further suggests that the restriction of swelling depends only on the fact that a firm bond between the elastomer and filler is established, and does not depend on the number and strength of the individual linkages.
Swelling of lignin-filled PU sealant 479
3. RESULTS AND DISCUSSION
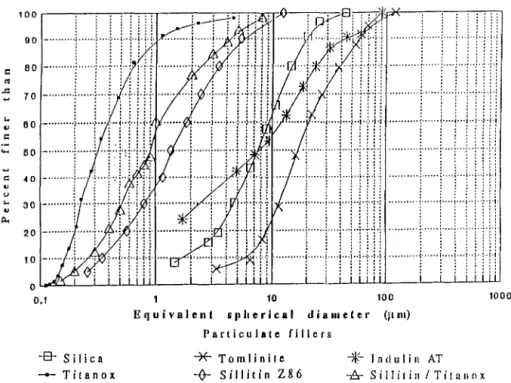
The particle size distribution cuiVes for fillers used in this study are given in Fig. 1. The cuiVes for silica, Tomlinite, and Indulin AT were obtained using the sedimentation technique. The particle size distribution for both the Titanox and Sillitin Z86 fillers were obtained from the literature (12, 13]. The cuiVe describing the particle size distribution for the Titanox-Sillitin Z86 mixture was calculated based on the particle size distribu-tion cuiVes of each component taking into consideradistribu-tion the weight ratio of components in the mixture (Titanox: Sillitin: 7 g: 22.2 g).
Based on these particle size distribution cuiVes, the average equivalent spherical di-ameter for each filler series is equal to the particle didi-ameter at the midpoint of the distribution (i.e. at 50% finer than) (Table 5).
An estimate of the specific surface area can be made based on the particle size distri-bution cuiVe according to the method developed by Gates and described by Ferrigno ( 4]. The area beneath the cuiVe represents the specific surface are. Hence the specific surface area is given by
SA=.2.(LdW),
8f Xm
where SA is the specific surface area (m2 /g), Q is a proportionality constant, d W is
the weight increment (g), 8r is the density of the filler (gjcm\ and Xm is the average particle size (JLm).
The proportionality constant is applied because the computational values are based on the areas of equivalent spheres and hence a correction must be made to take into
c <1 ..c:
...
"
c ... ., u ....,
il-< 10 0 0.1 -8- Silica _.,._ Titanox 10 100 E q u i v a I en t s p h e r I c a I d i a 111 e t e r (Jl m) Particulate fillers*
Tomlinite -(}-- Sillitin Z86 セGM I n d u I i n AT -b- Sillitin I TitanoxFigure 1. Particle size distribution curves for various fillers used in this study.
Table 5.
Particle size of fillers as detennined by the sedimentation technique
Filler Average equivalent Specific surface spherical diameter area Q (pm) (m2 /g) Titanox 0.3 10 6 Titanox/Sillitin 0.9 11.7 21 Sillitin 1.35 12 24 Silica 7.4 0.6 6 Indulin AT 8 1.5 9 Tomlinite 16.2 0.7 9 Q = Proportionality constant. Table 6.
Results from microscopic observation of filler particles
Filler type Particle shape Estimated size Estimated range average size
(pm) (pm)
Indulin AT Blocky, angular 2-40 10 Eucalin Spheroidal 6.5-15 10.5 Tomlinite Blocky, rounded 2-20 12 Sillitin Z86 Flaky, angular <1-5 2
account other particle shapes. The assumed value of Q for each of the fillers, taken from the work of Gates [14], is provided in Table 5.
The use of the photomicrographs permits an assessment of the shape and an estimate of the average size and size distribution of the various filler particles. These observations are summarized in Table 6. The observations made from the photomicrographs generally confirm the results obtained from the sedimentation analysis. Furthermore, they permit an estimate to be made of the average particle size and size distribution of Eucalin particles, which were not available during the time that the sedimentation analysis was performed.
3.1. Unfilled PU
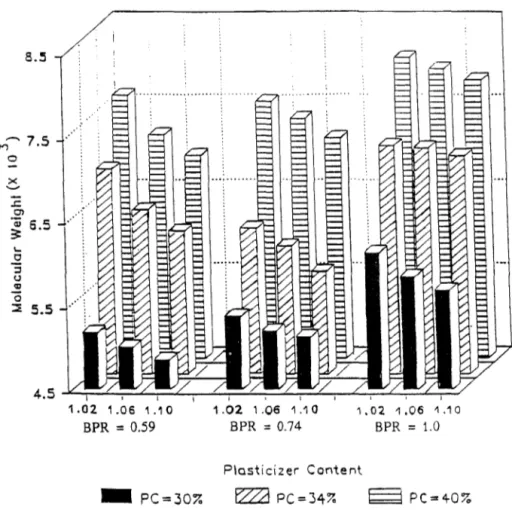
The dependence of Me, s of the unfilled formulations on the various chemical parameters
is illustrated in Fig. 2. There are three blocks of data arranged in sets of nine data points, each set corresponding to the molecular weights derived for blends having a particular BPR. Within each block, the data are arranged in order of increasing SR and PC. The SR increases from left to right, starting with a value of 1.02 and proceeding to a final value of 1.1, whereas the PC for the various blends increases from front to back of the plot.
The general trends which can be observed from this figure are as follows:
(i) Mc,s increases with the addition of both plasticizer and Baylith paste (castor oil);
and
8.5 ., ... 7.5 0 X .._, ..c: Ol セ@ 6.5 '-.2 ::l (J <D 0 セ@ 5.5
Swelling of lignin-filled PU sealant
1.02 1.06 1.10 BPR
=
0.59 1.021.06 1.10 BPR = 0.74 セNPR@ 1,061.10 BPR = 1.0 Plasticizer Content - PC=307. セ@ PC=347. セ@ PC=407. 481Figure 2. Number avernge molecular weight between cross! inks of PU elastomer fonuulations as a function
of SR, BPR and PC.
The addition of plasticizer is known to reduce the Tg of blends as a result of separat-ing macromolecular chains, decreased interaction between chains, and increased chain mobility [15]. This same effect provides an explanation for the increase in molecular weight between crosslinks with the addition of castor oil.
If it is supposed that the castor oil takes part in the reaction to form a crosslinked network, then there should be a reduction in the molecular weight between crosslinks with the addition of castor oil by virtue of the lower molecular weight between crosslinks in comparison with that of the long-chain polyol prepolymer. Since this is evidently not the case, it is supposed, then, that there is little or no reaction between castor oil and the isocyanate prepolymer, and, further, that the castor oil acts as a diluent in the same manner as the plasticizer.
The decrease in Mc,s with a corresponding increase in SR is due to the formation of
supplemental crosslinks with urea groups present in the elastomer chain. As has been noted elsewhere [6], the higher the SR, the greater the number of free isocyanate groups
M. Lacasse and D. Feldman
left for curing with other active groups, allowing the formation of additional crosslinks which occurs, for example, in the formation of biuret groups.
3.2. Filled PU
Two possibilities may occur when a filled elastomer is swollen in an appropriate solvent. The interaction between the elastomer and particulate modifier is disturbed by the action of the solvent and the bonds at their interface break down; the elastomer remains fully or partially bound to the surface of the particulate matter, even in the presence of the solvent [16].
If all bonds at the filler-elastomer interface rupture, then around each particle cavities will form which will fill with solvent. In this case, the particles do not influence (i.e. restrict) the swelling behaviour and, consequently, there is an increase in the swelling of the elastomer [16].
Table 7.
Swelling results from filled elastomers
Series Wo
w,
Wsol Vo/Vs Vro/Vr(g) (g) (g) SOAT 10.8S08 28.1203 17.269S 0.3305 0.927 ?SAT 11.2S72 27.9772 16.7200 0.34S9 0.88S 100AT 10.9SS7 26.1566 1S.2009 0.361S 0.847 12SAT 11.1439 2S.6617 14.S178 0.3762 0.814 1SOAT 11.0222 24.3839 13.3617 0.3932 0.779 50EU 11.0090 29.0187 18.0097 0.3240 0.944 7SEU 10.9848 28.2706 17.2800 0.3330 0.920 100EU 11.2793 27.78S3 16.S060 0.3493 0.877 12SEU 11.0396 26.4696 1S.4300 0.3600 0.8S1 1SOEU 11.0S22 2S.8206 14.7684 0.370 0.827 SOST 11.7268 29.4331 17.7613 0.341S 0.897 ?SST 12.4172 29.471S 17.0S43 0.3639 0.841 100ST 12.6S94 28.S41S 15.8869 0.38SO 0.79S 12SST 13.6776 29.2664 1S.S888 0.4080 0.7SO 1SOST 13.3376 26.7200 13.3824 0.4391 0.697 SOTO 10.9704 28.130S 17.1601 0.3343 0.916 75TO 11.142S 27.379S 16.2370 0.3SOO 0.874 100TO 11.4434 27.1008 15.6S74 0.3647 0.840 12STO 11.3S70 2S.S638 14.2068 0.38S8 0.794 1SOTO 11.13S1 24.3237 13.1886 0.3990 0.768 28C 10.7082 29.7648 19.0S66 0.3062 1.0
Specimens were immersed in toluene and pennitted to swell, at room temper-ature, until no significant change in weight was measured. Values provided in the table are the average of three detenninations; the value of Vro is derived from
formulation 28C. Oe = 1.103S g/cm3; Osol = 0.8669 g/cm3.
Numbers in the first column represent% vol. of filler (e.g. SO is S.O%; 7S is 7.S%, etc.). 28C
=
unfilled PU (BPR=
1.0, SR=
1.062).Swelling of lignin-filled PU sealant 483
In the case when all filler-elastomer bonds rupture, the swelling is restricted by the influence of the particles and the behaviour may be characterized by the relation derived by Kraus [11, 17, 18] (previously given) and provided below in a modified form:
!lro
]QMュHセIL@
!lr 1 - <J!f (a)
where
m
=
3C(1 -
v;d
3)
+
!lro - 1. (b) The value of m is simply the slope of the line plotted. The swelling results of filled elastomers are given in Table 7. The weight of the solvent absorbed by the speci-men, Wsoh is simply the difference between the swollen weight, Ws, and the initial weight, W0 • Following these data, it was observed that the amount of solvent absorbedby the different lignin-filled specimens is lower than the amount absorbed by the unfilled specimen (C28). The increase of lignin content led to an increase in the ratio between the polymer volume (Vo) and the solvent volume (Vs). This observation is valid for all the types of lignin tried. The volume fraction of elastomer in the solvent specimen, vr,
is given by the following relation:
1
where Oe and 0501 are the densities of the elastomer and solvent, respectively. The value
of !lro is calculated from the unfilled formulation used for preparing all the modified compounds. If a firm bond is established between the elastomer matrix and the filler, then the degree of swelling will be restrained. The slope of the straight line for each series of points establishes the extent of the restraint, and is related to the coefficient C,
which is a filler characteristic. Lipatov [16] has suggested that this coefficient can be used as a qualitative characteristic of the adhesion of the elastomer to the particulate surface.
The slopes and corresponding 'adhesion' coefficients for the four particulate modifier series are given in Table 8. The values indicate that the 'ST' series, consisting of a mixture of siliceous clay (Sillitin Z-86) and titanium dioxide (Titanox), provides the
Table 8.
Characteristic particulate filler coefficients based on swelling behaviour
Particulate filler series ST: Sillitin Z-86/Titanox TO: Tomlinite AT: Indulin AT EU: Eucalin m 1.83 1.44 1.27 1.09
c
2.58 2.18 2.01 1.82Values were calculated using Vro = 0.3062 (volume fraction of elastomer in the swollen unfilled specimen).
C is a constant which is a filler characteristic independent of the polymer, solvent, or degree of crosslinking.
greatest restraint to swelling. It is also evident that less restraint is provided by the modifiers of series TO, AT, and EU, given in order of their decreasing contribution. Although the difference between the C values is not very high, it also results that TO has the higher adhesion to the elastomer.
4. CONCLUSION
The degree of physical interaction between phases was assessed using a technique based on swelling in toluene. Interaction between the polymer and filler, as determined by swelling, is dependent on the type of filler and can be characterized by the degree of restriction to swelling which a filler imparts to the polymer matrix. Lignins are found to restrict less the degree of swelling of PU than that by the siliceous clay, titanium dioxide mixture. Hence, using this method, it is seen that lignins do not interact with the elastomer matrix to as great an extent as the Sillitin/Titanox filler mixture.
Acknowledgements
We wish to thank the Natural Sciences and Engineering Research Council (NSERC) of Canada for financial support, and Bayer Canada for providing some of the raw materials. Thanks are also extended to HOls Canada, Debro Chern Canada, NL Chern Canada, and Hottman Mineral, Germany for various ancillary products.
REFERENCES
1. D. Feldman and M. Lacasse, J. Appl. Polym. Sci. 35, 247 (1988).
2. D. Feldman and M. Lacasse, Mater. Res. Soc. Symp. Proc. 154, 265 (1989).
3. A. Natansohn, M. Lacasse, D. Banu and D. Feldman, J. Appl. Polym. Sci. 40, 899 (1990).
4. T. H. Ferrigno, in: Handbook of Fillers and Reinforcements for Plastics, H. S. Katz and V. Milewski (Eds), pp. 11-58. Van Nostrand Reinhold, New York (1978).
5. T. C. Patton, Paint Flow and Pigment Dispersion, p. 152. Intersience, New York (1964). 6. A. Damusis (Ed.), Sealants, pp. 120-121. Reinhold, New York (1967).
7. L. H. Sperling, Introduction to Physical Polymer Science. John Wiley, New York (1986). 8. P. J. Flory and J. Rehner, Jr., J. Chern. Phys. 11, 521-526 (1943).
9. A. Damusis, W. Ashe and K. C. Frisch, J. Appl. Polym. Sci. 9, 2965 (1965). 10. E. F. Cluff, E. K. Gladding and R. Pariser, J. Polym. Sci. 45, 341 (1960).
11. G. Kraus, in: Reinforcement in Elastomers, G. Kraus (Ed.), pp. 147. Interscience, New York (1965). 12. Titanox - Technical Literature, Hoffman Mineral, F. Hoffman and K. G. Sehne, Neuburg/Donau,
Gem1any (1988).
13. Sillitin - Technical Literature, NL Chem Canada Inc., Montreal (1987).
14. L. M. Beznaczuk, M. Eng. Thesis, pp. 105-109. Concordia University, Canada (1985).
15. J. H. Saunder and K. C. Frisch, Polyurethanes, Pt. 1, Chemistry, p. 326. Interscience, New York (1963). 16. Yu. S. Lipatov, Physical Chemistry of Filled Polymers, International Polymer Science and Technology,
Monograph No.2, p. 17. RAPRA, UK (1979). 17. G. Kraus, J. Appl. Polym. Sci. 7, 861 (1963). 18. J. Smallwood, J. Physique 40, 253-258 (1944).