Publisher’s version / Version de l'éditeur: Technical Report, 2005-02
READ THESE TERMS AND CONDITIONS CAREFULLY BEFORE USING THIS WEBSITE.
https://nrc-publications.canada.ca/eng/copyright
Vous avez des questions? Nous pouvons vous aider. Pour communiquer directement avec un auteur, consultez la première page de la revue dans laquelle son article a été publié afin de trouver ses coordonnées. Si vous n’arrivez pas à les repérer, communiquez avec nous à [email protected].
Questions? Contact the NRC Publications Archive team at
[email protected]. If you wish to email the authors directly, please see the first page of the publication for their contact information.
For the publisher’s version, please access the DOI link below./ Pour consulter la version de l’éditeur, utilisez le lien DOI ci-dessous.
https://doi.org/10.4224/12340901
Access and use of this website and the material on it are subject to the Terms and Conditions set forth at
Ice rubble generation for offshore production structures : Current
practices overview
Barker, Anne; Timco, Garry
https://publications-cnrc.canada.ca/fra/droits
L’accès à ce site Web et l’utilisation de son contenu sont assujettis aux conditions présentées dans le site
LISEZ CES CONDITIONS ATTENTIVEMENT AVANT D’UTILISER CE SITE WEB.
NRC Publications Record / Notice d'Archives des publications de CNRC:
https://nrc-publications.canada.ca/eng/view/object/?id=234d2d02-73c3-4f8e-a5ee-4c16b63813ef https://publications-cnrc.canada.ca/fra/voir/objet/?id=234d2d02-73c3-4f8e-a5ee-4c16b63813ef
Anne Barker and Garry Timco
TECHNICAL REPORT
CHC-TR-030
ICE RUBBLE GENERATION FOR OFFSHORE PRODUCTION STRUCTURES: CURRENT PRACTICES OVERVIEW
Anne Barker and Garry Timco
Canadian Hydraulics Centre National Research Council of Canada
Ottawa, ON K1A 0R6
Report prepared for
Climate Change Technology and Innovation Initiative Unconventional Gas Supply Program
Technical Report CHC-TR-030
ABSTRACT
Ice Rubble Generators and Ice Protection Structures (IRG and IPS, respectively), if successful, would have a major impact on the economics of an offshore production structure in the Beaufort Sea. A hybrid design of these structures has the potential to reduce ice loads by stabilizing the ice rubble surrounding offshore structures during the winter, and by providing a depth-limiting mechanism for summer ice floes. The use of a year-round passive load-reduction technology would significantly reduce the ice loads, which would result in a lower-cost structure. With lower-cost structures, this enables more timely development of frontier gas reserves. Additionally, by both lowering the loads on offshore structures and helping to control the distribution of ice surrounding such structures, the environmental integrity of the protected structure(s) may be increased, leading to increased safety for onboard personnel.
This report researches the state-of-the-art use of IRG and IPS to examine innovative technological concepts concerning these structures. The research assembles available information on protective structures that have generated rubble. The information was assembled through a literature review and discussions with national and international personnel involved in the past or at present with this type of work. The majority of structures investigated were designed for use in shallow (approximately 4 m) of water. However a number of concepts show the potential to be adapted for deeper water use. Structures specifically designed to generate rubble have focused on rubblemound berm or barge-based structures, which, although costly for deep water, appear to hold the most promise for a number of locations in the Canadian Beaufort Sea. Additionally, an arrangement of piles designed to hold back rubble or to encourage the formation of a stable ice sheet, comprised of highly loaded torsion piles, could be suitable for the Canadian Arctic. This research will provide guidance for the model test program in Year 2 of the CCTII UGS project, in terms of both concepts and physical size of the generators. The work carried out in this project may encourage the incorporation of a hybrid IRG/IPS into structurally sound design practices for the retrieval of unconventional gas supplies in the Canadian Beaufort Sea.
TABLE OF CONTENTS
ABSTRACT ... I TABLE OF CONTENTS ... II TABLE OF FIGURES ...III LIST OF TABLES ... V
1. INTRODUCTION ...1
2. ICE RUBBLE GENERATORS (IRG) ...3
2.1 Caspian Sea Piles ...3
2.2 Caspian Sea Barges ...4
2.3 Caspian Sea Piles and Barges ...5
2.4 Caspian Sea Rubble Mound Barriers ...9
3. ICE PROTECTION STRUCTURES (IPS) ...10
3.1 Pack Ice Barrier Field Test...10
3.2 Three-Legged Ice Barrier Design...11
3.3 Ice Control in Northern Harbors ...11
3.4 Lac St. Pierre Light Piers ...13
3.5 St. Lawrence River Ice Booms...15
3.6 Lac St. Pierre Artificial Islands ...17
3.7 Nome Ice Breaker Frame ...18
3.8 PND Projects...19
3.8.1 Nome Causeway ...19
3.8.2 Endicott Causeway Breach Bridge ...21
3.8.3 Kuparuk River Crossings...22
3.8.4 Oliktok Dolphins ...24
3.8.5 Spin-Fin Piles at Skagway Harbour, Alaska...25
4. RUBBLE GENERATION EXPERIENCE IN THE BEAUFORT SEA ...27
4.1 Canatec Rubble Generation Study ...27
4.2 Northstar Production Island, Alaska ...30
5. SUMMARY OF IRG/IPS DESIGNS AND BEAUFORT SEA DESIGN CONCEPTS ...33
6. ACKNOWLEDGEMENTS...36
TABLE OF FIGURES
Figure 1 Physical model set-up for Sunkar barge and protective piles (Evers et al. 2001)...3
Figure 2 Piles used for the protection of the Sunkar (Evers and Weihrauch, 2004) ...4
Figure 3 a)Example layout for barge testing (Jochmann et al, 2003) and b) barriers in place (Bastian et al, 2004)...5
Figure 4 A variety of barge and pile scenarios (Evers and Weihrauch, 2004) ...6
Figure 5 Profile of roof-structure set-up (Weihrauch et al, 2003)...7
Figure 6 Side view of roof-structure set-up (Evers and Weihrauch, 2004)...7
Figure 7 Complete roof-structure IRG (Evers and Weihrauch, 2004) ...7
Figure 8 Ice build-up and rubbling with roof-structure IRG (Evers and Weihrauch, 2004) ...8
Figure 9 Possible layout of ice barriers around a drilling platform (Evers and Weihrauch, 2004) ..8
Figure 10 Caspian Sea IRG with spray ice (Bastian et al, 2004) ...9
Figure 11 Rubblemound breakwater barrier with a mature grounded rubble field, Caspian Sea (Lengkeek et al, 2003)...9
Figure 12 a) Plan view of Pack Ice Barrier layout, and b) Pack Ice Barrier used for field test (Yamaguchi et al, 1981) ...10
Figure 13 Alternatives for deep water (a) and soft material seabed (b) (Yamaguchi et al, 1981)..11
Figure 14 Conceptual design of three-legged ice barrier (Nishizawa and Tanaka, 1988)...11
Figure 15 Hybrid Ice Trap Structure (HITS) (Inoue et al, 1988) ...12
Figure 16 a) Ice boom layout and b)connections (Saeki, 1992) ...12
Figure 17 Other boom types, connection methods and layout (from Saeki, 1992) ...12
Figure 18 Lac St. Pierre in the St. Lawrence Seaway showing the location of the two lightpiers and the navigation channel through the lake. ...13
Figure 19 Ice bustle along the Yamachiche light pier ...14
Figure 20 Yamachiche light pier in Lac St. Pierre ...14
Figure 21 Curve 1 light pier in Lac St. Pierre. ...15
Figure 22 Locations of ice booms in the St. Lawrence River (from Morse, 2001) ...16
Figure 23 Typical boom assembly (from Morse, 2001) ...16
Figure 24 Boom controlling ice in the St. Lawrence River. The location of some artificial islands (discussed in section 3.6) is also indicated (from Morse, 2001). ...17
Figure 25 Cross-section of the island breakwaters (Danys, 1975) ...18
Figure 26 Photograph of ice pile-up at artificial island No.3, in 1972 (Danys, 1975) ...18
Figure 27 Nome Ice Breaker Frame (Ettema et al, 1983)...19
Figure 28 Nome open-cell causeway...20
Figure 29 Rubble build-up at the Nome dock ...20
Figure 30 Endicott Causeway Breach Bridge...21
Figure 31 a) Close-up of conical pier and b) pier, with cover, during winter ...22
Figure 32 Kuparuk river module crossing...22
Figure 33 Kuparuk low river crossing...23
Figure 34 Kuparuk low river crossing when flooded, with broken river ice crossing over top of the bridge (photo courtesy of D. Masterson)...23
Figure 35 Kuparuk river module breaking up thick river ice ...24
Figure 36 a) Oliktok mooring dolphin in winter and b) dolphin breaking ice ...24
Figure 37 Spin-Fin pile (photo courtesy of D. Nottingham) ...26
Figure 38 Spin-Fin piles as used in torsion dolphin for Skagway Harbour, Alaska (from Nottingham, 1994)...26
Figure 39 Photograph of the CIDS spray ice barrier ...28
Figure 40 Contour map of the CIDS spray ice barrier (Jahns and Petrie, 1986) ...28
Figure 41 Ice rubble generation around the SSDC and its sprayed ice barrier...29
Figure 43 Molikpaq at Amauligak ...29
Figure 44 CRI at Kaubvik ...30
Figure 45 Molikpaq at Isserk...30
Figure 46 Northstar oil production island, Alaska (photo courtesy of PND Inc.)...31
Figure 47 Northstar island profile (from a) Summers, 2004 and b) Gadd et al. 2001) ...32
Figure 48 Northstar oil production island in new ice (photo courtesy of Coastal Frontiers Corporation) ...32 Figure 49 Hybrid IRG/IPS design concepts that may be feasible for the Canadian Beaufort Sea .35
LIST OF TABLES
Table 1 Comparison of IRG/IPS key parameters ...33 Table 2 IRG/IPS concept considerations...33
ICE RUBBLE GENERATION FOR OFFSHORE PRODUCTION STRUCTURES: CURRENT PRACTICES OVERVIEW
1. INTRODUCTION
During the exploration of the Beaufort Sea in the 1970s and 1980s, considerable attention was paid to the large accumulations of broken ice pieces (ice rubble) that often grounded around offshore structures. Controversy ensued whether ice rubble would (a) reduce ice loads (by transmitting some of the ice load to the seabed and preventing ice crushing on the face of the structure), or (b) increase ice loads by making the “structure” wider. Analysis of ice load data have shown convincingly that the rubble fields can be very beneficial for attenuating ice loads. This is an extremely important finding for future production structures in the Beaufort Sea, especially in the shear transition zone (e.g. Amauligak site). There will be a clear advantage for lower loads (and hence lower cost structures) if a stable rubble field could be generated and maintained at the structure. This technology would, in effect, provide a passive load-reduction technique. If ice crushing directly on the structure can be negated, the peak ice loads would be reduced by over 30%. To effectively use this approach, innovative technology must be developed to initiate and “pin” the ice rubble around the structure. This could be done using “Ice Rubble Generators” (IRG) - passive devices that would initiate rubble formation in selected areas and secure them throughout winter thereby shielding the structure from direct ice contact. In summer, the IRG could act as “depth-limiters” that would restrict the thickness of isolated ice floes that could hit the structure. This type of design is typically called an “Ice Protection Structure” (IPS). This could result in lower loads associated with the structure, and hence lower cost structures themselves, increasing the potential for development in this region of Canada.
The goal for this project is to determine the feasibility of using hybrid Ice Rubble Generators/Ice Protection Structures (IRG/IPS) in the Canadian Beaufort Sea, primarily in the shear transition zone. This goal will be achieved through three types of studies. In the first year of the project, the technology of IRG/IPS would be investigated through a literature review and discussions with national and international personnel to collect available information. For example, it is known that in a few temperate regions such as Japan, the Caspian Sea and the Great Lakes, IPS or IRG (either triangular frames or rock berms) have shown the ability to generate rubble and decrease loads on structures. Furthermore, the generation of ice rubble around exploration platforms in the Beaufort Sea in the 1970’s and 1980’s occurred frequently and was often encouraged through various design techniques. Information on these systems and their rubble-generating ability is documented in this report.
Based on the research conducted in the first year, design concepts for IRG/IPS in the Canadian Beaufort Sea will be developed. These concepts will be investigated for three general regions in the Beaufort: shallow water, intermediate water depths (12 to 15 m of water) and deeper water (15 m to 30 m). The preliminary concepts are presented in this report. In the second year of the project, the details of the different concepts (cost, feasibility in different water depths, engineering aspects, etc.) will be explored. In addition, detailed laboratory tests will be performed to investigate the factors that influence the stability of grounded ice rubble. CHC will be performing a PERD-Northern funded project in their ice tank to investigate the stability of grounded ice pads. The test set-up will be modified to investigate quantitatively the stability of grounded rubble in different seabeds.
In the third and fourth years, research will involve field studies that examine the rubble-generating process, including the generation and stability of ice rubble around an offshore or natural structure. The rubble-generating process would be examined in light of the most promising results from the first year design concepts and second year tests, comparing test results with field observations. It is anticipated that this will be done from the SDC in the Beaufort Sea. Discussions with Devon Canada have indicated that this should be possible when the company mobilizes the SDC drilling platform. If this is not available, field programs will be carried out to document the properties of natural rubble fields.
At the conclusion of this project, the feasibility of using a hybrid Ice Rubble Generator/Ice Protection Structure to reduce loads on drilling platforms in the Canadian Beaufort Sea will be determined.
2. ICE RUBBLE GENERATORS (IRG)
A number of investigations concerning ice barriers and their rubble-generating capacity have been carried out with respect to exploration drilling in the Caspian Sea. The ice barriers tested at the Hamburg Ship Model Basin (HSVA) were described in a number of papers (Evers et al., 2001; Weihrauch et al., 2003; Jochmann et al., 2003; Evers and Weihrauch, 2004). These structures were intended for use in the shallow water of the North Caspian Sea, generally 4 metres of water or less. While this water depth is potentially less than that in which Beaufort Sea drilling structures will be located, it is nonetheless important to examine these structures. Some of these investigations will be useful in developing design concepts for the Beaufort and, in shallow water environments, many technologies will still be applicable. All values are full scale unless otherwise noted.
2.1 Caspian Sea Piles
Evers et al. (2001) described laboratory tests that examined the original measures used to protect the drilling barge, Sunkar. The Sunkar was originally placed upon a 2 m high berm. These methods included an ice deflector that was 4 m high to prevent ice over-ride and a row of 1.6 m diameter cylindrical piles installed on the long sides of the barge. The piles were installed in order to reduce ice loads by slicing through the oncoming ice and causing ice rubble accumulation. The laboratory set-up is shown schematically in Figure 1. The tests used two different thicknesses, 0.5 m and 1.1 m, with a flexural strength of 750 kPa. Three different ice velocities were also examined.
The initial tests examined the Sunkar with neither the ice deflector nor the piles installed. Due to the Sunkar’s 45° inclined sidewalls, the ice failed in bending. During these tests ice rubble accumulated very close to the barge. Eventually, ice over-ride onto the barge occurred. The next suite of tests included the addition of the ice deflector. The deflector did prevent ice over-ride, but increased the horizontal ice load. By installing the vertical piles, ice loads on the barge were reduced significantly for the thicker ice tests. Ice rubble accumulation due to the piles was especially pronounced in the tests using the thinner ice. For the thicker ice, the ice sheet failed against both the piles and barge. Figure 2 shows the piles that had surrounded the Sunkar, with an accumulation of rubble along the short side of the barge placement area.
Figure 2 Piles used for the protection of the Sunkar (Evers and Weihrauch, 2004)
2.2 Caspian Sea Barges
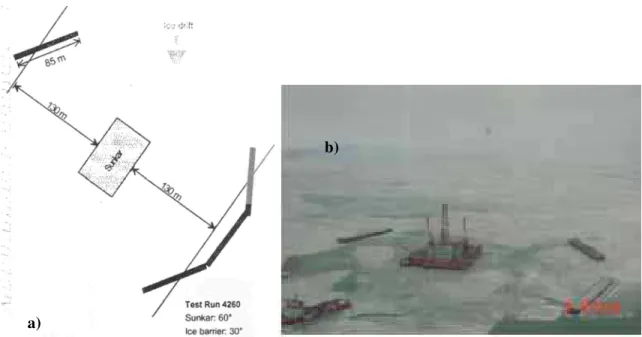
Jochmann et al. (2003) describe physical model tests performed for the Agip Kazakhstan North Caspian Operating Company. In this test series, four 85 m long barges were used as ice barriers surrounding the Sunkar drilling rig, placed in a variety of configurations and with varying ice velocity and drift angle. The ice thickness for this test series was 0.5 m or 1.3 m with a bending strength of 770 kPa. Two velocities were tested (0.5 and 1.0 m/s approximately) and five different ice drift directions. The gap width between barriers (0 m, 65 m or 85 m) and the angle of the ice barriers with respect to the rig (0°, 10°, 30°) were also varied. The distance between the rig and the barriers was 135 m. An example of one of the layouts is shown in Figure 3.
The barriers initiated ice rubble accumulation, and the stability of the Sunkar was sufficient regardless of the ice drift angle. An angle of 10° to 15° was optimal for generating rubble and protecting the structure. A significant horizontal global load reduction was obtained by using the barriers – up to 63% less. However, it was noted that an advanced ice management system could be necessary, with respect to problems with the downstream ice barriers, as the Sunkar needed to be accessed by supply vessels year-round.
Figure 3 a)Example layout for barge testing (Jochmann et al, 2003) and b) barriers in place (Bastian et al, 2004)
2.3 Caspian Sea Piles and Barges
A series of tests (Weihrauch et al, 2003; Evers and Weihrauch, 2004) investigated barriers that were designed for relatively thin ice (compared to the Beaufort Sea) of 0.1 m to 0.5 m and an ice velocity of approximately 0.5 m/s. The goal of the study was “to design modular ice barriers which catch early, thin ice, stabilize themselves by this ice and can withstand thick ice later in the ice season” (Weihrauch et al, 2003).
A number of designs were investigated, some of which are shown in Figure 4: • vertical piles in a row
• inclined piles in a row
• barge with oppositely arranged rows of vertical piles • barge with oppositely arranged rows of inclined piles (60°) • barge with closed, inclined sidewalls (60°)
• inclined piles with inclination against the ice direction • two oppositely arranged rows of inclined piles
• inclined roof structure
• barge-based barrier with a roof-structure to collect thin ice.
a)
Structure A with vertical piles
Ice drift
Inclined piles
(60°)
Structure B with inclined piles Structure C with inclinedsidewallsFigure 4 A variety of barge and pile scenarios (Evers and Weihrauch, 2004)
The conclusions from the tests were that (Weihrauch et al, 2003):
• the distance between piles should be less than 4 times the pile diameter for inclined piles and less than 6 times the pile diameter for vertical piles (larger distances only generated ice rubble after the ice had grounded), however the piles only generated rubble for thicker ice
• the piles did not prevent the ice rubble from drifting downstream and significant pile-up only occurred for small distances between piles (not efficient)
• the use of a barge encouraged earlier grounding of the ice when used with piles
• significant ride-up only occurred for the barge-based structures and the inclined roof structure
In finalizing an optimal design, the researchers decided that the barrier should have a sloping angle of less than 30°, with closed sides and at least two barriers should be placed opposite to one another to collect ice. An ice barrier based on a barge with piles, spaced at 4 times the pile diameter, that supported an inclined roof structure of pleated steel sheeting was selected as the best option. Nylon nets that had a mesh width of 0.3 m were arranged between the piles to catch rubble ice. Figure 5 through Figure 8 show this set-up. The process for generating a rubble pile with this barrier is as follows. Initially, the ice rides up onto the inclined roof structure. Caught inside the barrier arrangement, and with sufficient accumulation of ice, the ice eventually grounds and helps to stabilize the structure, increasing the vertical forces on it. Eventually, no more ice can accumulate inside the barriers, and the ice begins to pile outside of the structure. With a wide barrier, the rubble does not clear and the advancing ice sheet continues to fail against the pile. One of the advantages of the ice barrier with the inclined roof was that it would not need to be anchored to the sea bottom or have an extremely large weight to withstand ice forces, as it was designed to take into account the stabilizing nature of the ice rubble. The barrier can be arranged with a variety of angular configurations with respect to the structure to be protected, and can be placed directly at the structure if necessary (Figure 9). This type of barrier was designed to be modular and removable for the summer shipping season. It should be noted that spray ice barriers have also recently been tested for use in the Caspian Sea (Figure 10).
Barge with vertical piles (A)
Barge with inclined piles (B)
Barge with inclined sidewalls (C)
Figure 5 Profile of roof-structure set-up (Weihrauch et al, 2003)
Figure 6 Side view of roof-structure set-up (Evers and Weihrauch, 2004)
Figure 8 Ice build-up and rubbling with roof-structure IRG (Evers and Weihrauch, 2004)
Ice rubble Ice barrier
Grounded ice rubble Ice drift
Drilling platform Ice free
Ice rubble Ice barrier
Grounded ice rubble Ice drift
Drilling platform Ice rubble
Ice barrier
Grounded ice rubble Ice drift
Ice rubble Ice barrier
Grounded ice rubble Ice drift
Drilling platform Ice free
Figure 9 Possible layout of ice barriers around a drilling platform (Evers and Weihrauch, 2004)
Ice
30°
Figure 10 Caspian Sea IRG with spray ice (Bastian et al, 2004)
2.4 Caspian Sea Rubble Mound Barriers
As with the laboratory tests described previously, the rubble mound barriers described in Lengkeek et al (2003) were designed for use in the shallow waters of the Northern Caspian Sea. In this paper, a finite element modelling assessment of rubble mound barriers was carried out. A typical interaction scenario is shown in Figure 11. A number of loading scenarios were studied: thin ice interacting with a bare rock slope; thick level ice acting on grounded rubble; rafted ice acting on grounded rubble; thick ice interacting with a bare rock slope; ice acting on a frozen layer in the barrier; a pressure ridge acting on the rubble mound slope. Initially, the loading mechanism on a rubble mound structure is mainly horizontal, and the passive resistance of the barrier is proportional to the crest freeboard, up to a certain height. A rule of thumb method of determining this height was 2 times the ice thickness. It was noted that edge failure of the rubble mound structure could be acceptable if it was not progressive and did not threaten safety or the environment. The failure mechanisms for this type of structure were generally local edge failure, global sliding failure or deep sliding failure.
Figure 11 Rubblemound breakwater barrier with a mature grounded rubble field, Caspian Sea (Lengkeek et al, 2003)
3. ICE PROTECTION STRUCTURES (IPS)
The structures described in this section had a primary goal of preventing ice from contacting a structure or shoreline, rather than generating ice rubble. As such, they could be better described as ice protection structures, rather than ice rubble generators. However, rubble generation was often a secondary effect of these structures’ placement in ice environments.
3.1 Pack Ice Barrier Field Test
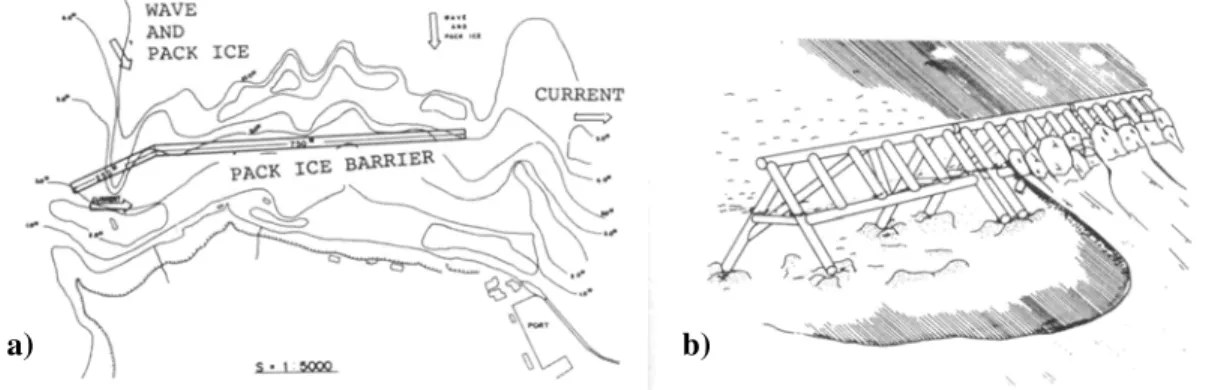
This field test of an offshore ice barrier was conducted in the Sea of Okhotsk in approximately 4 m of water (Yamaguchi et al., 1981). The tests were conducted over two winters (1979-1980), however the structures did not encounter heavy pack ice during the period of investigation. The barriers were designed by the Nitsui Engineering and Shipbuilding Company Ltd. While a number of structure designs were developed, the final design was chosen based upon “the ability to keep off pack ice, ice and wave resistance, water permeability, ease in foundation erection, and construction costs”. The layout of the barrier and the final chosen design are shown in Figure 12. The barrier was placed on a rock seabed. Two of the alternative designs, for deep water or a soft seabed material such as sand or clay, are shown in Figure 13. The pertinent design details and main features included:
• Unit barrier length of 10 m (3 units used for a total of 30 m) • Barrier width of 11.7 m
• Barrier height of 5.9 m • Barrier weight of 50 tons
• Maximum ice force (horizontal) of 16 tons and maximum wave force of 30 tons • Inclined pipes angled at 45° to reduce horizontal ice forces
• Ability to prevent pack ice passing through the structure, by spacing the pipes such that that encroaching pack ice would ride up the inclined pipes and fail in bending
• Easy installation
When pack ice encountered the structures, they formed an “effective barrier against the pack ice” and seemed to encourage the development of land-fast ice cover behind the structures. The ice behind the structures was not rubbled. Ice did not freeze to the structures due to tidal variations.
Figure 12 a) Plan view of Pack Ice Barrier layout, and b) Pack Ice Barrier used for field test (Yamaguchi et al, 1981)
Figure 13 Alternatives for deep water (a) and soft material seabed (b) (Yamaguchi et al, 1981)
3.2 Three-Legged Ice Barrier Design
Further investigation into a structure suitable for protecting shoreline areas in the Sea of Okhotsk is found in this paper by Nishizawa and Tanaka (1988). The structure that was developed was primarily made up of three inclined pipes that were filled with concrete, attached in a pyramid shape. They were designed for a high water level of 5.25 m, with a wave height of 2.5 m. The associated ice parameters were a thickness of 0.5 m, a flexural strength of 0.5 MPa, a Young’s Modulus of 500 MPa and a friction factor of 0.1 between the structure and the sea ice. The pipes were inclined at a 45° angle. The concrete within the pipes was deemed to be necessary following stress and stability analysis of the structure for ice and wave forces.
Figure 14 Conceptual design of three-legged ice barrier (Nishizawa and Tanaka, 1988)
3.3 Ice Control in Northern Harbors
Saeki (1992) summarized the methods for controlling ice in harbours, rather than the generation of ice rubble. However, the three previous papers were all discussed here. A fourth paper, that was unavailable for further examination, was mentioned (Inoue et al. 1988) in the Saeki paper. This paper described a Hybrid Ice Trap Structure (HITS) that was similar in design to the three-legged pack ice barrier described previously (Figure 15). These two structures had the design advantage of being more stable than the Yamaguchi four-legged design.
The paper points out a number of issues with respect to ice barriers, such as: • Not obstructing navigation
• Not adversely affecting drift and sedimentation along a shoreline • Keeping construction costs within a reasonable range
• In locations where waves and ice floes exist concurrently, a structure must be able to resist the simultaneous loading that may develop
• Structures constructed out of steel may have corrosion issues associated with them The paper by Saeki also contained some brief discussions concerning the use of booms for controlling ice. Some examples of layouts, types and connection methods are shown in Figure 16 and Figure 17. A further discussion concerning ice booms is presented in Section 3.5.
Figure 15 Hybrid Ice Trap Structure (HITS) (Inoue et al, 1988)
Figure 16 a) Ice boom layout and b)connections (Saeki, 1992)
Figure 17 Other boom types, connection methods and layout (from Saeki, 1992)
3.4 Lac St. Pierre Light Piers
During the winter months, the Canadian Coast Guard maintains a navigation channel along the St. Lawrence River from the Gulf of St. Lawrence to the port of Montreal to allow vessel traffic to reach Montreal year-round. Part of this route goes through Lac St. Pierre, which is a shallow lake in the Seaway. Two lightpiers (Curve 1, Yamachiche) are located within the lake to mark the boundary of the navigation channel through the lake (see Figure 18).
Yamachiche Curve #1 Lac St. Pierre
navigation channel Louisville Notre dame de Pierreville N 5 km
Figure 18 Lac St. Pierre in the St. Lawrence Seaway showing the location of the two lightpiers and the navigation channel through the lake.
The Yamachiche pier is located about 500 m south of the navigation channel in the centre of the Lake. It assists ships to align themselves (relative to adjacent light piers) for safe navigation through the channel. The Yamachiche light pier has a 75° sloped face and a waterline diameter of 4 m.
Curve1 light pier is about 10 km west of Yamachiche light pier. Unlike Yamachiche light pier, Curve1 light pier is situated directly along the navigation channel, and it is positioned to assist with navigation through the first curve that is encountered by ships approaching from Montreal. Curve1 light pier has a 45° sloped, upward-breaking face and a waterline diameter of approximately 4 m.
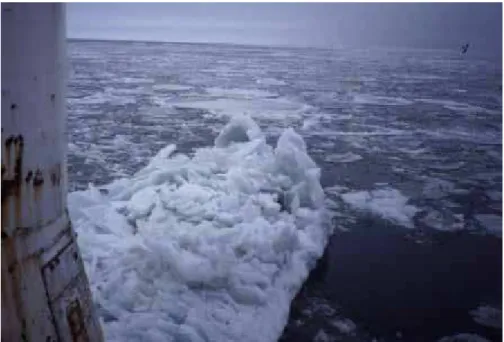
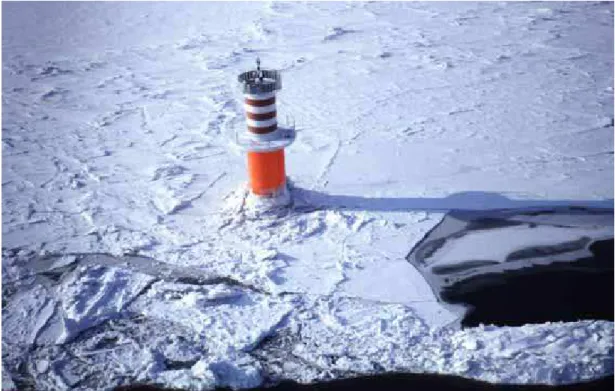
Both of these piers have sloped conical faces and consequently, ice often rides up the slopes in autumn causing pile-ups on the piers. This can result in a “bustle” of ice along one side of the pier. Figure 19 shows this ice bustle attached to the Yamachiche light pier. In general, the piers tend to hold back the ice from the navigation channel (see Figure 20 and Figure 21). Although they do not generate significant amounts of rubble, they do tend to stabilize the ice sheet from drifting into the navigation channel.
Figure 19 Ice bustle along the Yamachiche light pier
Figure 21 Curve 1 light pier in Lac St. Pierre.
3.5 St. Lawrence River Ice Booms
Ice booms have been in used in Canada for a number of years. They have been deployed, for example, in the Rideau River for controlling spring ice break-up and in the Ottawa River and Lake Erie for controlling ice in the vicinity of hydropower stations. In the St. Lawrence River, three booms were originally deployed downstream of Montreal in order to minimise the risk of ice jams in the navigation channel (Figure 22). Morse (2000, 2001) expanded on some previous studies that examined ice forces on these booms.
The booms were cylindrical steel pontoons, from 61 to 76 cm in diameter and approximately 914 cm long (Figure 23). Depending on their location, the booms were designed to encourage ice bridging or a stable ice cover between the boom and artificial and/or natural islands (discussed in the following section) and to hold back ice floes from entering the navigation channel. The incoming ice during the study generally consisted of large sheets of thin 2 to 6 cm ice, not ice rubble. The study found that the peak annual load was on average 6.4 kN/m, with a maximum line load of 10.9 kN/m. Figure 24 shows one of the booms controlling ice flow in the river.
Figure 22 Locations of ice booms in the St. Lawrence River (from Morse, 2001)
Figure 24 Boom controlling ice in the St. Lawrence River. The location of some artificial islands (discussed in section 3.6) is also indicated (from Morse, 2001).
3.6 Lac St. Pierre Artificial Islands
Lac St. Pierre often traps ice that is moving downstream in the St. Lawrence River. This causes a problem for the seaway navigation channel, which can become choked with broken ice. Four artificial islands were installed to help control ice movement by retaining an intact ice cover (Danys, 1980). The islands were designed to stop early winter small ice floes that would then freeze together and initiate the formation of a solid ice cover upstream of the island. The islands rest on a clay riverbed, in approximately four metres of water, 6 km from shore. The footprints of the islands ranged from 45 m to 80 m with an above-water width of 10 m. Three of the islands were built to a height of one metre higher than the winter high water level (4.8 m), while the fourth island, designed to accommodate a light pier, came to 3.7 m higher than this water level (Figure 25).
The island with the light pier was designed as a berm structure to minimize ice ride-up, and proved to be very effective in generating large ice pile-ups that did not impinge on the light pier structure (Figure 26). The remaining islands were not designed as berms and initially no armour stone was placed on the slopes of the structures. This was amended two years later, as the quarry-run rock was insufficient for resisting both waves and ice action, and the islands were redesigned with a berm configuration. The islands required continuous maintenance work due to the large volumes of moving ice and primarily due to strong waves and to swell generated by passing ships. Due to the clay seabed, the islands experienced a great deal of settlement after ten years – in some places, double the predicted settlement of 1.2 m for the island with the light pier, and even larger for the other three islands. Overall, while the islands were effective in holding back the ice and creating a stable ice cover, they were only economical in shallow water due to the poor clay foundation and the necessary design to accommodate this.
Figure 25 Cross-section of the island breakwaters (Danys, 1975)
Figure 26 Photograph of ice pile-up at artificial island No.3, in 1972 (Danys, 1980)
3.7 Nome Ice Breaker Frame
Ettema et al (1983) also described a method that was developed to prevent sea ice from interacting with a harbour structure in Nome, Alaska. This involved an offshore barrier placed around the port. The barrier was designed such that while it would be able to withstand wave attack, it would also not aggravate wave attack on the port. The purpose of the “ice breaker frames” was to limit ice over-ride, by fracturing an incoming ice sheet. An example of the frame design is shown in Figure 27. The design water depth was approximately 6 m. The spacing of the frames was a function of their distance from the structure, with a greater offshore distance allowing a larger spacing between the frames. The frames had to be “well anchored to the sea bed in order to resist both uplift forces that can be imposed when they are frozen to a rising ice sheet during water-level change, and overturning moments due to horizontal ice loads.” For a 0.9 m thick ice sheet with flexural strengths between 0.50 and 0.65 MPa (73 to 94 psi), peak horizontal loads of 1.3 to 1.8 MN (300 to 400 kips) were measured on a modelled frame, with peak uplift forces of 22 to 27 MN (5000 to 6000 kips).
Figure 27 Nome Ice Breaker Frame (Ettema et al, 1983)
3.8 PND Projects
A number of Alaskan projects carried out by PND Inc. (D. Nottingham, personal communication) have involved a variety of techniques to break-up incoming ice floes. Some of the most applicable techniques are briefly described here. All photographs in this section are courtesy of PND Inc. unless otherwise noted.
3.8.1 Nome Causeway
A causeway in Nome, Alaska was built to link to an offshore terminal in the early 1980’s (Ettema et al, 1983). The as-built causeway is shown in Figure 28. It extends approximately 1 km offshore. The causeway was studied to investigate ice-sheet and ice-ridge interaction, the stability of the structure, the likelihood of ice over-ride, ice loads and ice protection systems. In 1991, PND Inc. was hired to design a dock for the facility. The resulting earth-filled, open cell sheet pile dock is approximately 61 m long and 67 m wide. The structure was designed to be overridden by seas ice floes of up to 1.2 m thick. From personal communication with PND, the following description of the dock’s performance in ice was obtained: “In the spring of 2004 an ice run at the Nome causeway exposed two open cell docks to severe ice forces. Ice thicknesses at Nome typically reach four feet at this time. No damage to the open cells was found following inspection except some large diameter fender piles on the City Dock were bent.” An example of rubble pile-up at the structure is shown in Figure 29.
Figure 28 Nome open-cell causeway
3.8.2 Endicott Causeway Breach Bridge
This bridge, owned by BP Exploration (Alaska), is used for providing access for oil field service traffic and also supports the Endicott oil field pipeline. The overall bridge length is 213 m, with a 198 m breach opening contained within this length (Figure 30). The breach opening in the causeway bridge was designed in order to accommodate fish passage along the Alaskan North Slope shoreline. The high water velocities through these openings can cause scour in the order of 9 m in a single storm and sea ice applies major forces to the foundations.
The bridge is supported by piles and has two conical piers. These piers have bevelled sides to reduce ice forces. The piles within the piers consist of six 0.76 m-diameter steel pipe piles that are covered by a pier cap. The cap has top and bottom plates, radial stiffeners and face plates to make the cap rigid enough to withstand ice forces. Over this cap is an outside steel cone. The piers are designed for a maximum ice force of 2.5 MN (250 tons) horizontal (design ice load of 2.2 MN (500 kips)). Figure 31 shows one of the conical piers during construction and with its cap and cover in winter.
Figure 31 a) Close-up of conical pier and b) pier, with cover, during winter
3.8.3 Kuparuk River Crossings
These bridges cross two river channels in a flood plain along the Alaskan North Slope (Figure 32 and Figure 33). They are owned by Phillips Petroleum Company. They were designed to be submersible during flood events (Figure 34) and to be able to carry large vehicle weights. River ice in the area can be 1.5 m thick. Figure 35 shows this thick, strong ice impacting with one of the bridges.
Figure 32 Kuparuk river module crossing
Figure 33 Kuparuk low river crossing
Figure 34 Kuparuk low river crossing when flooded, with broken river ice crossing over top of the bridge (photo courtesy of D. Masterson)
Figure 35 Kuparuk river module breaking up thick river ice
3.8.4 Oliktok Dolphins
The PND Oliktok dolphins were designed for offshore mooring, and are capable of resisting forces generated from ice sheets that are up to 1.8 m thick. A dolphin and the effects of its ice-breaking are shown in Figure 36.
Figure 36 a) Oliktok mooring dolphin in winter and b) dolphin breaking ice
3.8.5 Spin-Fin Piles at Skagway Harbour, Alaska
PND spin-fin piles were developed by PND in the mid-1980s and have been used for a variety of structures and soil conditions (Nottingham, 1994). These piles have steel fins welded onto the bottom of the pile and were designed to resist high loads (over 100 tons). An example of a spin-fin pile is shown in Figure 37. The piles are suitable for use where anticipated uplift loads would normally cause pile failure. Through their use of such piles, PND have found them to be a more predictable and reliable tension pile and an economical option for driven pile foundations. One of the main criteria for their use is the need to define what the tolerable deformation is for a given scenario.
Another advantage to this type of pile is that they allow substantial pile movement without catastrophic failure. An example of the ability of such piles to resist high impact loads even though deformation has occurred was given in Nottingham (1994) and in an accompanying video recording. The paper describes a 35 100 ton-displacement, 245 m tour ship at Skagway, Alaska being pushed into the terminal dock by wind. The approach velocity of ship was approximately 0.18 m/s and the estimated contact energy was 59 ton-m. This event severely damaged or destroyed two of the steel pile dolphin moorings (12 and 6 piles, respectively) along the dock. Another dolphin, constructed using spin-fin piles, stopped the ship. It was estimated that a light-duty outer fender absorbed approximately 14 ton-m prior to collapse, with the remaining energy absorbed by movement of the dolphin. The spin-fin pile dolphin (whose configuration is shown in Figure 38) had 20 cm of horizontal movement and 10 cm of pullout movement for the main pile. The ultimate tensile load was calculated to be 299 tons or 67 kPa average shaft friction. This scenario would also be comparable to a summer ice floe impacting a pile-based IRG/IPS surrounding an offshore platform. In this case, it would be desirable to slow down the floe’s velocity, while not necessarily attempting to stop it completely. A pile-based structure would aid in energy absorption thereby protecting the platform from the full-impact of the floe. Deformation of the piles to a certain extent would be acceptable, as unless critical failure had occurred, the piles could be re-driven if need be at a later time.
Figure 37 Spin-Fin pile (photo courtesy of D. Nottingham)
Figure 38 Spin-Fin piles as used in torsion dolphin for Skagway Harbour, Alaska (from Nottingham, 1994)
4. RUBBLE GENERATION EXPERIENCE IN THE BEAUFORT SEA
4.1 Canatec Rubble Generation Study
A comprehensive report by Canatec Consultants Ltd. (1994) reviewed rubble pile-up events that occurred in the Arctic. The primary focus was on stable, grounded rubble fields that surrounded bottom-founded structures or natural features. Many of the rubble piles were generated by ice interacting with the berms that a number of exploration platforms were built upon. Nineteen sites were examined out of thirty-one possible locations that had sufficient detail to warrant examination. Note that a site does not necessarily mean a different location, but could refer to a site that had rubble build-up in more than one year – each year is referred to as a site. Rubble field observations and key dates were described for thirteen rubble pile sites. A further four sites were studied on an event-by-event basis.
The structures studied were divided into five categories: • artificial islands (48 sites)
• shallow caissons/ice structures (7 sites; founded on berms/foundations within 7 m of sea level)
• intermediate caissons (9 sites; founded on berms/foundations from 7 to 15 m below sea level)
• deep caissons (6 sites; founded on berms/foundations 15 m or more below sea level) • natural rubble formations (7 sites; natural shoals, remnant berms, islands)
Note, however, that the total water depth at the caisson sites could be much larger than the water depth at the berm height. For example, the range of water depths for the shallow caissons ranged from 3 to 19 m; for intermediate, 10 to 30 m; for deep caissons, 15 to 27 m. The water depth for the artificial islands ranged from 1 to 29 m. The artificial islands were either sandbag retained, hauled, sacrificial beach (Canadian sites) or gravel (US sites). The shallow caissons were mainly spray ice structures, with a concrete caisson used at two sites. The intermediate caisson locations involved the SSDC, Molikpaq or CRI caissons, while the deep locations used the CIDS or the Molikpaq.
Some examples of the structures investigated are shown in Figure 39 through Figure 44. Important observations from this report included:
• 90% of the rubble pile-ups occurred for ice that was less than 0.8 m thick, with a median thickness of 0.3 m.
• Most pile-ups occurred before January 1.
• The ratio of keel depth to sail height was generally less than 4:1 where keel depth was limited by water depth.
• The greatest rubble-building efficiency occurred in water depths of 8 to 14 m and where the apex angle of the obstruction was large.
• Rubble-building efficiency also appeared to coincide with ice drift directions of 180° to 300° (dominant south west drift direction), and there was an inverse relationship between efficiency and ice drift speed.
Figure 39 Photograph of the CIDS spray ice barrier
Figure 41 Ice rubble generation around the SSDC and its sprayed ice barrier
Figure 42 Issungnak
Figure 44 CRI at Kaubvik
Figure 45 Molikpaq at Isserk
4.2 Northstar Production Island, Alaska
The BP Exploration (Alaska)’s Northstar oil production island is located in 12 m of water, 10 km offshore in the U.S. Beaufort Sea (Figure 46). Gadd et al. (2001) reported that ice conditions in the area are primarily first year, land-fast ice, with a maximum thickness of 2 m. Multi-year ice is occasionally present. The open water season is generally from mid-July through October, with some pack ice during this period. Due to these ice conditions, the main ice-related design issues involved dealing with the pile-up of first year ice and impacts from multi-year floes with keels up to 12 m.
Large quarry stone was not available for use as slope protection on the island. As a result, a modular, linked concrete mat system was used as ice-resistant slope protection. This mat was overlaid upon a berm-shaped gravel island, designed to resist both wave run-up and ice pile-up. The shape was chosen to reduce ice ride-up, by encouraging bending failure at the change of slope and ice jamming. The shape also allows for the accumulation of ice rubble, as indicated in Figure 47. Figure 48 shows the Northstar Island in new ice.
Figure 47 Northstar island profile (from a) Summers, 2004 and b) Gadd et al. 2001)
Figure 48 Northstar oil production island in new ice (photo courtesy of Coastal Frontiers Corporation)
a)
5. SUMMARY OF IRG/IPS DESIGNS AND BEAUFORT SEA DESIGN CONCEPTS
It is clear that some of the structures described in the previous sections are more applicable to the Beaufort Sea than others. Table 1 summarizes some of the key features of the structures presented in this report with respect to this applicability. Of course, there are many factors besides those listed in Table 1 that need to be considered in order to develop IRG/IPS concepts that would be suitable for the Beaufort Sea. Some of these are indicated in Table 2.
Table 1 Comparison of IRG/IPS key parameters
Applicable water depth*?
Generate grounded rubble? Slow/stop summer floes? Presently in use as IRG/IPS? IRG
Barges Shallow/intermediate/deep Yes Maybe Yes
Piles and Barges Shallow/intermediate/deep Yes Maybe Yes
Rubble Mound Barriers Shallow/intermediate/deep Yes Yes No
Berm Production Platform Shallow/intermediate/deep Yes Yes Yes
IPS
4-Legged Barrier Shallow Maybe No Yes?
3-Legged Barrier Shallow Maybe No No?
Ice Booms Shallow No Maybe Yes
Ice Breaker Frame Shallow Maybe No No?
Piles as piers or dolphins Shallow/intermediate Maybe Maybe Yes
*disregarding cost
Table 2 IRG/IPS concept considerations
Factor Considerations
Construction Logistics
Is the support infrastructure (access vehicles, heavy machinery, supply vessels) available in the Arctic for the development of the concept? Are the required supplies (fill, piles, concrete)
accessible? What environmental constraints are there with respect to construction timing?
EER Logistics
How will the concept affect EER logistics, such as vessel access, lifeboat manoeuvrability or location of EER facilities on the platform?
Maintenance
What type of upkeep will the IRG/IPS require over the lifetime of the platform? What actions would be necessary if an allowable amount of failure occurs?
Supply access Is there access for supply vessels throughout year?
Cost A concept may be feasible for a certain location, but be cost
prohibitive.
Seasonality Is the concept reliant upon a technology that is seasonally
Of the structures examined, three stand out as those that would seem to be suitable to function as a hybrid IRG/IPS: a berm design; rubble mound (berm) barriers/submerged barges (such as concrete caissons); or piles.
For the latter, the scenario of the cruise ship that ran into the spin-fin dolphins could be comparable to a summer ice floe impacting a pile-based IRG/IPS surrounding an offshore platform. A system of high torsion piles placed in strategic locations around a production platform, based on the Spin-Fin piles described previously could be feasible. In this case, it would be desirable to slow down the floe’s velocity, while not necessarily attempting to stop it completely. A pile-based structure would aid in energy absorption thereby protecting the platform from the full-impact of the floe. Deformation of the piles to a certain extent would be acceptable, as the piles could be re-driven if need be at a later time, unless critical failure had occurred. Whether such piles would generate sufficient rubble throughout the winter to dissipate loads on a platform would need to be investigated.
A rubble mound barrier (possibly with a berm configuration) or a submerged barge would both have the ability to generate rubble throughout the winter, while also providing a depth-limiting factor for summer ice floes. Most IPS that are in use today do not appear to have the necessary strength and stability required to withstand the impacts of summer ice floes. While many IPS have generated rubble in the field, their ability to do so in deeper water and on a regular basis may not match the capabilities of typical IRG configurations, such as a rubble mound barrier or submerged barge.
A production platform that is based on a berm design would appear to have the most potential for use in the Beaufort Sea. Its range of water depths, ability to generate rubble, slow down summer floes and extensive use in the past (and present) all lead to this conclusion.
These three design concepts are sketched in Figure 49. In the second year of the project, the details of the different concepts will be explored. This will involve investigating the three design concepts for three locations (and conditions) in the Canadian Beaufort Sea. These general locations will be:
• Landfast ice (10 m water depth) • Transition ice (20 m water depth) • Active ice (30 m water depth)
Each of the design concepts will be examined in light of their placement in each location. The factors described in Table 1 and Table 2 will be applied to each scenario (e.g. feasibility in different water depths, engineering aspects, cost, etc.).
Submarine concrete barriers
Production platform 150 m each side
Submarine concrete barriers
Production platform 150 m each side Shipping entrance Dolphins made of Spin-Fin Piles Production platform 150 m each side Plan Profile Berm structure with
wave/ice slope protection
Figure 49 Hybrid IRG/IPS design concepts that may be feasible for the Canadian Beaufort Sea
6. ACKNOWLEDGEMENTS
The authors would like to thank D. Nottingham, I. Martin, C. Leidersdorf, A. Weihrauch and K. Evers for their contributions towards this report. The financial support of the Climate Change Technology and Innovation Initiative, Unconventional Gas Supply Program (CCTII - UGS) is gratefully acknowledged.
7. REFERENCES
Bastian, J., Standberg, A.G., Graham, W.P. and Mayne, D. (2004) Caspian Sea Sprayed Ice Protection Structures. Proceedings of the 17th International Symposium on Ice, International Association of Hydraulic Engineering and Research (IAHR’04) Vol.2, pp.58-67, St. Petersburg,
CIS.
Canatec Consultants Ltd. (1994) Study of Ice Rubble Formation in the Beaufort Sea. Report prepared for the National Energy Board of Canada, Mobil Research and Development Corporation and Gulf Canada Resources Ltd. Calgary, Canada.
Danys, J.V. (1980) Artificial Islands in Lac St. Pierre to Control Ice Movement. Proceedings of
the 1st Canadian Conference on Marine Geotechnical Engineering, pp. 366-379, Calgary,
Canada.
Danys, J.V. (1975) Ice Movement Control by the Artificial Islands in Lac St. Pierre. Proceedings
of the 3rd International Symposium on Ice, International Association of Hydraulic Engineering and Research (IAHR’75), pp. 81-91, Hanover, U.S.A.
Ettema, R., Kennedy, J. and Horton, M. (1983) Ice Study for the Port Development at Nome, Alaska. Proceedings of the 7th International Conference on Port and Ocean Engineering under Arctic Conditions (POAC’83), Volume 2, pp. 865-874, Espoo, Finland.
Evers, K. and Weihrauch, A. (2004) Design and model testing of ice barriers for protection of offshore structures in shallow waters during winter. Proceedings of the 17th International Symposium on Ice, International Association of Hydraulic Engineering and Research (IAHR’04)
Vol. 2, pp.124-131, St. Petersburg, CIS.
Evers, K., Spring, W., Foulkes, J., Kuehnlein, W., and Jochmann, P. (2001) Ice model testing of an exploration platform for shallow waters in the North Caspian Sea. Proceedings of the 16th
International Conference on Port and Ocean Engineering under Arctic Conditions (POAC’01)
Vol. 1, pp.255-264, Ottawa, Canada.
Gadd, P.E., Hearon, G., Leidersdorf, C.B., McDougal, W.G., Ellsworth, J. and Thomas, D. (2001) Slope armor design and construction Northstar production island. Proceedings of the 16th
International Conference on Port and Ocean Engineering under Arctic Conditions (POAC’01)
Vol. 1, pp.99-107, Ottawa, Canada.
Inoue, K., Ohnuma, Y. and Tatsuta, M. (1988) Design method of hybrid ice trap structure (HITS). Proceedings of the 7th Cold Region Technology Conference, p.299-304.
Jahns, H.O. and Petrie, D.H. (1988) CIDS Spray Ice Barrier. Proceedings of the 18th Offshore Technology Conference (OTC’86), OTC 5290, pp. 575-584, Houston, U.S.A.
Jochmann, P., Evers, K. and Kuehnlein, W.L. (2003) Model testing of ice barriers used for reduction of design ice loads. Proceedings of the 22nd International Conference on Offshore Mechanics and Arctic Engineering (OMAE’03), OMAE2003-37385, pp.815-821, Cancun,
Lengkeek, H.J., Croasdale, K.R. and Metge, M. (2003) Proceedings of the 22nd International Conference on Offshore Mechanics and Arctic Engineering (OMAE’03), OMAE2003-37411,
pp.831-837, Cancun, Mexico.
Morse, B. (2001) Dynamics of Ice Forces on Booms. Cold Regions Science and Technology. Volume 33 pp.29–43.
Nishizawa, S. and Tanaka, S. (1988) Structural Design of New Type Three Legged Ice Barrier.
Proceedings of the 9th International Symposium on Ice, International Association of Hydraulic Engineering and Research (IAHR’88), Volume 1, pp. 591-600, Sapporo, Japan.
Nottingham, D. (1994) Spin-Fin Pile Performance. Proceedings from the U.S. FHWA
International Conference on Design and Construction of Deep Foundations, pp. , Orlando,
U.S.A.
Polar Alpine Inc. (1988) Evaluation of the Spray Ice Barrier at the CIDS Antares Site During 1985 Using Timelapse Photography. Report prepared for Exxon Production Research Company. Berkeley, U.S.A.
Saeki, H. (1992) Ice Control in Northern Harbors. Proceedings of the 11th International Symposium on Ice, International Association of Hydraulic Engineering and Research (IAHR’92),
Volume 3, pp. 1211-1241, Banff, Canada.
Summers, S. M. (2004) Operational and start-up experiences for the first arctic offshore island facility, BP Northstar project. Proceedings of the 23rd International Conference on Offshore Mechanics and Arctic Engineering (OMAE’04), OMAE2004-51374, Vancouver, Canada.
Weihrauch, A., Berger, J. and Bartels, M. (2003) Design of self-stabilzing ice barrier.
Proceedings of the 22nd International Conference on Offshore Mechanics and Arctic Engineering (OMAE’03), OMAE2003-37163, Cancun, Mexico.
Yamaguchi, T., Yohida, H, Yashima, N and Ando, M. (1981) Field Test Study of “Pack Ice Barrier”. Proceedings of the 6th International Conference on Port and Ocean Engineering under Arctic Conditions (POAC’81), Volume 1, pp. 313-322, Quebec City, Canada.