Applications of Automatic Vehicle Location Systems Towards Improving Service Reliability and Operations Planning in London
by
Joseph Emanuel Ehrlich
Bachelor of Engineering, Civil Engineering, McGill University, 2008
Submitted to the Department of Civil and Environmental Engineering
ARCHI
in partial fulfillment of the requirements for the degree of MASSACHUSETTS OF TECHNOL Master of Science in TransportationJUL 15 2
at theMassachusetts Institute of Technology
LIBRARI
June 2010
@2010 Massachusetts Institute of Technology. All rights reserved.
Signature of A uthor... . ...
Deartf ent of Civil and Environmental Engineering May 24, 2010
Certified by... ...
Nigel H. M. Wilson Professor of Civil and Environmental Engineering Thesis Snervisor Certified by...
John P. Attanucci Research te of Civil and Environm 1 Engineering /,-,""Thesis Suoervisor A ccepted by.... ... ... ...
Daniele Veneziano Chairman, Departmental Committee for Graduate Students
NES
INSTITUTE
OGY
010
ES
Applications of Automatic Vehicle Location Systems Towards Improving Service Reliability and Operations Planning in London
by
Joseph Emanuel Ehrlich
Submitted to the Department of Civil and Environmental Engineering on May 24, 2010 in Partial Fulfillment of the Requirements for the Degree of
Master of Science in Transportation ABSTRACT
Technological advances in the transit industry, such as the introduction of Automatic Vehicle Location (AVL) systems, have provided agencies with robust data collection and measurement systems and enabled the development of comprehensive planning and operations tools. This thesis reviews the impact of an AVL installation in London, and demonstrates how data recorded by this system may be used to improve service reliability and operations planning on the London bus network. In particular, this thesis focuses on capabilities which would have been impossible prior to the installation of AVL.
Service reliability has traditionally been measured from an operations perspective despite a major objective of the transit agency being to provide high quality service to passengers. A framework for a service reliability analysis is developed which explores new passenger-centric measures used to describe the quality of transit service, which are measured with AVL data. First, an analysis of trends in service reliability and factors that contribute to service reliability is performed in order to gain a better
understanding of the environment in which transit services are operated. Three new passenger-centric measures of reliability are then introduced which describe the entire bus passenger experience. These measures are evaluated for a set of origin/destination pairs on six bus routes, and the differences in the perception of reliability between the new measures and the traditional measures are identified. The analysis demonstrates that while the traditional measures of reliability are relevant, the new measures provide additional insight. Recommendations are made with regard to implementing these new measures, providing better passenger journey information by applying these measures, and improving service control practices by monitoring these measures.
AVL data provides for the development of more robust operations plans since these data allow for a greater degree of accuracy when measuring point to point running times. A framework is presented for how running times measured with AVL may be used to assess the efficacy of current operations plans and aid operations planners in vehicle scheduling. Recommendations are made with regards to how AVL data should be used to evaluate the effectiveness of existing schedules and develop more robust schedules. Thesis Supervisor: Nigel H. M. Wilson
Title: Professor of Civil and Environmental Engineering Thesis Supervisor: John P. Attanucci
Acknowledgments
I would like to thank my advisors, Prof. Nigel Wilson and John Attanucci, for many interesting
discussions, challenging the way I think, and providing me with much advice during the composition of this thesis. Rabi Mishalani, of the Ohio State University, also greatly helped me develop my research at MIT. A special thanks to Ginny Siggia, who keeps the Transit Research Program at MIT running.
Thank you to my colleagues at TfL, especially Nigel Hardy, who went above and beyond the call of duty to ensure that I had the proper tools with which to carry out this research. Other people at TfL who were of great help included Rosa McShane, Chris Fowler, Steve Robinson, Nathan Phillips, Tom Smith, Janet Brown, and Helene Bataille.
This degree represents the culmination of many years of education, and while I would like to thank everyone who has aided me and inspired me along the way, there is insufficient space to do so. However, I would like to thank the following people in particular:
- Jared, Candy, Liz, Winnie, Val, Tony, Julian, Harvey, Andre, DCBS, Andrew, Jay, Al, Sam, Caroline, Joe and Nihit, my colleagues, classmates, and friends at MIT who have made the past two years a joy. Mike Frumin's contributions were immeasurable and would warrant many pages. - Tina, Bailey, Ellen, Jess, Devon, and Zach, my dear friends and colleagues from McGill whose
friendship, strong work ethic, inspiration, and support I will never forget.
- Numerous teachers who have inspired me along the way and shown me the value of a good education.
- Most importantly, my parents, Carl Ehrlich and Michal Shekel, my brother, Shimi, and my grandparents, Oma, Opa, Saba, and Savta (z"l), who have always believed in me and let me follow my dreams to the best of my abilities. Without the examples you have set for me in my life and your encouragement along the way, none of this would have been possible.
Table of Contents
List of Figures ... 11 L ist o f T ab le s ... 12 1 In tro d u ctio n ... 13 1.1 M otivation ... 13 1.2 Objectives... 15 1.3 Research Approach ... 15 1.4 Thesis Organization ... 17 2 Literature Review ... 182.1 Using AVL Data for Analysis... 18
2.2 M easures of Service Reliability ... 19
2.2.1 W ait Tim e...20
2.2.2 Excess W aiting Tim e ... 21
2.2.3 In-vehicle Travel Tim e... 22
2.2.4 Journey Tim e...22
2.2.5 Excess Journey Tim e and Reliability Buffer Tim e ... 23
2.3 Operations Planning ... 24
2.4 Service Control...27
2.5 AVL Case Study: Portland, Oregon, USA ... 36
2.6 Sum m ary of Prior W ork/Applicability to Current Study ... 38
3 Bus Service in London...40
3.1 Transport for London and London Buses ... 40
3.1.1 Congestion Charging... 40
3.1.2 Oyster Card ... 41
3.1.3 London Buses...42
3.2 iBus and AVL on London Buses... 46
4 Factors Affecting Service Reliability ... 50 7
4.1 Reliability M easures Used by London Buses...50
4.1.1 Excess W aiting Tim e ... 51
4.1.2 Percent On-Tim e ... 53
4.1.3 Percent Lost M ileage... 54
4.1.4 Other M easures of Reliability ... 55
4.2 Trends in EW T over the Past Decade ... 55
4.3 Factors affecting Reliability ... 59
4.3.1 Reliability - Dependent Variable... 62
4.3.2 Operator Attributes...62 4.3.3 Garage Attributes ... 63 4.3.4 Route Attributes ... 63 4.3.5 Ridership Attributes ... 64 4.3.6 Background Attributes ... 64 4.3.7 Technological Attributes... 66 4.3.8 Contract Attributes ... 67 4.3.9 W orks...67 4.3.10 iBus ... 67
4.3.11 Data Specifications and Lim itations ... 67
4.4 Quantifying the Influence of Service Reliability Factors... 68
4.4.1 Correlation Analysis...68
4.4.2 Regression M odels... 71
4.4.3 Model 1: Variables with High Correlation with AWT/SWT and Other Variables Deemed Im portant...72
4.4.4 M odel 2: Accounting for Seasonality and Operator Behavior ... 74
4.4.5 Sum m ary of Regression Analysis ... 77
4.5 Sum m ary ... 77
5 Service Reliability M easurem ents using AVL Data ... 79
5.1 Passenger Focused M easures of Reliability... 80
5.1.1 Com ponents of Bus Journey Tim e... 81
5.1.2 Journey Tim e...83
5.1.3 Excess Journey Tim e and Reliability Buffer Tim e ... 87
5.2 iBus Data...88
5.2.1 D ata Form at...88
5.2.2 M issing D ata...89
5.2.3 Im putation...92
5.2.4 Im plications for London Bus Operations... 93
5.3 M ethodology ... 94 5.4 Analysis...97 5.4.1 Selection of OD Pairs... .... 98 5.4.2 Route 38 ... 99 5.4.3 Route 98 ... 103 5.4.4 Route 148 ... 107 5.4.5 Route 88 ... 111 5.4.6 Route 211 ... 114 5.4.7 Route 259... 117
5.4.8 Observations on the Reliability Analysis... 121
5.4.9 Service Control...123
5.5 Sum m ary and Recom m endations...123
6 Applications of AVL D ata for Operations Planning ... 129
6.1 Operations Planning... 130
6.1.1 Estim ating Running and Cycle Tim es... 131
6.1.2 Operations Planning and London Buses ... 133
6.2 Data... ... 134
6.2.2 Caesar... 134
6.3 M ethodology ... 135
6.4 Analysis... 136
6.4.1 Route 98 ... 138
6.4.2 Route 259 ... 143
6.4.3 Segm ent Analysis... 147
6.5 Sum m ary ... 149
7 Conclusions and Recom m endations...151
7.1 Service Reliability ... 151
7.1.1 Recom m endations and Future W ork...153
7.2 Operations Planning ... 154
7.2.1 Recom m endations and Future work...155
Appendix 1 - Potential Variables Used in Regression Analysis... 157
Bibliography ... 163
List of Figures
Figure 2-1 - R eliability B uffer Tim e ... 24
Figure 2-2 -The Bus Planning Process ... 25
Figure 2-3 -A Schematic of Bus Route Operations... 29
Figure 2-4 - Evolution of the System over Time ... 29
Figure 2-5 -Service Delivery as a Business Process ... 34
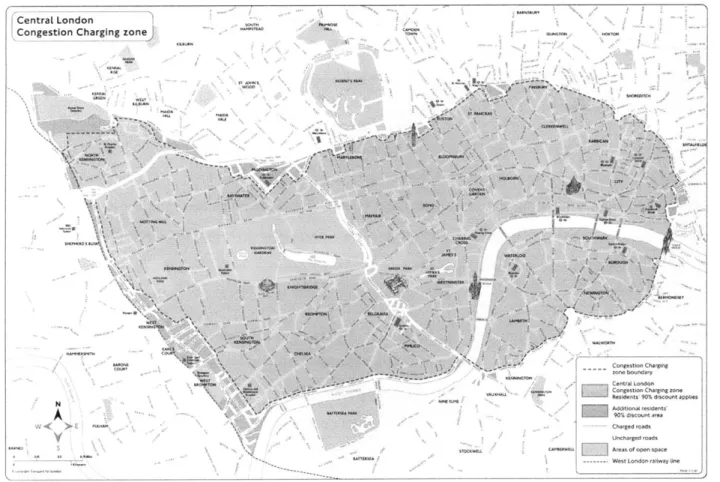
Figure 3-1 -Central London Congestion Charging Zone ... 41
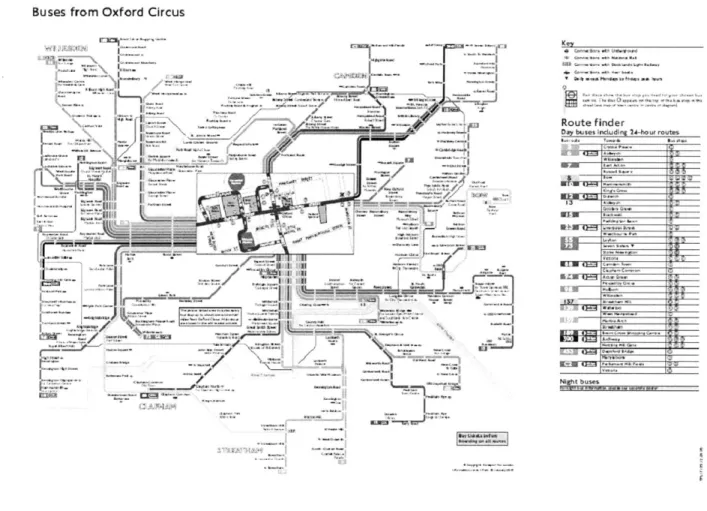
Figure 3-2 - Oxford Circus Bus Routes ... 43
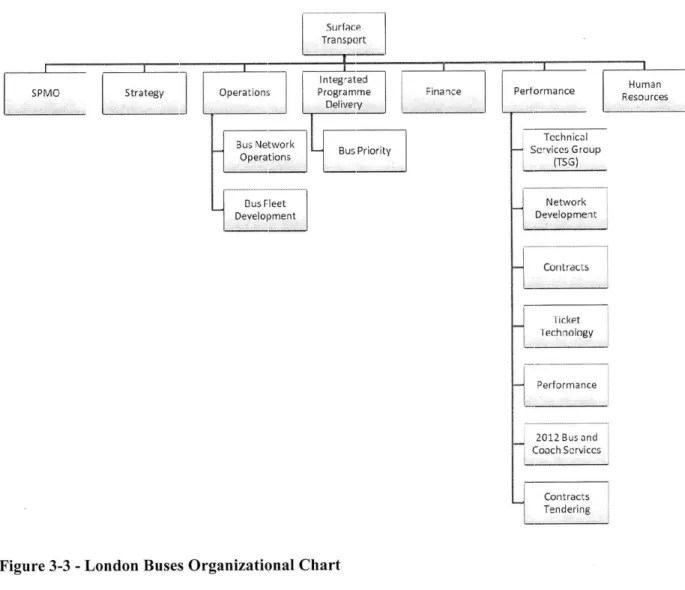
Figure 3-3 - London Buses Organizational Chart ... 44
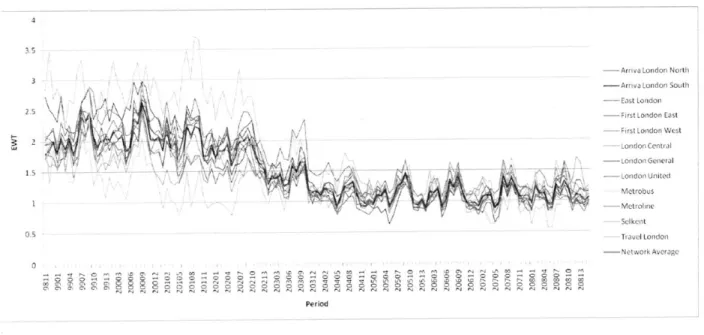
Figure 4-1 -EWT by Operator, 1998 -2009...57
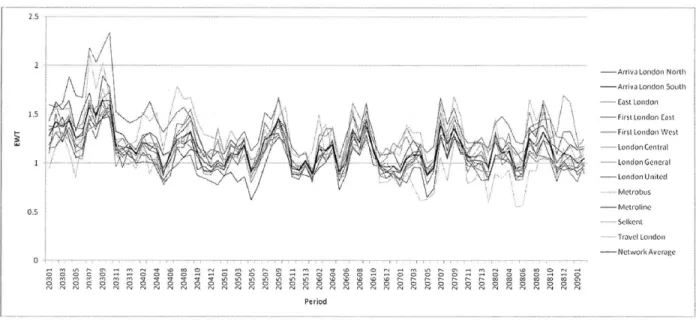
Figure 4-2 -EWT by Operator, 2003-2009...58
Figure 4-3 - Standard Deviation of EWT among Operators, 2006-2009... 59
Figure 4-4 -Categories of Factors Believed to Affect Reliability ... 60
Figure 4-5 - Scatter Plot of AWT/SWT versus Percent Lost Mileage Due to Traffic ... 70
Figure 5-1 -Passenger A rrival PD F ... 82
Figure 5-2 -Passenger Arrival Distribution across Four Headways... 83
Figure 5-3 -A Set of Journey Times for 3 Bus Trips ... 85
Figure 5-4 -Headway, Travel Time, and Journey Time CDF for Route 259 between Edmonton and Seven S iste rs ... 8 6 Figure 5-5 -Route 38 QSI Points and OD Pairs ... 101
Figure 5-6 -Route 98 QSI Points and OD Pairs ... 105
Figure 5-7 -Route 148 QSI Points and OD Pairs ... 108
Figure 5-8 -Route 88 QSI Points and OD Pairs ... 112
Figure 5-9 -Route 211 QSI Points and OD Pairs ... 115
Figure 5-10 - Route 259 QSI Points and OD Pairs ... 119
Figure 6-1 -Route 98 Southbound Running and Half Cycle Times ... 139
Figure 6-2 -Route 98 Northbound Running and Half Cycle Times ... 139
Figure 6-3 -Route 98 Running and Cycle Times ... 140
Figure 6-4 -Route 259 Southbound Running and Half Cycle Times ... 144
Figure 6-5 -Route 259 Northbound Running and Half Cycle Times ... 144
Figure 6-6 -Route 259 Running and Cycle Times ... 145
Figure 6-7 -Route 98 Southbound Running Times between Willesden and Kilburn High Road ... 148
Figure 6-8 -Route 98 Southbound Running Times between Kilburn High Road and Marble Arch...148
List of Tables
Table 2-1 -Summary of Service Restoration Actions ... 30
Table 4-1 -Passenger Journey Factors for FY 2005/2006... 52
Table 4-2 -Definitions of Service Reliability on Low Frequency Bus Routes... 54
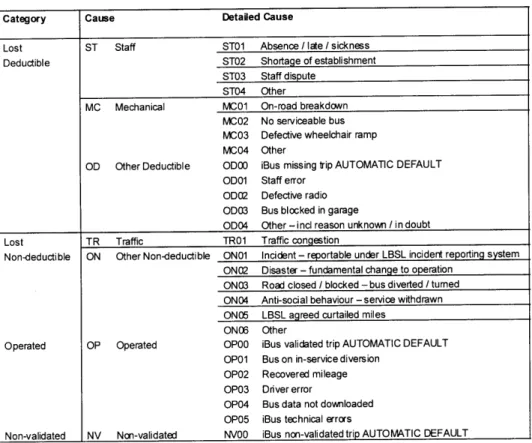
Table 4-3 -Lost Mileage Cause Codes ... 55
Table 4-4 -Potential M easures for Analysis ... 61
Table 4-5 -Factors Highly Correlated with AW T/SW T... 69
Table 4-6 -Model 1 Results...73
Table 4-7 -Model 1 W ithout Percent Lost Traffic ... 73
Table 4-8 -Model 2 Results...74
Table 5-1 -Missing Data Issues...90
Table 5-2 -AM Peak Stabs/iBus Comparison for 5 Routes ... 91
Table 5-3 -Route 148 and Route 211 W eekday Stabs/iBus Comparison... 92
Table 5-4 -Sample Journey Time Calculation Spreadsheet ... 96
Table 5-5 -Panel of Routes for Analysis ... 98
Table 5-6 -Route 38 Reliability Analysis... 102
Table 5-7 -Route 98 Reliability Analysis... 106
Table 5-8 -Route 148 Reliability Analysis... 109
Table 5-9 -Route 88 Reliability Analysis... 113
Table 5-10 -Route 211 Reliability Analysis... 116
Table 5-11 -Route 259 Reliability Analysis... 120
Table 5-12 -Summary of Reliability Analysis ... 122
1 Introduction
This thesis will provide a systematic review of the impact of a large scale AVL (Automatic Vehicle Location) system implementation on a bus network in a major urban area using London as the case study. It will assess whether a recent AVL implementation has improved network operations and service reliability and provide guidance for other transit operators with regard to potential planning and operations benefits that may not necessarily have been defined and quantified when such systems were procured.
Transit agencies often focus initially on making sure the technology implementation proceeds as smoothly as possible. What is sometimes overlooked during implementation is that technology enables application of better planning and operations analysis methods. Specific areas of planning and operations analysis for which AVL data may be of particular use will be identified, and their potential benefits discussed.
This thesis will summarize how a bus operator may maximize the benefits of AVL focusing on selected planning and operations functions. It will combine a literature review on bus service reliability metrics, methods for analyzing AVL data, and lessons learned from the service reliability exercise and apply them towards developing new metrics to assess service reliability in the context of performance measurement,
service control, and operations planning. This will all be presented in the context of London Buses, which introduced a new AVL system called iBus in 2009.
1.1
Motivation
The transit industry is constantly evolving to take advantage of technological advances. While a transit agency would ideally upgrade their operations technologies at will to reflect the latest, most sophisticated products available on the market, fiscal and capital constraints prevent the agency from doing this.
Therefore, when it is faced with an opportunity to make a capital investment, the agency has an obligation to ensure that the benefits of the investment are maximized. In the context of an upgrade in technology, this involves ensuring that the status quo is maintained or improved, as well as investigating possible new functionalities the technology improvements may provide.
More sophisticated data collection systems enable transit agencies to analyze a wider range of
performance measures with substantially higher accuracy. Before the implementation of automated data collection systems, collecting data was very labor intensive and costly. Manual surveyors had to be placed at key points along routes to collect data such as run times, bus frequency, and passenger loads, and even
the best observers made errors (Multisystems, Inc., 1985). Obtaining a large sample of any data was difficult and costly. Automated data eliminates this need by providing data on the great majority of the population (Furth, 2000). In addition, data that were virtually impossible to collect before, such as bus arrival and departure times at every stop along a route, are now feasible. It is therefore important to determine what uses these additional data may have in aiding transit agencies to achieve their mission as efficiently as possible. If an agency simply continues to use old measures developed in a different environment, the only possible improvement is through better estimates of these old measures. The transit industry, like any other industry, strives to maximize efficiency and resource utilization in order to avoid redundancy and to control costs. AVL data, which enables operators to more accurately monitor vehicles and to analyze data at a finer level of granularity than was previously possible, should aid in minimizing operating costs. AVL data also enables new measures, such as reliability of service, to be specified, measured, and used in financial analyses with the aim of more accurately measuring project benefits (Hollander and Buckmaster, 2009).
AVL implementation also provides agencies with an opportunity to step back and assess whether they are meeting their service delivery objectives. While the primary aim of the agency should be customer service, an agency may mistakenly focus only on operations to try to achieve better service. For example, when making real-time service control decisions, one rarely hears a controller ask how many passengers will be affected by an intervention. Instead, the controller makes the decision from an operations
perspective, such as attempting to get all buses back "on schedule" by short-turning numerous trips. Even though agencies strive to be customer oriented, they may mistakenly focus heavily on the bottom line, which leads to a more operations oriented response to service disruptions.
In addition to providing new data analysis capabilities, the role of the transit agency is also changing. New technological sophistication shifts the emphasis from hands-on operations monitoring to more of a technical support and advisory role. Some systems, such as most British bus services and York Region Transit near Toronto, do not engage in operations at all but focus on network planning and performance monitoring (York Region Transit, 2010). With a continuing shift in the industry towards contracted bus services, the number of agencies shifting their focus is likely to keep increasing.
An improved transit system equates to improved operations and customer satisfaction. This in turn leads to improved efficiency, which saves the agency - and the taxpayer in the case of publicly-supported systems - money in the long run (Callas et al, 2004). Studies have been conducted evaluating the effects of these new automated systems for medium sized bus properties, such as Portland, OR (Callas et al. 1999,
2001, 2003, and 2004). However, this thesis presents an opportunity to analyze a large-scale AVL implementation in London, UK, which may have implications for other megacities around the world.
1.2
Objectives
The overarching objective of this thesis is to demonstrate how transit agencies can get the most value out of their AVL systems. It will be especially important to show that AVL data does not just provide better means of calculating metrics and service standards that agencies had previously estimated using less accurate methods; rather, due to the windfall of data it is possible to extract from this technology, AVL data also enable agencies to develop more robust and sophisticated metrics and analysis methods. The benefits of AVL will be evaluated for the service reliability measurement and operations planning functions.
This objective will be achieved by examining the following issues in detail:
* Factors that affect service reliability will be analyzed to determine whether introducing an AVL system in London can be shown to improve reliability. This analysis addresses two topics: the first is determining whether the implementation of AVL results in measurable improvement. The second is that it will enable a more complete picture to be painted of the many factors that may potentially affect service reliability, and their relative importance.
* New, more robust measures of service reliability will be developed that better describe the operating environment, both from an operational perspective and from the passenger's
perspective. As has already been discussed, agencies generally focus on operations performance, which may not be the best way to understand the passenger perspective. This will reveal the relative differences between the passenger's perception and the operator's perception of good service.
* It will be demonstrated how archived AVL data may be used to create more accurate operations plans, increasing system efficiency and reducing operating costs. The finer data provided by archived AVL data will allow for more accurate measurement of running time, providing more reliable information on which to build the operations plan.
1.3
Research Approach
The objectives outlined above will be pursued in the context of the bus network in London, UK, which recently completed a system-wide AVL implementation, called iBus. Methods already developed and used elsewhere in the industry will be synthesized and applied in this new context.
While London is used as the case study in this research, many of the conclusions developed may be applied universally to other large transit systems. However, there are some important differences between the London system and the typical North American transit system that should be recognized at the outset. In contrast to most North American transit agencies, where service planning, operations, and monitoring are all performed by a public agency, London's bus network is privately operated via a tendering and contracting process (London Assembly, 2006). The public agency, Transport for London (TfL), through its London Buses subsidiary, is responsible for setting routes, tendering operations contracts, and monitoring operations (TfL, 2008). A consequence of this organization is that TfL has developed a comprehensive bus monitoring performance system that includes extensive data collection and analysis. The specific nature of the London bus network is described in detail in Chapter 3. However, it suffices here to say that there are some fundamental differences between the operations of the London bus
network and the typical North American transit operation which arise from the fact that bus operations are contracted to the private sector. The thesis will look at how London is measuring the benefits of AVL, identify work they have produced thus far to make use of new data, and suggest ways they may further take advantage of the data analysis potential presented by AVL.
Before demonstrating the benefits of AVL, it is essential that the analyst has an understanding of factors affecting service reliability. With this understanding, the analyst will be more informed about what he/she may control in order to improve service reliability. This will be performed by creating a comprehensive set of factors that affect service reliability and assessing their relative importance. Those factors that are found to be significant will then be included in a regression model, which will provide a rough picture of how these factors affect service reliability.
This thesis will apply accepted methods already developed for the industry towards new uses. It intends to present a synthesis of two areas of recent research. The first area, developed by Chan (2007) and Uniman (2009), challenges the classical conceptions of service reliability. For the most part, work on service reliability has focused on providing smooth operations, which is desirable from an operations standpoint. However, the transit agency should also focus on providing the best travel experience for the passenger, as the passenger is one of the most important stakeholders in the system. It is therefore essential that service reliability be analyzed also from the passenger's perspective. This objective will be met by analyzing the parts that make up the passenger travel experience, and developing measures that accurately reflect these parts.
Passenger-centric service reliability measures also aid in the service control process as analyzed by Carrel (2009) and Froloff et. al. (1989). A major impetus for installing AVL systems is that it improves service
controllers' ability to make informed service control decisions. However, formal analyses of which decisions should be taken in specific situations have generally been lacking with bus AVL installations. A comprehensive survey of industry research pertaining to formalizing the service control process will be included in order to provide guidance for analysts wishing to apply passenger-centric service reliability measures towards the improvement of service control.
The second area, developed by, among others, Furth and Muller (2006), provides a framework for using AVL data to provide more robust measurements of service reliability and to aid in the operations planning process. AVL data will be used to compare observed operations to scheduled operations, in order to demonstrate how these data enable schedulers to make more informed decisions resulting in more robust schedules. This will also demonstrate how using AVL data, which is more accurate and efficient than manual data collection methods, also enables schedulers to more efficiently use resources by reducing uncertainty (and therefore slack time) on bus runs where a bus is waiting between trips. Numerous studies to the same effect have been produced in Portland, OR, which will be presented in the literature review in Chapter 2 (Callas et al. 1999, 2001, 2003, and 2004).
1.4
Thesis Organization
Chapter 2 will present a literature review of research focusing on applications of AVL data with regard to performance measurement, operations planning, and service control. Chapter 3 will describe the bus network in London, focusing on organizational structure, the contract tendering process, and the history of AVL technology deployment in London. Chapter 4 will introduce reliability measures currently used by London Buses, describing them and evaluating their benefits and limitations. This chapter will also discuss factors that affect service reliability on the London bus network, and will present a regression model that relates service reliability to a number of factors identified by London Buses staff. Chapter 5 will look at new, robust service reliability measures that may be estimated from AVL data. In particular, it will focus on measuring reliability from the passenger's perspective as opposed to just the operator's perspective, and recommendations will include how these measures may aid in making more educated service control decisions. Chapter 6 will present applications of AVL towards developing more accurate operating plans and analysis of run time distributions for various bus routes, comparing current practice with those developed using AVL data. Finally, the work will be summarized in Chapter 7, which will also discuss opportunities for future research in this field of study.
2
Literature Review
This chapter introduces the essential theories pertaining to service reliability, operations planning, and service control required for the subsequent analyses presented in this thesis. A summary of a
comprehensive analysis of an urban AVL installation in Portland, Oregon, USA is also provided to demonstrate how an AVL system may be used to provide a multitude of benefits in all areas discussed. Section 2.1 presents a brief overview of studies that have summarized the benefits of AVL. Section 2.2
introduces service reliability measures of relevance to this thesis, focusing on recent developments of customer-oriented measures. Section 2.3 describes operations planning, focusing specifically on the scheduling process. Section 2.4 presents an overview of research performed on service control. Section 2.5 presents a summary of work conducted in Portland, Oregon, USA, a medium sized property which has been analyzing AVL for the past decade. The chapter is summarized in Section 2.6, describing how the concepts presented in this chapter apply to this thesis.
2.1
Using AVL Data for Analysis
An advantage of AVL is that it allows transit agencies to improve the accuracy and extend analyses aimed at improving operations and performance monitoring. A brief survey of the benefits of AVL identified in literature is presented below.
Parker (2008) takes stock of current agency practices by presenting a survey of how AVL systems have been used in bus systems in North America. A noted challenge of implementing AVL is adapting agency business practices and operating procedures to accommodate the new capabilities available with AVL. While all agencies surveyed indicated that practices in their operations units were being adapted for AVL, only 62% of agencies' information technology departments and only 42% of their planning departments were modifying practices to accommodate AVL. Parker foresees a challenge in convincing agencies of the importance of these data sources.
Furth et al. (2006) present a comprehensive survey of the attributes of modern AVL systems and how these systems may be used to improve transit service. One of the major benefits identified is linking AVL data to APC (Automatic Passenger Counters) data installed on many transit vehicles. APC systems are capable of estimating passenger loads on buses via sensors installed at every door on a bus. APC records with timestamps may easily be linked to AVL bus location data and the analyst is then able to estimate loadings on vehicles and passenger volumes at stops, enabling the development of service metrics which reflect passenger volumes. The result provides a more accurate picture of the effects of certain attributes of service (such as headway variability) on the customers, more accurately linking the supply side of
transit - the vehicles and their operating schedules - with the demand side. Of particular interest to this thesis, methodologies are presented for using archived AVL and APC data to set running times and measure wait time, which will be discussed in subsequent sections of this chapter.
Furth et al. point out that as a result of the new potential for analysis provided by AVL systems, transit agencies, which used to be "data poor," are now "data rich". This has enabled transit systems to focus their planning and operations analyses in the five following areas:
1. Extreme values - In the past, manual surveys, which result in small samples, were not able to provide accurate distributions of running times or headways. Thus, agencies generally focused their analyses on mean values. Now, with AVL and its potential to produce very large sample sizes, accurate distributions of these attributes can be produced. This enables the service providers to produce more accurate schedules, as bus cycle times are generally governed by the 9 0th or 9 5th percentile running time. In addition, more accurate headway distributions will provide better measures of the passenger experience on high frequency routes as passengers may schedule their trips based on a value closer to the 9 5th percentile wait time rather than the mean wait time
(Furth and Muller, 2006).
2. Customer-oriented service standards and scheduling - Matching AVL data with APC data enables the transit provider to more easily estimate reliability metrics that are more passenger focused, such as the percentage of passengers waiting more than a given number of minutes for a bus to arrive. Previously, agencies were not capable of calculating the passenger costs of
alternative strategies.
3. Planning for operational control - The effects of real-time control decisions may now be measured. For instance, AVL data can indicate the effect on wait time of short-turning a bus. 4. Road congestion -AVL data records can be used to measure how the introduction of transit signal
priority schemes or dedicated bus lanes have affected running times.
5. Other hidden trends - It is possible to find new trends in what was previously treated as random variation in the data, such as explaining run-time variability across vehicle operators.
While all the above points merit analysis, points 1-3 are of particular relevance to this thesis, as they may be applied in the methodologies used in subsequent analyses.
2.2
Measures of Service Reliability
Service reliability measures analyze the consistency of the service provided. In an ideal world, transit services will operate exactly according to the operations plan. However, a number of factors, such as weather, traffic congestion, driver behavior, passenger demand, and controller actions, will cause the
transit service to deviate from the operations plan and introduce randomness into these operations. The goal of the agency is to minimize these deviations. This may be achieved by developing absolute
measures to describe an operations plan, developing relative measures to describe the deviations from the plan, and monitoring the service regularly. A survey of measures relevant to this research is presented in this section.
Abkowitz et al. (1978) define service reliability as "the invariability of service attributes which influence the decisions of travelers and transportation providers." They demonstrate how reliability is important to both passengers, whose travel behavior is correlated with the perceived reliability of certain services, and operators, who equate reliability with cost effectiveness. Measures accounting for the variability in the day-to-day experiences of passengers and operators are proposed; it is using this framework that most modem measures of reliability were developed.
2.2.1 Wait Time
Passengers place a high value on minimizing the amount of time they have to wait for a vehicle at a stop. For low frequency routes, this typically involves consulting the timetable and factoring in prior
experience selecting a departure time. In this case, a service is reliable if buses arrive consistently
according to the timetable. However, on high frequency routes, vehicles are assumed to depart frequently enough that passengers do not necessarily consult a timetable. Passengers are assumed to arrive at stops randomly. In this case a reliable service would be one where a passenger would never have to wait longer than the scheduled headway.
The classic equation for average wait time, as shown in Equation 2-1, takes into account the variability of headways via the coefficient of variation (Odoni, 2008). This is an absolute measure which may be applied towards developing relative measures describing the wait time experience. The lower limit of this equation represents an ideal situation where headways are perfectly uniform; the expected wait time would simply be half the scheduled headway. However, when headways are not uniform, a randomly arriving passenger is more likely to arrive during a long headway than a short headway, resulting in the expected wait time being greater than the average headway. This is also true for scheduled services with uneven headways.
Average Wait Time = 0.5 * E[Headway] * (1 + COV~eadway) (Equation 2-1)
It is interesting to note, however, that Jolliffe and Hutchinson (1975) demonstrated that passenger arrivals are not necessarily random for a reliable, headway-based service. If the day-to-day variation in bus arrival times is small, regular passengers get a feel for when the bus they need is likely to arrive, and may time
their arrivals at the stop accordingly. The average passenger wait time is therefore less than predicted in Equation 2-1. This is true even for passengers who do not time their arrivals at bus stops, as they may wait at a local coffee shop and only head to the bus stop once they see a bus coming. This trend is quite difficult to quantify, however, without performing large surveys, so the classic methodology (i.e. Equation 2-1) is widely accepted in the industry.
It is possible to build a wait time distribution from AVL-based headway data (Furth and Muller, 2006). By combining a distribution of the headways with the frequency of occurrence of each value of the headway, it can be shown that the fraction of headways greater than a length determine the probability of waiting the given amount of time. The probability density function of passenger wait time is expressed in Equation 2-2.
fw(W) = [1 - FH (W)]/E [Headway] (Equation 2-2)
Where:
W is the amount of time a passenger spends waiting for a vehicle;
fw(W) is the probability density function of passenger wait time; and FH (W) is the cumulative distribution function of headways.
Furth and Muller (2006) developed the concept of hidden waiting time. They note that in order for passengers to arrive at their destinations on-time most of the time, they need to budget more than the expected wait time, as budgeting only the expected wait time will ensure they arrive on-time only 50% of the time. They assume that a passenger will budget to arrive on-time 95% of the time, so the passenger will use the 9 5th percentile of wait time. The 9 5th percentile wait time is based on a distribution of the
headways as well as the frequency of each headway, as shown in Equation 2-2. The difference between the 9 5th percentile wait time and the expected wait time, potential waiting time, is either realized at the beginning or end of the trip. When the potential waiting time occurs at the end of the trip, it can be "redeemed" by additional time gained at the destination. However, the value of this redeemed time is not as high as if it was not needed in the first place, as the passenger is constrained by what he/she is able to do at the destination.
2.2.2 Excess Waiting Time
Excess Waiting Time (EWT) is a relative measure that has been used in the industry to measure the variability of bus arrivals. It represents the extra amount of time a passenger waits on average above the scheduled wait time. As shown in Equation 2-3, it is the mathematical difference between the observed average wait time and the scheduled average wait time.
EWT = Observed Wait Time - Scheduled Wait Time
Note that both the observed wait time and the scheduled wait time are calculated using Equation 2-1. 2.2.3 In-vehicle Travel Time
In-vehicle travel time is an absolute measure defined as the amount of time a passenger spends in a given transit vehicle between the origin and destination stops. While the monetary value of a unit of in-vehicle travel time is generally perceived to be lower than the monetary value of a unit of wait time, any
uncertainty introduced into in-vehicle travel time will result in disutility to the passenger (Small and Verhoef, 2007). Passengers on severely delayed vehicles (e.g. a bus stuck in congestion or a train stopped between stations) will realize that service is not operating as planned and will therefore perceive the service negatively. These passengers may budget their time accordingly for their subsequent trips. 2.2.4 Journey Time
Journey Time is an absolute measure which reflects the total passenger journey experience. Ideally it would describe the passenger experience from leaving the origin location (e.g. home) to arriving at the destination location (e.g. work). However, in most cases it is infeasible to monitor the travel patterns of every passenger at this level of detail in order to gain a full sample of origins and destinations.
Uniman (2009) described how the London Underground measures a passenger journey. It is broken down into five components: Ticket Purchase Time; Access, Egress and Interchange Time; Platform Wait Time; On-train Time; and Closures. Each component has an associated unit value of time', as passengers perceive each part of their trip differently.
This framework may be applied to the London bus network if certain changes are made to reflect the different characteristics of each mode. While it is common for Underground riders without valid tickets to purchase a ticket as part of their overall trip, this is less common for bus riders since many buses in Central London do not accept cash payment. Ticket machines are available at select bus stops, interchanges with the Underground, and at private retailers outside the system.
Access, Egress and Interchange times are also less well-defined for buses. Rail stations have clearly defined distances from the point of access to the platform. With a few exceptions (major bus terminals such as bus-only platforms within Underground stations), bus stops have no access or egress distance. However, when interchanging between bus routes, a passenger must walk between bus platforms, even though the interchange may not take place within the defined structure of a station, there is still a time penalty for the interchange.
1 For information about the concept of value of time, see Small and Verhoef (2007) and Wardman (2001).
Chapter 5 will present the derivation for Journey Time used in this thesis, which is an indeterminate measure when applied to an un-gated transit network. It will be defined as the sum of wait time and in-vehicle travel time.
2.2.5 Excess Journey Time and Reliability Buffer Time
Excess Journey Time (EJT) and Reliability Buffer Time (RBT) are two relative measures of reliability that may be calculated from Journey Time. Chan (2007) presents a survey of possible applications of AFC data, including two metrics of particular relevance to this thesis: the Excess Journey Time Metric and the Reliability Factor, which Uniman (2009) renamed Reliability Buffer Time. There metrics were developed for the London Underground which uses smartcards (i.e. Oyster Cards) for a tap in/tap out fare payment system, resulting in measurable, determinate journey times. Most bus networks do not require users to both tap in and tap out, resulting in indeterminate journey times. However, the underlying theory behind these metrics can easily be applied to buses.
Excess Journey Time is defined as the difference between the observed journey time and the scheduled journey time, as expressed in Equation 2-4. It therefore represents the amount of time a passenger had to spend in transit over and above the expected, or scheduled, Journey Time. An aggregate EJT metric was also developed by Chan, as AFC data were used to scale up the individual EJTs for a given
origin/destination pair.
EJT = Observed Journey Time - Scheduled Journey Time (Equation 2-4)
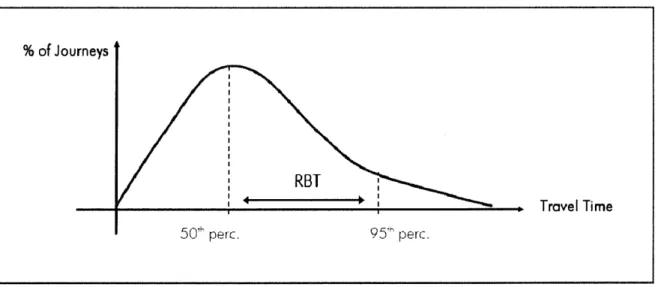
Reliability Buffer Time is defined as the difference between the 9 5th percentile Journey time and the
median Journey Time for a given origin/destination pair, as shown in Figure 2-1 (Uniman, 2009) and defined in Equation 2-5. This represents the extra time passengers must budget to reach their destination on-time with 95% predictability (Chan, 2007). Using the median Journey Time to time one's expected
arrival at a destination would result in arriving late 50% of the time. This factor is independent of the schedule, and it describes the true variability of operations, as opposed to EJT which describes the deviation of operations from the schedule, even for cases when the operations are consistent. RBT = 95th Percentile Journey Time - Median Journey Time (Equation 2-5)
% of Journeys
Figure 2-1 -Reliability Buffer Time
Uniman et al. (2009) develop RBT further by introducing a metric called Excess Reliability Buffer Time (ERBT) to compare reliability with a baseline reliability measurement (see Figure 2-1). ERBT captures the excess amount of time passengers are required to budget to arrive at their destination on-time over and above the excess amount of time that would have been required under normal operating conditions. This measure acknowledges that transit services experience unavoidable variability in operations. However, services also experience many avoidable or preventable disruptions. ERBT captures the difference between these two types of performance by comparing a given RBT to a baseline formed from "typical" RBT values, as shown in Equation 2-6. This measure allows agencies to define a desired level of unreliability, and measure their operations against this baseline.
ERBT = RBToveraii -RBTTypical (Equation 2-6)
This procedure also enables the number of trips experiencing an unacceptable level of unreliability to be quantified, expressed as the Percent of Unreliable Journeys (Uniman et al, 2009). This measure is simply the number of journeys with a positive ERBT (i.e. the number ofjourneys where RBT was found to be greater than the baseline).
2.3 Operations Planning
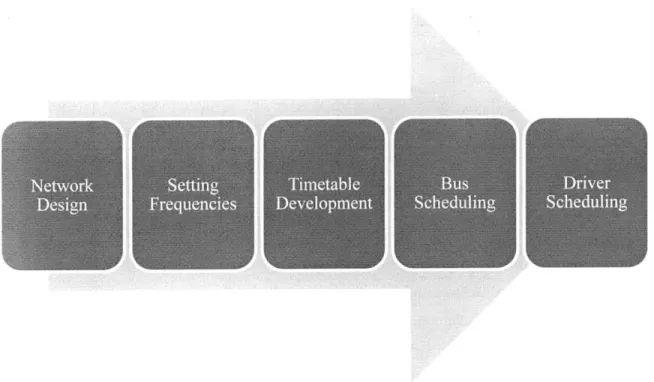
Operations planning is a crucial element of bus network design. Ceder and Wilson (1986) characterize the bus planning process as a sequential process with 5 levels, as shown in Figure 2-2; the outputs from one level are inputs at the next level. This research focuses on the third and fourth levels, timetable
development and bus scheduling.
Travel Time
Network
Design
Bus
Scheduling
SettingFrequencies
TimetableDevelopment
Driver SchedulingFigure 2-2 - The Bus Planning Process
Timetable development involves using three inputs, passenger demand, service hours, and running times, to develop departure and arrival times for every trip. Once departure and arrival times for every trip have been defined, individual buses may be assigned to each trip.
Bus schedules are developed from the timetable and requires four inputs, deadhead times, recovery times, schedule constraints (the timetable), and cost structures. This research focuses on running times and recovery times, for which AVL data may contribute more comprehensive and reliable inputs.
The amount of time a vehicle is allocated to operate a round trip is referred to as cycle time with the time for a one-way trip called halfcycle time. This may be broken down into two components: running time
and recovery time. Running time is the amount of time the vehicle spends in transit from the origin to the
destination. Recovery time is recovery time and/or layover time allocated at the end of the trip which has the purpose of ensuring that the next departure leaves on time and the driver has a break between trips. It is intended to capture the variability in running times.
Transit services, in particular buses operating in mixed traffic, are susceptible to high running time variability if left uncontrolled. This variability is caused by numerous factors, including weather and traffic variability, differences in driver behavior, dispatching practices, and variability in dwell times (Abkowitz et al., 1978). Thus, schedulers have to strike a balance between service reliability and travel speed, as a slow service may be reliable but will still deter passengers from using transit.
In the past, measuring running time required manual surveyors and was therefore labor intensive. Setting running times also depended heavily on input from passengers and operators (especially when new field surveys were impossible), and was therefore most sensitive to exceptional incidents as opposed to being indicative of typical operations (Furth, 2000). With AVL, it is possible to measure terminal to terminal running times quite easily, and trends in running time can be analyzed over time. Some formal analyses performed on determining running time, recovery time, and cycle time are presented here, and mainly reflect the work of Furth and Muller (2006) and Fattouche (2007).
Defining scheduled running time and cycle time is a function of the agency's policy as well as the operational goals for the route. High frequency routes have different operating objectives than low frequency routes, and therefore different requirements when developing a schedule. Using a low percentile running time as the scheduled running time may make sense on a high frequency route where the published timetable is irrelevant from the passenger's perspective. However, this would result in many late trips on low frequency routes, which passengers will perceive as unpunctual operations.
It is important to note that while buses being late on low frequency services is undesirable, being early is even less desirable. Since passenger arrivals at stops on low frequency routes are often based on a
timetable, a bus that leaves a stop before the published time may result in a missed trip and a long wait for the next bus arrival. Thus, run times on low frequency routes are generally set to low to mid range
percentile values of observed run times, and early buses en route are held at a stop until the appropriate scheduled departure time.
A common North American practice is to set scheduled running time equal to the mean or median observed running time. This alone provides too little slack, and results in a high probability of lateness on the trip (Furth and Muller, 2006) as well as on subsequent trips unless sufficient recovery time is
provided. Scheduling running times at the 8 5th percentile of running time, which some agencies use, will
result in numerous early trips on low frequency services requiring holding, but may result in better schedule adherence from the passenger's perspective (Furth, 2000). On high frequency services, the tradeoff between long holding times (and therefore longer running times) and the evenness of headways must be considered (Fattouche, 2007).
Furth and Muller (2006) looked at the tradeoff between service reliability and optimal running time schedules for low frequency routes. They note that while adding holding points en route is used to create a more reliable schedule, it also results in a higher user cost since travel times become longer on average. However, time spent at holding points merely results in a redistribution of the slack time over the entire journey, as opposed to concentrating it at the end of the trip, and therefore does not increase the operating
costs of the route. By performing simulations to optimize the tradeoff between user costs and operational reliability, they found that the optimal scheduled run time for low frequency routes should be set to the mean plus one standard deviation of the observed run times (approximated by the 8 5th percentile), and the
optimal half cycle time should be set to the mean plus 2 to 3 standard deviations of the route running time.
Furth et al. (2006) compare scheduled and observed running times by plotting chronological distributions of running time. By grouping the distributions into timebands of homogenous running times, it is possible to calculate percentile values of running time for certain times of the day, in order to create more accurate and efficient schedules. It is important to note, however, that the timebands used for setting running times may not be the same as those used for setting route frequencies. Route frequencies are set based on passenger demand; more frequent service will be operated during peak periods. Running times are based on observed operating conditions, which may not correspond directly to the periods used to define passenger demand.
Fattouche (2007) proposes a method to use AVL data to set running times for high frequency services in Chicago. She presents a methodology for modeling how a new schedule may affect bus reliability. When determining the effectiveness of a schedule, Fattouche notes that passengers face a tradeoff between travel time and wait time, both of which may be expressed as cost. Excessive use of schedule based holding strategies may result in a slow travel experience for passengers on the bus, while focusing solely on ensuring each trip is completed as quickly as possible may result in uneven headways, and therefore increases the variability in wait times. Additionally, agency costs must be considered to ensure that sufficient resources are available for implementing the schedule.
By formulating this as a generalized cost minimization problem, Fattouche is able to determine optimal practices for scheduling. She employs historical AVL data to develop running time and headway
distributions and predict the costs of implementing different scheduling policies, including schedule based holding, setting scheduled running times to different percentile values, and comparing these to the
existing schedule. Fattouche found that the optimal solution results in total user costs that are similar to those for the original schedule. She concludes that generalized cost minimization is capable of improving reliability and the passenger experience, although each solution provided by her method is based on an
individual route's operating constraints, and is therefore applicable only to the given route.
2.4 Service Control
Far less effort has been put into formally defining the bus service control process and developing a best practices guideline for it. The works presented in this section, notably those from the RATP and various
research projects at MIT, provide a framework for creating a formal process while acknowledging that every disturbance to a network presents a unique situation that cannot be remedied via an off-the-shelf solution. The majority of research performed thus far has been for rail-based systems which operate in a protected environment, but the RATP's (Rdgie Autonome des Transports Parisiens) report is one which has focused specifically on bus operations.
This thesis will not recommend specific best practices for service control using AVL data, as best practices are highly dependent on operational philosophies and on the individual route operating environment. However, it is important for the reader interested in using AVL data to formalize service control methods to have a comprehensive understanding of the underlying theory behind service control and the range of control interventions available.
Ensuring service controllers are trained properly in using the AVL system to its full capabilities is crucial in meeting the objectives of service control, as Parker (2008) points out. Service controllers have a high turnover, so management must constantly monitor the staff to ensure that they are taking full advantage of the equipment and technology at their disposal.
Froloff et al. (1989) at the RATP in Paris endeavored to characterize the service control process
systematically and develop a theoretical framework for service management. They believed there was a lack of "formalized knowledge" with regard to service management, which proved problematic because it was impossible to train controllers based on sound theory, so all training was based on anecdotal
experience. This lack of knowledge also prevented future route design and operations plans from being designed to their potential.
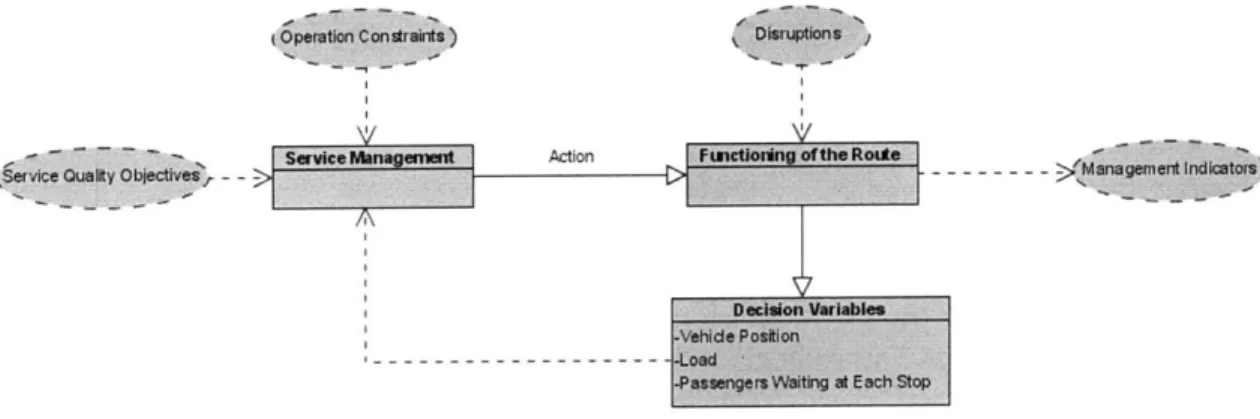
Froloff et al. considered the operation of a bus route to have 2 main components, as presented in Figure 2-3:
1. The Functioning of the Route - The condition of the route at a given time. This may be described by a set of variables such as the vehicles' positions in time and space, their loads, etc.
2. Service Management - Adapting the service plan as operations unfold. This focuses on analyzing the gaps between the planned and existing operations, and methods to resolve these disparities.
L ConsraintsbOperle
- -> ameme Indicatom!
kServce Quaty Oj[es,
-Figure 2-3 -A Schematic of Bus Route Operations
While the operating schedule is static for a given day and time, service management is significantly more dynamic. As shown in Figure 2-4, it may be represented as a set of conditions (starting with the ideal condition) which are subject to disruption. Actions are carried out to counteract the disruption, and the system moves to a new condition.
to Codtondn
Disturbance
ti Condition1 Action Conii
Condition p1 Disturbance
t:Condition2 Action Condition 42
Time
Figure 2-4 -Evolution of the System over Time
The authors endeavored to categorize and provide comprehensive lists of both service management strategies and restoration actions within the context of the RATP's bus network. Four main operating
philosophies were identified, each deemed appropriate depending on the type of route, time of day, and other operating conditions:
1. Meeting Passenger Demand - This strategy, which dominates during peaks, places priority on ensuring no passengers are left behind at any stop.
2. Providing a Consistent Service - This strategy, which dominates during the off-peak, minimizes wait time by striving for even headways.
3. Ensuring Punctuality - This strategy dominates for low frequency routes, where passengers consult published timetables to time their arrivals at stops.
4. Meeting Staffing Requirements - This strategy takes staffing constraints into account, respecting driver scheduling and minimizing overtime.
Froloff et al. developed a set of fairly crude metrics using the data at their disposal at that time to assess service reliability and to determine which service management strategy controllers should focus on. With the introduction of AFC and AVL data sources, additional metrics, such as those to be presented in Chapter 5, have been developed and implemented to more accurately reflect operating conditions.
Fifteen main service restoration (intervention) actions were identified, which may be carried out at the beginning of the route and/or en route (see Table 2-1). These interventions can only be applied if there is both a staff member and a vehicle available. In cases where one is available and not the other, the controller is required to ensure the missing component is added as soon as possible in order to avoid further service disruptions.
Table 2-1 - Summary of Service Restoration Actions
Location Service Restoration Action Description
Beginning of Route Jumping If the scheduled vehicle is not available, the controller may substitute another vehicle for the scheduled vehicle. Reassigning A scheduled block is reassigned to an
earlier time.
Shift schedule timeframe When the controller is able to anticipate a delay, he/she may shift the entire
schedule over by a certain amount of time to try and preemptively fill in the
anticipated gaps in service.
Eliminate trip Trips may need to be dropped if no staff or vehicles are available, or if the terminal cannot be reached due to other
issues such as severe congestion. Add trip This action is generally used in cases of
Location Service Restoration Action Description
events, where the scheduled service will not be able to meet the passenger demand.
Modify headways A trip cancellation may result in a longer than usual gap of service. In order to make sure service is spaced as evenly as possible, the entire route's headway may need to be lengthened.
En Route Modify scheduled running times This intervention enables running times to better reflect reality, and was already
discussed in Section 2.3 as part of operations planning.
Hold at bus stop Holding can be used to absorb large point loads (i.e. schools) or be used to even out service.
Change bus Changing the vehicle used to run the trip may be used when dealing with
breakdowns and other service interventions such as short-turning. Passengers will need to transfer from one vehicle to another.
Pass on route This intervention can be used during incidents of bus bunching. The less crowded vehicle is sent ahead of the crowded vehicle to pick up the next passengers in order to even out the loads on the two buses. This is referred to as "leapfrogging" when done more than once.
Change drivers This intervention involves switching drivers at a point where buses in opposite directions meet, which is equivalent to two short turns. This can enable work rule requirements to be met (e.g. minimizing overtime).
Detour Detours are used to avoid an area of
congestion or, in cases of
deadheading/expressing, they are used to minimize travel time.
Any point of the Route Short-turning This is used to fill in gaps or relieve heavy loads in the opposite direction, to restore ideal conditions when a previous service intervention had been used on a bus, or to adjust the schedule of a late driver.
Location Service Restoration Action Description
Extending trip This intervention may be used on routes with scheduled short turns. Extending a scheduled short turn fills in a gap on the outer segment of the route.
Modifying trip This intervention is used to change the destination of a trip on a route with branches or to switch deadheads to revenue service.
With the strategies and intervention methods identified, the report attempts to formalize how the service controller should choose the appropriate service management strategy and interventions appropriate to the route condition in question. Four guiding constraints are considered:
1. Demand - The controller should ensure that the service provided (i.e. the supply) matches the demand for that route. This is performed by producing loading diagrams for the time of day in question. When high peak loads exist at certain points, the controller may need to short-turn buses to meet these peaks.
2. Running Times - Congestion causes significant delays to buses and can cause severe service disruptions. However, controllers can use historical data to modify the scheduled run times to reflect reality. Routes which have congestion in spots may have irregular headways over the congested section; however, these sometimes correct themselves (what the authors term the "accordion effect"). The service controller must know how each individual route responds to congestion in order to make the most informed decision possible.
3. Topography - The controller must be aware of possible points for short-turns. If none exist, it is impossible to short-turn a route. Possible detours for deadheads and expresses should also be investigated in order to react to adverse situations. If the route shares a trunk section with other routes it may be possible to take advantage of the other common routes during service
interventions. The trunk section becomes less important for the route with the delay as the other routes could pick up the load. Short-turns are likely to be more effective on longer routes than shorter routes since they may not make up much time on short routes.
4. Route Attributes - The controller must always keep in mind the constraints present on each route, such as: garage location(s), the number of buses run on the route (fewer buses mean less
possibility of performing service interventions), the location of relief points, and staffing attributes.
Froloff et al. concluded that best practices for service management cannot be simplified to an off-the-shelf solution. Each situation has unique constraints and sometimes conflicting objectives that need to be met.