HAL Id: hal-02796407
https://hal.inrae.fr/hal-02796407
Preprint submitted on 5 Jun 2020
HAL is a multi-disciplinary open access
archive for the deposit and dissemination of sci-entific research documents, whether they are pub-lished or not. The documents may come from teaching and research institutions in France or abroad, or from public or private research centers.
L’archive ouverte pluridisciplinaire HAL, est destinée au dépôt et à la diffusion de documents scientifiques de niveau recherche, publiés ou non, émanant des établissements d’enseignement et de recherche français ou étrangers, des laboratoires publics ou privés.
Hypotheses about the future of the drivers of the “land
use and food security” system and their translation into
quantitative hypotheses
Chantal Le Mouël, Elodie Marajo-Petitzon, Olivier Mora, Marie de
Lattre-Gasquet
To cite this version:
Chantal Le Mouël, Elodie Marajo-Petitzon, Olivier Mora, Marie de Lattre-Gasquet. Hypotheses about the future of the drivers of the “land use and food security” system and their translation into quantitative hypotheses. 2016. �hal-02796407�
Agrimonde-Terra foresight: Land use and food security in 2050
Working Paper
Hypotheses about the future of the drivers of the “land use and food security” system and
their translation into quantitative hypotheses
Le Mouël C. (Inra, SMART, Rennes), Marajo-Petitzon E. (Inra, SMART, Rennes), Mora O. (Inra,
DEPE, Paris), de Lattre-Gasquet M. (Cirad, Paris)
Authors of the translation into quantitative hypotheses: Le Mouël C. (Inra, SMART,
Rennes), Marajo-Petitzon E. (Inra, SMART, Rennes), with contributions from: Dumas P.
(Cirad, CIRED, Nogent/Marne), Forslund A. (Inra, SAE2, Rennes), Manceron S. (Inra, DEPE,
Paris), Brunelle T. (Cirad, CIRED, Nogent/Marne), Mora O. (Inra, DEPE, Paris), Réchauchère O.
(Inra, DEPE, Paris)
Authors of the hypotheses for the future of drivers: Mora O. (Inra, DEPE, Paris), de
Lattre-Gasquet M. (Cirad, Paris), Brunelle T. (Cirad, CIRED, Nogent/Marne), Donnars C. (Inra, DEPE,
Paris), Dumas P. (Cirad, CIRED, Nogent/Marne), Le Mouël C. (Inra, SMART, Rennes), Moreau
C. (Cirad, Paris), Réchauchère O. (Inra, DEPE, Paris)
Agrimonde-Terra - June 2016
We thank the scientific coordinators of the thematic workshops on “Cropping systems” and “Livestock systems” for their useful advices during the process of translating cropping and livestock systems’ hypotheses for the future into quantitative hypotheses.
2
Table of content
Introduction ... 3
1. Global context ... 3
3. Climate change and mitigation... 5
4. Food diets ... 10 5. Rural-Urban relationships ... 16 6. Farm structures ... 17 7. Cropping systems ... 18 8. Livestock systems ... 24 Appendix ... 37
3
Introduction
The Agrimonde-Terra’s “land use and food security” system encompasses 3 external drivers: global political, economic and social context, climate change and food diets; and 5 direct drivers: urban-rural relationships, farm structures, cropping systems, livestock systems and forest systems. Hypotheses about the future of these drivers up to 2050 have been built. Then each of these hypotheses has been translated into quantitative hypotheses. On this basis, the land-use change and the agricultural production and trade impacts of each Agrimonde-Terra scenario has been simulated with the GlobAgri-AgT model.
The objective of this technical report is to describe in details the hypotheses about de future of the various drivers as well as the general rules adopted for translating them into quantitative hypotheses readily processible by the GlobAgri-AgT model.
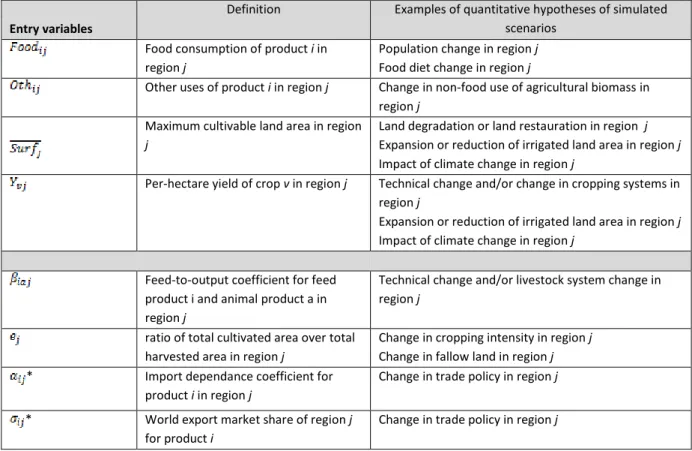
In the following, we describe successively each driver, the general rules adopted for translating its alternative development patterns into quantitative hypotheses, and the consequences of these general rules on concerned entry variables of the GlobAgri-AgT model. The latter is presented in appendix, pointing out its entry variables.
1.
Global context
Land-use systems are strongly influenced by political, economic and social events outside the agricultural and forestry sectors at global, regional and domestic levels. Agrimonde-Terra’s hypotheses on the future changes of the global context are different from the IPCC Shared Socio-economic Pathways (SSPs) but two of our hypotheses are directly inspired by SSP: Conventional development (from SSP5) and Sustainable and cooperative world (from SSP1).
In the past 30 years, the world population has gone from slightly below 5 billion to slightly over 7 billion. Most of the increase has been in Asia where about 62% of the world population lives today. Abundance of natural resources has facilitated economic growth, but their constraints are increasingly questioning future economic pathways as well as the distribution of growth. Natural resources, including land, and unfair land tenure systems have been the cause or implicated in many conflicts. Governance processes have changed, opening to multiple actors as the nation-states, international institutions, transnational corporations, NGOs, community stakeholders, as well as informal groups of interests, and being multiple-scales approaches (global, regional, national and local). In our analysis of future pathways for the global context, we focused on three aspects: political (conflicts, main actors and alliances, trade policies), economic (economic growth and income distribution, energy and climate policies, R&D) and social contexts (equality, health, education, culture).
1.1.
Hypotheses for the future up to 2050
The five pathways for the global context are:
Sustainable and cooperative world: strong commitments towards mitigation of climate change,
regulation of the nutritional quality of food products, health, and a shift to a green economy; states cooperate amongst themselves and with businesses, civil society organizations and international institutions; moderate economic growth (average world Gross Domestic Product
4 per capita of $20,000 in 2050) and liberalized trade; carbon as the cornerstone of energy markets, decrease of energy consumption; inequalities are reduced.
Regionalization and energy transition: States joining in large regional blocs to face together
financial crises, unemployment, pollution, high rates of non-communicable diet-related diseases; principle of “food sovereignty and subsidiarity” at the regional blocs level based on regional food supplies and supported by businesses and civil society organizations; moderate economic growth (average world GDP per capita of $20,000); high level of biomass energy; strong intra-regional trade.
Economic and political fragmentation: series of crises (economic, energy, geopolitical and
ecological) amplifying each other; severe geostrategic tensions, weak access to energy in some regions; low economic growth (average world GDP per capita of $18,000) with huge differences between countries; highly developed informal economy, trade limited to neighbouring countries.
Conventional development led by market forces: alliance between multinational corporations,
investments funds and international institutions; steady economic growth (average world GDP per capita of $24,000) based on low-cost fossil fuel, low trade barriers, confidence in science above all to overcome natural resources’ limits, education and Information and Communication Technologies; large inequalities.
Non-State actors: highly globalized world; economic networks based on NGOs, associations,
multinational companies, foundations and academic institutions; failure of sovereign States to take up the challenges of climate change and poverty; government endeavouring to coordinate hybrid and agile coalitions; decentralized energy production; economic situation of groups dependant on their capacity for networking; large inequalities.
1.2.
Entry variables of the GlobAgri-AgT model and general rules for building the
quantitative hypotheses
Two entry variables of the GlobAgri-AgT model are directly concerned with the future pathways of the global context driver:
- Food consumption which level depends on population change in the various regions and on the change in GDP per capita;
- World export market shares and import dependence coefficients of regions which depend on change in the international trade context (such as trade agreements for instance).
The global context also affects other entry variables of the model but indirectly through other drivers of the system:
- climate change and mitigation: the adopted development path is taken into account when building the quantitative hypotheses on climate change mitigation;
- food diets: the GDP per capita growth is taken into account when building the quantitative hypotheses on daily calories availability per capita and on diet composition;
- cropping systems: the growth rate as an indicator of R&D expenses is taken into account when building the quantitative hypotheses on the future of cropping systems.
5 The general rules for building the quantitative hypotheses on population change on the one hand and on trade coefficients on the other hand are the following:
- Changes in total world and regional population are the same in all micro-scenarios. The median projection up to 2050 provided by the United Nations (2015 revision) is used.
- Import coefficients of regions are exogenously reduced in the “Regionalization and energy transition” future pathway in order to figure the inter-regional trade impact of the supranational regional blocs development as well as the implementation of the “food sovereignty and subsidiarity” principle. From 2010 to 2050, import coefficients for all products are equally reduced by -25% in all regions but the Near and Middle East and North Africa (both regions constrained by their cultivable land). Additional reductions are implemented as to decrease the net import dependence of net importing regions, provided their cultivable and total land constraints. Regional import coefficients are exogenously unchanged in all other 4 global context pathways.
- World export market share coefficients are not changed exogenously whatever the global context pathway.
1.3.
The quantitative hypotheses
The world population reaches 9.7 billion people in 2050, with regional changes between 2010 and 2050 ranging from stability in the European Union (EU 27), Former Soviet Union (FSU) and China, to strong increases in West Africa, East, Central and South Africa (ECS Africa) (+192% and +155%, respectively), North Africa and the Near and Middle East (NME) (+72% and +70%, respectively), and to a lesser extent India (+45%).
3.
Climate change and mitigation
Land use is at the forefront of the climate issue as it is both concerned by its impacts and will be a major actor in its mitigation. It is responsible for just under a quarter (~10 – 12 GtCO2eq per year) of anthropogenic GHG emissions, mainly from deforestation and agricultural emissions from livestock, soil and nutrient management, and among economic sectors has one of the largest potentials for mitigation. There is evidence of the impacts of historical and recent climate change on food production, with a global net loss in average wheat and maize yields of 3.8% and 5.5% respectively relative to what would have been achieved without the climate trends of 1980-2008 (Lobelle et al., 2011). Extreme weather events played an important role in the food crisis of 2007-2008 and continue to multiply.
3.1. Hypotheses for the future up to 2050
We describe climate change patterns to 2050 through three pathways, inspired by the Representation Concentration Pathways (RCP) of the fifth assessment report of the IPCC (Intergovernmental Panel on Climate Change):
Stabilisation of global warming: in a context of strong commitment towards mitigation of
climate change combined with a relatively low climate sensitivity, global temperature changes are maintained well below +1°C to 2050 and changes in precipitation remain limited (<+0.05mm/day in 2100). Crop yields are not significantly affected by climate change both in temperate and tropical zones; elevated CO2 and ozone concentrations have few impacts on crop
6 mitigation options adapted to local situations are considered, including carbon storage in agricultural soils and resource use efficiency measures, to create synergies with yield increases and the limitation of land degradation.
Moderate warming: mitigation of climate change is considered only as a co-benefit of adaptation
measures, as well as reduced food and energy consumption due to lower economic activity and/or energy independency strategies. Global temperature changes reach +1°C in 2050 and changes in precipitation amount to +0.08 mm/day in 2100. The cultivable land area increases in the Northern latitudes while it decreases in tropical regions. The frequency of extreme events (heat waves, floodings etc.) increases, leading to a moderate rise in the inter-annual variability in crop yields. The biogeochemical composition of the atmosphere (CO2, ozone) changes, but
without significantly affecting the yields and quality of crop.
Runaway climate change: in a context of strong dependence on fossil energies, greenhouse gas
emissions continue to rise sharply positioning the climatic system in a scenario corresponding to the IPCC RCP 8.5. Global temperature changes reach +2°C in 2050 and changes in precipitation amount to +0.15 mm/day in 2100. Land area suitable for agricultural production increases by approximately 600 million ha by 2100 (Zabel et al., 2014), which corresponds to an increase of 120 million ha of the cultivable land area (moderately suitable to very suitable lands) in 2050. This mainly concerns Northern latitudes while the cultivable land area decreases in tropical regions. The average quality of the potentially cultivable land decreases: on average at the global scale, per-hectare cereal yield decreases range between -13% and -30% (Müller and Robertson, 2014). Extreme climatic events become more frequent leading to increased inter-annual variability in crop yields.
3.2. Entry variables of the GlobAgri-AgT model and general rules for building the
quantitative hypotheses
Four entry variables of the GlobAgri-AgT model are directly concerned with the future pathways of climate change and mitigation:
- Maximum cultivable area; - Per-hectare yields;
- Livestock feed-to-output ratios;
- Non-food use of biomass depending on retained mitigation options.
One may notice that climate change may also affect maximum pastureland area. Due to data uncertainties and absence of consensus in the literature we did not establish regional maximum permanent pasture area for the 2010 initial situation, nor hypotheses of climate change impacts on this area up to 2050. In our simulations, the pasture area adjusts endogenously without any constraint. The competition for land between arable and permanent crops, pasture and forest uses is analyzed ex-post and is an outcome of our quantitative simulations.
In the same vein, mitigation hypotheses may impact the forest sector and area. As far as the area is concerned, deforestation-afforestation is calculated ex-post as an outcome of the model. It is also checked ex-post that deforestation-afforestation is coherent with mitigation hypotheses. Carbone storage and organic matter in the soils are also part of the mitigation options. They may impact land
7 degradation and crop yield evolution up to 2050. However, such potential impacts are considered in the qualitative analysis but not explicitly taken into account in the quantitative analysis.
Finally, although it is acknowledged that climate change will induce migration of populations (e;g., Brunelle, 2014), we do not take this dimension in our quantitative analysis.
The general rules for building the quantitative hypotheses on the entry variables of the model are as follows:
- We assume that in the 2010 initial situation the maximum cultivable area (i.e., the maximum area which can be devoted to arable and permanent crops) in each region equals the area under suitability indices 1 to 4 according to the GAEZ approach. In the Global Agro-Ecological Zones (GAEZ) approach, land is classified according to its quality or suitability for agricultural production. There are seven classes ranging from “very suitable” to “not suitable”. GAEZ suitability indices 1 to 4 correspond to “very suitable” to “moderately suitable” land.1
- We assume that up to 2050 this maximum cultivable area is affected by climate change. For quantifying the climate change effects we use Zabel et al. (2014)’s results2 and adopt the
following assumptions: i) no change in the “Stabilization of global warming” pathway; ii) change according to Zabel et al.’s results in the “Runaway climate change” pathway; iii) half the change according to Zabel et al.’s results in the “Moderate warming” pathway.
- We assume that climate change is likely to affect the evolution of crop yields induced by changes in cropping systems up to 2050. For quantifying the climate change effects on crop yield evolution we use Müller and Robertson (2014)’s results and adopt the following hypotheses: i) no change in the “Stabilization of global warming” pathway; ii) change according to Müller and Robertson’s results in the “Runaway climate change” pathway; iii) half the change according to Müller et Robertson’s results in the “Moderate warming” pathway.
- Due to data uncertainties and absence of consensus in the literature we did not establish quantitative hypotheses on the impact of climate change en mitigation micro-scenarios on grass and forage yield change, nor on livestock productivity change.
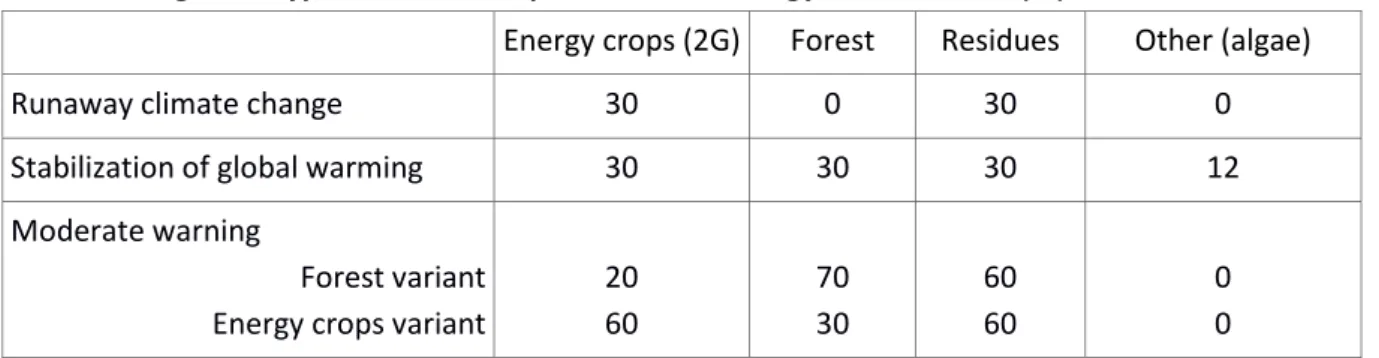
- We assume that up to 2050 food, feed and energy crops are competing on the maximum cultivable area in each region. Regional areas dedicated to energy crops in 2050 result from mitigation hypotheses (Tab. 1). Regional maximum areas available for food and feed crops equal regional maximum cultivable areas minus areas devoted to energy crops. Using a world yield average for energy crops (228GJ/ha in the initial situation, increasing to 304GJ/ha in 2050 due to technical change) mitigation hypotheses result in 106 million hectares devoted to energy crops in both the “Stabilization” and the “Runaway climate change” pathways and in 71 or 212 million hectares in the “Moderate warming” pathwayo. The distribution of these world energy crop areas across regions differs according to climate change pathways: i) in “Stabilization of global warming”, the distribution is based on regional production of biomass for energy of the SSP1/RCP2.6 scenario proposed by the IPCC; ii) in “Runaway climate
1 For more details, see http://www.fao.org/nr/gaez/ 2
More specifically we use updated results kindly provided by Florian Zabel, related to IPCC RCP 2.6 and RCP 8.5.
8 change”, this is the SSP5/RCP8.5 scenario of the IPCC which is used; iii) in “Moderate warming” regions with no fossil energy are producing energy crops first. Then if necessary, regions with fossil energy are starting to produce energy crops, regions having the lowest reserves of fossil energy starting first. In all regions, energy crops are grown on abandoned land.
Table 1. Mitigation hypotheses: world production of energy from biomass (EJ)
Energy crops (2G) Forest Residues Other (algae)
Runaway climate change 30 0 30 0
Stabilization of global warming 30 30 30 12
Moderate warning
Forest variant Energy crops variant
20 60 70 30 60 60 0 0
3.3.
The quantitative hypotheses
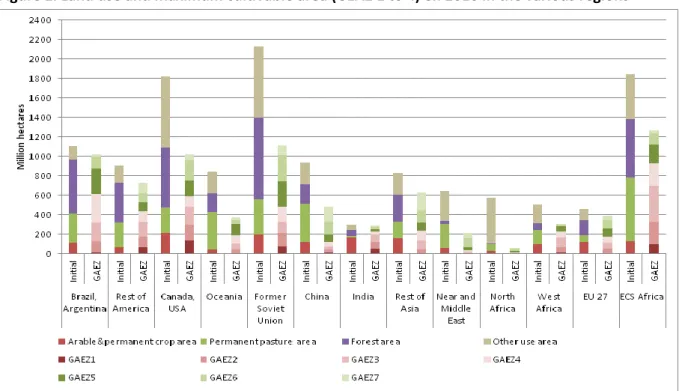
As shown by Figure 1, in 2010, there are 3 regions with observed arable and permanent crops area (cropland area) already exceeding the maximum cultivable area (GAEZ 1 to 4): China, the Near and Middle East and North Africa. For these 3 regions we consider that their 2010 observed arable and permanent crops area constitutes their maximum cultivable area. India and EU 27 have a cropland area nearly reaching the maximum cultivable area. To the contrary, in the American continent, in Former Soviet Union (FSU) and in East, Central and South (ECS) Africa, observed areas devoted to arable and permanent crops are well below maximum cultivable areas. In these regions, the maximum cultivable areas are even greater than the sum of current cropland and pastureland (permanent pasture area). It is important to notice that all these regions are also those exhibiting the world’s largest forest areas. Hence, because of their large cultivable areas, agricultural land expansion is possible in these countries, but this expansion will imply further deforestation (provided that the land already reported under “other use” is not or lees suitable to agriculture, which is the assumption we adopted in this analysis).
9
Figure 1. Land use and maximum cultivable area (GEAZ 1 to 4) en 2010 in the various regions
According to Zabel et al’s results, in a “Runaway climate change” context, the world maximum cultivable area would experience a +120 million ha increase. But this increase would be unevenly distributed (Fig. 2), with regions in Northern latitudes benefiting from increased cultivable land areas (+61 million ha in Canada/USA, +64 million ha in FSU, +14 million ha in China) and tropical regions seeing their maximum cultivable land area to reduce (21 million ha in South and Central America, -10 million ha in Oceania). The most notable change in maximum cultivable area would occur in North Africa, the region losing nearly half of its cultivable area due to the climate change (-13 million ha and -48% compared with 2010 cropland area)
Figure 2. 2010 and 2050 maximum cultivable land area in the various climate change and mitigation pathways (1000 ha)
10 In world average, climate change has a negative impact on change in crop yields up to 2050 (Fig. 3). In average, under the “Runaway climate change” pathway, crop yields in 2050 are -10 to -20% lower than they would have been without climate change impact (like under the “Stabilization of global warming” pathway). At the world level, oilseeds are the most negatively affected crops, particularly soyabean. In contrast, the “sugar plants” aggregate is the only crop which is positively affected by climate change et the global scale, its 2050 yields being +13% greater in the “Runaway” pathway than without climate change impact. Obviously, theses world averages mask wide differences between regions: for instance, the loss in soybean yield due to runaway climate change ranges from -45% (Rest of America) to -5% (FSU), the one in wheat yield from -25% (EU 27) to nearly 0% (China).
Figure 3. Ratio of per-hectare yield in 2050 under the “Moderate” or the “Runaway” climate change pathways over per-hectare yield in 2050 without climate change impact
4.
Food diets
Diets together with demography determine food consumption of agricultural products and thus act indirectly on land use. In the past 30 years, per capita dietary energy availability has increased worldwide, and undernutrition has declined, with large differences between regions. Diet transition is based on: the edible plant oil revolution; a shift towards increased consumption of animal products; increasing consumption of sugars and sweeteners; and declining consumption of legumes, whole-grain cereals and vegetables. In term of food products, nutrition transition is currently based on the diffusion energy-dense, refined and ultra-processed foods (Monteiro et al, 2010). This transition is also responsible for the dramatic increase of overweight and obesity prevalence and diet-related non-communicable diseases such as cardiovascular disease, type II diabetes and cancer. Currently Southern countries are experiencing a rapid nutrition transition and facing a double burden of malnutrition where overnutrition coexists with undernutrition. In our analysis of future diets, we pay attention to four characteristics: food transition patterns; health outcomes; the food value chain; and government food and nutrition policies.
11
4.1. Hypotheses for the future up to 2050
Transition to diets based on ultra-processed products and transnational value chains. A rapid
nutrition transition in developing countries is driven by the global modern value chains based on supermarkets and transnational food companies. It leads to a dietary convergence toward one global diet based on the consumption of ultra-processed foods. It includes vegetable oil, refined cereals, processed meat, salt and added sugars (especially sodas). These diets have strong impacts on public health, obesity or overweight concerning nearly 59% of the world population by 2030, with non-communicable diseases being the major cause of mortality worldwide.
Transition to diets based on animal products and urban style of life. The diet transition is based
jointly on food supply and on urban lifestyle changes, through improved incomes. The diets in 2050 are characterized by high consumption of animal products, fat and added sugars and salts and low consumption of coarse grains, legumes, and vegetables. They lead on average to a significant increase in energy consumption and a reduced diversity of foods. As a result, over nutrition increases, while undernutrition remains significant in remote rural areas and in poor urban settlements.
Regional diversity of diets and food systems. Diets since 2010 have been through diverse and
heterogeneous pathways and have reinforced their regional specificity. Regional supply chains have been reshaped by reconnecting to regional food crops. They are based on value chains mixing regional agroindustries and traditional food supply, which are valuing culinary culture. Cereals, coarse grains, pulses or tubers and roots are the basis of diets with the significance of each product depending on region. This change in diets has prevented growth in the rates of obesity and non-communicable diet-related diseases.
Food diversity for healthy dietary practices. Facing a persistent issue of malnutrition, public
health policies have been implemented to reorient diets toward healthier and more diversified food consumption. Global measures have been taken to limit trade in energy-dense, ultra-processed foods with low nutritional values. Through national health education and policies targeting key players and products of the food systems, diets have become more balanced and diversified with the inclusion of more fruits and vegetables, pulses, increased diversity of seeds and coarse grains, and moderate intake of animal products.
4.2. Entry variables of the GlobAgri-AgT model and general rules for building the
quantitative hypotheses
The food consumption variable is the only entry variable of the GlobAgri-AgT model which is directly concerned with the hypotheses for the future of food diets up to 2050. In addition to population change, the consumption level of each product also depends on the changes in the main characteristics of the food diets, notably the daily calories availability per capita and the composition of the diet.
The general rules that we established for building our quantitative hypotheses relate to both the change in the daily calories availability per capita and the share of the various groups of foods in the diet. They are the following:
- Kilocalories available per capita and per day: in the “Transition” pathway, the daily calories availability is supposed to remain constant relative to 2010 level in regions with high initial
12 levels (developed regions and some emerging regions). It is assumed to converge towards the developed regions’ levels in regions with initial medium and low levels (developing regions and some emerging regions). In the “Regional” pathway, the daily calories availability is assumed constant over 2010-2050 for all regions, except India and ECS Africa which particularly low initial levels are increased. In the “Healthy” pathway, the daily calories availability is supposed to converge towards recommended levels in all regions (Tab. 2). - Composition of the diet: shares of product groups (meat, dairy and eggs, aquatic animal
products, pulses, maize-rice-wheat, other cereals, fruits and vegetables, roots and tubers, sugar and sweeteners, vegetable oils, other products) in the diet are evolving according different trends in the various food diet hypotheses for the future (Tab. 2)
Table 2. General rules for the changes in food regimes over 2010-2050 under the different pathways “Transition – Ultra-processed foods” “ Transition – Animal products“ “Regional “ “Healthy“ Diet energy (Daily calories per capita)
- Regions over 3300 kcal/cap/day in 2010: unchanged up to 2050
- Regions between 3000 and 3300 kcal/cap/day in 2010: increase to 3300 in 2050
- Regions under 3000 kcal/cap/day in 2010: increase to 3000 kcal/cap/day in 2050
- Unchanged relative to 2010 in all regions, except India and ECS Africa: increase up to 2500 kcal/cap/day in 2050
- When used with the “Communities” scenario: -10% reduction in all regions except India and ECS Africa
- Regions over 3000 kcal/cap/day in 2010: decrease to 3000 - Regions under 2750 kcal/cap/day in 2010: increase to 2750 - Regions between 2750 and 3000 kcal/cap/day in 2010: unchanged Diet pattern - Change according to 1998/2008 trends in Brazil. In all regions except Canada/USA: no change relative to 2010 - 2 diet share minimum thresholds: 13.5% for vegetable oils; 10% for animal products - Within the meat group: strong substitution from ruminant meat to poultry meat - In developed regions, unchanged relative to 2010 - In emerging regions, change according to 1998/2008 average trends in developed regions - In developing regions, change according to 1998/2008 average trends in emerging regions
- Within the meat group: substitution from ruminant meat to poultry meat
- In each region, change according to the pattern observed in the region in 1970/72
- Diet share of animal products: 10% minimum threshold
- Diet share of animal products and pulses: 20% - Diet share of cereals: 50%, coarse grains accounting for ¼ to 1/3
- Diet share of fruits and vegetables: 15% - Diet share maximum thresholds: 10% for vegetable oils, 2.5% for sugar and sweetener
- Within the meat group: substitution from ruminant meat to poultry meat
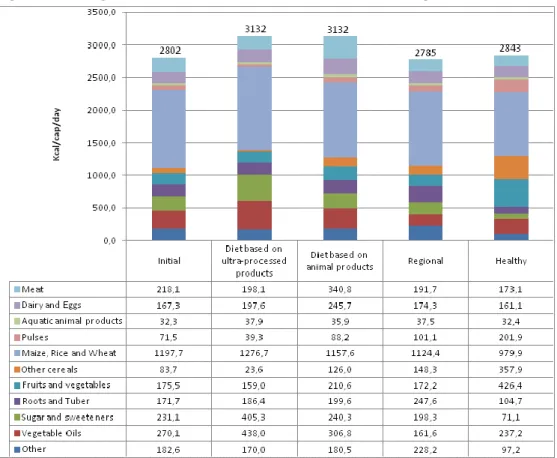
4.3. The quantitative hypotheses
According to our hypotheses, the average world diet makes available more daily calories per capita in 2050 than in 2010 in all food diet pathways except the “Regional” one (Fig. 4). In the latter the daily calories available per capita decrease slightly between 2010 and 2050 despite our assumption of unchanged levels in all regions because over 2010-2050 population has increased more in regions
13 with initial low levels than in regions with initial high levels. The “Transition” pathway is the one involving the highest level of daily calories availability per capita.
As a result of the “Transition to diets based on ultra-processed products” pathway, the world diet has become significantly richer in vegetable oils as well as in sugar and sweeteners in 2050 compared to 2010. Under the “Transition to diets based on animal products”, the most significant change in the world diet pattern between 2010 and 2050 is the increased share of meat and dairy and eggs (+50%). The “Regional” pathway makes the world average diet richer in pulses and above all in roots and tubers. While with the “Healthy” pathway, the world diet involves far more fruits and vegetables, other cereals and pulses and significantly less meat and sugar and sweeteners.
Figure 4. Average world food diet in 2010 and in 2050 following the various food diets pathways
As shown in Figure 5, our hypotheses induce very different changes in food diets from 2010 to 2050 across regions. For developed regions, such as Canada/USA and EU 27, only the “Healthy” pathway lead to significant change in the food diets from 2010 to 2050. While all pathways imply moderate changes in food diets for emerging countries such as China and FSU. In contrast our hypotheses induce significant changes in food diets, whatever the pathway, in developing countries such as North Africa and West Africa, the changes turning to dramatic in India and ECS Africa. In all these regions, the “Transition with animal products” pathway implies a marked rise in the share of animal products, particularly of meat. The “Regional” pathway is the one inducing the lower changes. Let’s examine in more details the food diet changes induced by the various pathways in India and ECS Africa. Two points are in order:
- In both regions, all pathways involve an increase in the daily calories availability per capita. As a sharp increase in population is also expected in both regions (especially in ECS Africa),
14 this means that food consumption of products will increase significantly under all pathways in India and ECS Africa.
- In both regions, all pathways result in a rise in the share of animal products in diets (essentially meat in “Transition with animal products”, meat and dairy and eggs in all other pathways). Once again, joint with the expected population increase, this rising share of animal products in diets will lead to huge increase in food consumption of meat, dairy and eggs under all food diet pathways in India and ECS Africa.
15
Figure 5. Food diets in 2010 and in 2050 following the different food diets pathways in various regions
Canada/USA EU 27
China FSU
16
India ECS Africa
5.
Rural-Urban relationships
Changes in the relationships between urban and rural areas have an impact on land use and food security. Urbanization concentrates individuals and jobs, attracts rural migrants and influences individual diets, but also generates an urban agriculture. Urbanization trends vary from concentration in large cities to growth of medium-size or small cities. On the other hand, rural areas are still based on agriculture activities in most part of the developing world, and the dynamic of absorption of agricultural rural workers by other urban sectors may be questioned. Rural areas often see the development of non-agricultural activities which shape household multiple-activity in a context where circular migration increase between urban and rural areas.
5.1. Hypotheses for the future up to 2050
We elaborate four hypotheses of change in urban and rural areas interactions:
Large metropolitan region with a spatial rupture to rural hinterlands. Massive rural migration
has concentrated the population in large metropolitan centres. This agglomeration is a response to a global dynamic where exchanges (not only financial flows, but flows of information, products and people) are concentrated in a limited number of well-connected megacities. At the individual level, this archipelago economy creates a standardization of lifestyles, where consumerism is dominant and where regional or family solidarity is weakened. With very low relationship to rural areas in the national territory, these megacities are connected via international trade to rural areas which may be far away, taking advantage of low transport costs. Food strategies of urban and rural households rely mainly on the purchase of food items available through national or international markets.
Multilocal and pluriactive households in a rural-urban archipelago. Migration to cities is
temporary and mobility evolves according to employment and income opportunities in urban and rural areas. Farming remains a core activity within rural households, but the share of non-farm activities in the revenues of rural households increases as mobility intensifies. Circular migrants find employment either in cities or other rural areas, where the sectors of industry, services, food trade and agriculture (cash crops) are located. Food strategies of multilocal
17 households combine supplies through family networks and supplies from regional or international markets.
Rural areas integrated within urban networks through value chains. Migration toward medium
cities has generated a multipolar urbanization process. Networks of cities and rural areas emerged and developed synergies between agriculture, food processing and local markets. Medium cities have an increasing role as intermediate between rural areas and large cities. Rural households’ diversified activities now include food processing or trade. Households’ food strategies rely on traditional products produced in the region and accessible thanks to regional markets.
Urban fragmentation and counter-urbanization. The end of rural migration to the megacities
was based on increasing congestion problems, unemployment and lack of access to housing and basic services. It resulted in a fragmented urbanization through a limited growth of large agglomerations and by a redeployment of population growth to cities and small towns. This process led also to an increase in rural populations in some emerging countries with high birth rates, these rural areas experiencing a growth in agricultural workers. Urban fragmentation has generated ‘food deserts’ and food supply is now provided mainly by the informal sector, which relies on community and family networks.
The hypotheses for the future of rural-urban relationships up to 2050 have not been translated into quantitative hypotheses. In addition to the food consumption variable through food diet change, there are two entry variables of the GlobAgri-AgT model which are potentially influenced by changes in rural-urban relationships: the maximum cultivable area and the maximum pastureland area. Indeed, both areas may expand or decrease according the change in rural-urban relationships. Unfortunately we did not find enough empirical evidence about the impact of rural-urban relationships on available land to agriculture and we were not able to establish sound quantitative hypotheses for this driver of our “land use and food security” system.
6.
Farm structures
Farm structures are the basic units for production and major users of land. Agricultural structures are extremely diverse ranging from small family farms to large-scale farms. International reports tend to underline the economic and social importance of small farms based on family labour, and their potential productivity gains. Large-scale farming is based on financial investment capacities. Farm structures are characterised by a combination of factors relating to the land, capital and labour used in production and by their integration into social and economic dynamics. Access to land is a major issue for farm structures, for women in particular. Taking these issues into account, Agrimonde-Terra identified six pathways for future farming structures.
6.1. Hypotheses for the future up to 2050
Marginalized farms for livelihood survival: farmers poorly connected to markets because of
their isolated location or because their exclusion from development policies; subsistence farming.
Hit-and-run agro-investments: large agro-projects raising financial funds, hiring labour and
18 Independent farms but commercial dependency: family farms contracting with an industrial
private or public enterprise that organizes collection, processing and marketing of standardized products; farmer’s responsibility for labour and social benefits.
Farms producing goods and services to surrounding communities: farmers providing services to
users through mediation of local governments and communities; innovations in tune with agroecology and circular economy.
Agricultural cooperatives emphasizing quality: commercial farms connected with either local or
international markets; added value based on collective action and voluntary standard of quality. Resilient farms embedded in urban processes: family farms coping with disruptions; farming
that guarantees a minimum income and access to food; new multi-active strategies based on farms.
The GlobAgri-AgT model has no entry variables allowing to deal with the farm structures. Hence the hypotheses about the future of farm structures up to 2050 have not been translated into quantitative hypotheses.
7.
Cropping systems
Future cropping systems must contribute to food and nutrition security, animal feed, and the supply of biomass for energy and materials; they are part of the environment and of rural livelihoods. In the past, in Northern countries and a few regions in the South, green revolutions have led to the separation of crops and livestock, regional specialization, globalization and mechanization. Other developing regions have increased their yields through an intensification of labour. These diverse intensification processes lead to a degradation of natural resources which puts their sustainability into question. At the same time, a number of developing regions have experienced stagnation or poor increases in yields. Agrimonde-Terra examined how farmers, in interaction with other components of the food system, public policies and research and extension, could modify cropping systems while taking into account local bio-physical and socio-economic conditions, and making the best use of productive and human resources.
7.1. Hypotheses for the future up to 2050
Four distinct pathways for the evolution of cropping systems and an impasse are considered, each addressing current challenges in different ways:
Conventional intensification: increasing yields via simplified cropping systems relying on
industrial inputs; end-of-pipe approaches to the negative impacts generated; uncertainty regarding the capacity to overcome or respond to a variety of socio-economic pressures.
Sustainable intensification: intensification of production combined with the reduction of
environmental impacts; input substitution or maximizing input efficiency thanks to new technologies.
Agroecology: major redesign of systems emphasizing crop diversification, agroforestry and mixed
crop-livestock farms relying on self-generated biological regulation and local recycled inputs to produce economic and agro-ecosystemic resilience.
19 Collapse of cropping systems: evolution based on conventional intensification towards a number
of potential impasses resulting from cropping system weaknesses: climatic, biotechnical or linked to the socio-economic context such as lack of labour, land access insecurity, lack of access to inputs, to credit etc.
7.2. Entry variables of the GlobAgri-AgT model and general rules for building the
quantitative hypotheses
Two entry variables of the GlobAgri-AgT model are directly concerned with the hypotheses for the future of cropping systems:
- Per-hectare yields;
- Cropping intensity ratios (as measured by the harvested area over the cultivated area in each region, cf. the appendix describing the model).
We adopted 3 general rules in order to translate the cropping systems pathways into quantitative hypotheses for regional per-hectare yield changes:
- We calculated current yield gaps for Agrimonde-Terra’s crops and regions using potential and observed per-hectare yields provided by the GAEZ database portal. Then we assumed a level of yield gap reduction between 2010 and 2050, which is differentiated according to cropping pathways, and which we applied uniformly to groups of crops (cereals, protein seeds and other crops) and (Tab. 3).
- We hypothesize that there is induced technical change, which results in greater rate of technical change for crops which are most demanded at the world level. Let’s consider a group of crops, say cereals, the above described yield gap reductions applies to the average cereal yield. Then we assume that within the cereal groups, cereal crops which are most demanded will benefit of above-average yield gap reductions, while cereal crops which are less demanded will experience below-average yield gap reductions. The retained indicator for “most demanded/less demanded” crops is the change in the respective crop shares in the average world diet under the various food diet pathways (Tab. 3)
- Grass and forage crops benefit from the same yield gap reduction than other crop groups. As far as cropping intensity ratios are concerned, we adopted the following general rules:
- Based and existing literature and expert knowledge, it was not possible to differentiate the impacts of the various cropping pathways on cropping intensity ratios. Hence we consider that all pathways have the same impacts on these ratios.
- We used Ray and Foley (2013)’s results in order to get a first assessment of potential changes in regional cropping intensity ratios up to 2050. However, as ray and Foley’s work only considers the potential change in temperature, we revised this first assessment, taking into account the potential change in water availability for agriculture in the various regions as well as expert knowledge (Fig. 7).
Finally, we assume that in a low economic growth context, less budget resources are devoted to R&D so that the rate of technical change is lower. This is why when the “Agroecology” pathway is used in the “Communities” scenario (which involves a sluggish economic growth), the applied yield gap reductions and changes in cropping intensity ratios are less favourable.
20
Table 3. General rules for translating the various cropping systems pathways into quantitative hypotheses
Average yield gap reduction
Higher (H)/Lower (L) yield gap reduction for specific crops
“Conventional intensification”
combined Ttransition-Ultraprocessed
combined with Transition- animp
-50%
Grains: H maize/L coarse grains Oilseeds and pulses: L pulses Other products: H sugar crops Same as above +
Grass and forage: H “Sustainable intensification”
combined with Healthy
combined with Regional
-40%
Grains: H coarse grains/L others Oilseeds and pulses: H pulses/L others
Other products: H fruits and vegetables/ L Others Grass and forage: 0
Grains: H coarse grains, maize/L others Oilseeds and pulses: H pulses, other oilcrops, soybean/L others
Other products: H roots and tubbers/ L Others Grass and forage: 0
“Agroecology”
Combined with high economic growth Combined with low economic growth
-30% -15%
combined with Healthy
combined with Regional
Grains: H coarse grains/L others Oilseeds and pulses: H pulses/L others
Other products: H fruits and vegetables/ L Others Grass and forage: 0
Grains: H coarse grains, maize/L others Oilseeds and pulses: H pulses, other oilcrops, soybean/L others
Other products: H roots and tuber/ L Others Grass and forage: none
“Collapse” 0%
As shown in Table 3, in our quantitative analysis, we assumed that in average crop yield growth is greater in the “Conventional intensification” pathway that in both the “Sustainable intensification “ and the “Agroecology” pathways. Indeed we considered that intensifying cropping systems while reducing negative externalities, as involved in the “Sustainable intensification” pathway, put more constraints on yield growth, so that in average per-hectare yield performance reached under “Sustainable intensification” is lower than per-hectare yield performance reached under “Conventional intensification”. In the same vein, we assumed that re-designing cropping systems towards higher autonomy regarding input use is even more constraining in terms of yield growth performance.
These hypotheses, which are key factors as regards the land-use change effects of the scenarios, are controversial and were extensively discussed with the Scenario Advisory Committee of Agrimonde-Terra. First of all, as conventional intensive systems are potentially more damaging for natural resources (including soil fertility), their potentially higher yield performance is not secured in a
long-21 term perspective.3 In contrast, the long-term likely beneficial effect of systems based on agro-ecology, for instance on soil fertility (Kremen and Miles, 2012) could balance the likely stronger constraints on yield performance of these systems in the short to medium term. Secondly, high yielding agro-ecological systems with multi-cropping have been described, especially in developing countries (Pretty et al., 2006; Altieri et al., 2011). These studies do not actually compare situations which differ only in the cropping system used however. Such comparisons have been undertaken, but between organic and conventional agriculture only (de Ponti et al., 2012; Seufert et al., 2012), with differences in yield performances ranging from 40% to +10%, and average gap in the 30% to -20% range, depending on the criteria used for comparison.
Although we acknowledge that agro-ecology differs from organic systems, we differentiated our quantitative hypotheses on average yield gap reduction between “Conventional intensive” and “Agroecology” pathways on this existing literature.
7.3. The quantitative hypotheses
The per-hectare yield of different crops in 2010 and in 2050 under the various cropping systems pathways (joined with the different food diet pathways) are reported in Figure 6. Let’s remind that in Figure 6, yield changes between 2010 and 2050 result only from the changes in cropping systems: the climate change impact is not taken into account. Obviously, when simulating the whole scenarios, the 2050 yields are those including both the impacts of changes in cropping systems and the impacts of the climate change. Five main points may be underlined:
- Following our general rules, per-hectare yields increase between 2010 and 2050 with all cropping systems except the “Collapse” one (where yields are unchanged), for all crops in all regions, except those exhibiting initial zero yield gaps (such as rice in Rest of India for instance). For the latter, per-hectare yields are constant in 2050 compared to 2010. In all other situations, whatever the cropping system pathways, the higher the initial yield gap, the higher the yield increase over 2010-20150.
- Following our general rules, per-hectare yield increases between 2010 and 2050 are lower under both the “Agroecology with low economic growth” and the “Collapse” pathways than under the other pathways. For the main current cereals (Maize, rice and wheat) and oilseeds (soyabean) and for sugar crops, in all regions, yield increases over 2010-2050 are the highest with the “Conventional intensification” pathway, and are greater with the “Sustainable intensification” pathway than with the “Agroecology” pathway.
- The situation is different for other crops such as other cereals, pulses, fruits and vegetables and roots and tubers, which consumption increases more with the “Healthy” and “Regional” diets. For these crops, in all regions, due to our induced technical change hypothesis, yield increases between 2010 and 2050 are higher with both the “Sustainable intensification” and the “Agroecology” pathways than with the “Conventional intensification pathway.
3 Let’s remind that in our scenarios the “Conventional intensification” pathway for cropping systems is used
jointly with the “Runaway global warming” climate pathway. As this climate pathway involves higher negative impacts on per-hectare yield growth, we take into account, at least partly, the damaging impacts of the degradation of resources on the long-term yield performances of conventional intensive cropping systems.
22 - Whatever the crop and the region, yield increases over 2010-2050 are greater under the
“Sustainable intensification” than under the “Agroecology” pathway.
- In average, whatever the pathway of the cropping systems, developing regions experience greater crop yield increases than other regions.
Changes in the cropping intensity ratios by region are shown in Figure 7. Our general rules imply that cropping intensity ratios in 2050 are equivalent under “Conventional intensification”, “Sustainable intensification” and “Agroecology with high economic growth”. They are lower under under “Collapse” and when the economic context is defavourable (“Agroecology with low economic growth”). Figure 7 suggests that from 2010 to 2050, following our hypotheses, cropping intensity is likely to increase only in a few regions: ECS Africa, Rest of Asia, South and Central America and, to a lesser extent, Oceania and FSU.
Figure 6. Per-ha yield in 2010 and in 20150 under the various cropping systems pathways 6.a. Maize
23
6.c. Wheat
6.d. Soyabean
24
6.f. Pulses
Figure 7. Cropping intensity ratios in 2010 and 2050 under the different cropping systems pathways in the various regions
8.
Livestock systems
Livestock systems are major users of land either directly through grazing or indirectly through the production of animal feed. At the world level pastures cover about 2.2 times more land than arable and permanent crops. In the past 40 years, meat and other animal products have been significant elements of the nutrition transition in developed and emerging countries; demand increased in connection with rising incomes and was a major driver of deforestation. But during the past two decades a number of countries in the developing world have seen their animal products consumption remaining low. At the same time, a shift from ruminant to monogastric meat has reinforced the demand for animal feed crops, with the share of poultry meat rising from one-sixth of world meat production in 1970 to one-third today (Alexandratos and Bruinsma, 2012). Based on trends in animal feed, efficiency of animal systems, crop-livestock synergies, and herd mobility, four hypotheses for the future of livestock systems were produced.
25
8.1. Hypotheses for the future up to 2015
Conventional intensive livestock: this pathway is based on the almost unlimited availability of
key production factors (land and water, capital, inputs and labour) at the global scale. It involves a concentration of animals, specialization of activities, genetic improvement, use of antibiotics, medications.
- With imported resources: global availability of key production factors, imports of resources (feed, genetics, medication etc.). These systems rely on international trade and are sensitive to energy and transport costs. For importing regions, they involve a dependency on land in other regions.
- With local resources: availability of key production factors at a regional scale;
regionally-produced feed (forage, concentrates and by-products). In countries where land availability is restricted, these livestock systems could be in competition with crop production.
Agro-ecological livestock on land in synergy with agriculture or urbanisation: is based on
strong autonomy of the system in terms of feed and input use. It means to use local lands for feed and pasture, limiting inputs and negative externalities. It relies on the production of hardy animals, the development of their adaptive capacity regarding feed and animal health, and the search for feed and protein autonomy through combinations of livestock and crops.
Livestock on marginal land: corresponds to the raising of small and large ruminants in extensive
or pastoral systems. It is based on grazing herds on land with medium to low agronomic potential. It requires specially adapted livestock management (production schedule, birth and density), but can lead to degradation of marginal lands (some practices may avoid soil degradation nevertheless).
Backyard livestock: these systems are based on synergies between production and the
environment and low dependence on inputs and feed concentrates (using urban or industrial waste). They involve increased intensity in labour.
8.2. Entry variables of the GlobAgri-AgT model and general rules for building the
quantitative hypotheses
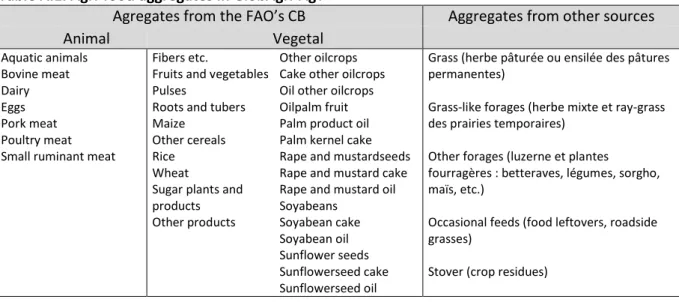
In GlobAgri-AgT, regional livestock systems are quantitatively described and modeled based on data from Herrero et al. (2013).4 In each region 5 livestock sectors are considered (dairy, beef, small ruminants, pork and poultry); they produce 6 animal products (milk and dairy, beef meat, small ruminant meat, pork meat, poultry meat and eggs). Each ruminant livestock sector comprises 4 production systems (Herrero et al.’s so-called mixed, pastoral, urban and other systems). Each monogastric sector covers 2 production systems (Herrero et al.’s so-called urban and other systems). Hypotheses for the future of livestock systems have been quantified based on two entry variables of the GlobAgri-AgT model:
- regional feed-to-output ratios (measuring the quantity of dry matter feed by unit of output produced) of each system in each sector;
4
26 - regional shares of the different production systems in the total output production of the
considered sectors.
In other words, we assume that, in each region, the overall productivity of a livestock sector (as measured by its global feed-to-output ratio) may change between 2010 and 2050 through both the change in the feed-to-output ratios of the various systems in the sector (measuring the mixed effects of changes in the productivity per animal, in animal diseases and mortality and in the efficiency of feed rations) and the change in the relative shares in production of these various systems.
The general rules adopted to quantify the livestock systems pathway of change are the following. The apply at the regional level:
- each future pathway is associated with one or two specific production systems per sector: the chosen systems are those where changes are occurring, other systems remain constant over 2010-2050. For each livestock systems pathway, production systems concerned by changes are chosen as those fitting the best the dynamics involved in the pathway (Tab. 4); - for production systems experiencing changes between 2010 and 20150, feed-to-output
ratios are assumed to change according to projections to 2030 provided by Bouwman et al. (2005). This rule applies to all regions except West Africa and Rest of Africa. In these both regions, we assume that feed-to-output ratios change two times faster than expected in Bouwman et al.’s projections for the beef sector.
- for all production systems, shares in the total production of concerned sectors are increased or decreased, depending on the pathway of change (Tab 4.).
- In the “Conventional intensive livestock with local resources” pathway, the composition of feed rations of mixed systems in ruminant sectors and of urban systems in monogastric sectors are changed so that imported feedstuffs are replaced by locally produced feedstuffs. A locality indicator is first defined as to select the local feedstuffs, then within the energy-rich feed group and within the protein-rich feed group, local feedstuffs replace imported feedstuffs provided the energy content and the dry matter content of the ration remain unchanged. The balance of final rations in terms of protein is checked ex-post.
27
Table 4. General rules for translating the various livestock systems pathways into quantitative hypotheses
Conventional intensive livestock
Agroecological livestock Livestock on marginal land Backyard livestock Change in feed-to-output ratios
Ruminant Mixed Pastoral Urban Other Monogastric Urban Other
Increase (Bouwman et al.) Increase (Bouwman et al.)
No change No change Increase (Bouwman et al.)
No change
Increase (Bouwman et al.) Increase, (Bouwman et al.)
No change No change No change No change
Increase (Bouwman et al.) Unchanged
No change No change Increase (Bouwman et al.)
No change No change No change No change No change No change No change Changes in production shares
Ruminant Mixed Pastoral Urban Other Monogastric Urban Other Increase Decrease Decrease Decrease Increase Decrease Increase No change Decrease Decrease Decrease Increase Decrease Increase Decrease Decrease Increase Decrease No change No change No change No change No change No change
8.3. The quantitative hypotheses
The detailed analysis of initial data shows that as far as ruminant sectors are concerned, there are some characteristics in mixed and pastoral systems, which are constant across regions and sectors:
- whatever the sector and the region, the mixed systems uses more concentrates in feed rations. The pastoral system uses mostly grass in feed rations;
- whatever the sector and the region, the mixed system is more efficient in transforming feed into animal products (lower feed-to-output ratios) than the pastoral system (Fig. 8). There are some notable exceptions however: in Western and ECS Africa where ruminant production systems are particularly poor performer in terms of feed-to-output ratios compared to all other regions, pastoral systems perform better than mixed systems in the dairy and the small ruminant meat sectors;
- whatever the sector and the system, West Africa is the worst performer in transforming feed into animal product outputs, followed by ECS Africa and India (except for dairy) but with significant gaps. To this regard, Figure 8a shows that performances of West African and Indian beef sectors in terms of feed-to-output ratios are totally disconnected from those of other regions, especially for pastoral systems. There are some objective reasons for such poor performances of beef sectors in both regions (where animals are raised and fed for other reasons and objectives than producing meat). But a question remains regarding the extent of the gap with other regions.
Initial data suggest that, for ruminant sectors, “Urban” and “Other” systems involve very different realities from one region to the other: their feed-to-output ratios differ widely across regions and there is no general rule emerging regarding the ranking of both systems relative to the mixed and the pastoral systems; in the same vein the composition of the feed rations of “Urban” and “Other”
28 systems is so variable from one region to the other than it does not provide a constant characteristic that would help to define such systems.
As far as monogastric sectors are concerned, initial data shows constant characteristics across regions and sectors, which allow for a quite clear definition of the “Urban” and “Other” systems:
- comparing feed rations of both systems indicates that urban systems’ rations are richer in concentrates while other systems’ rations are richer in so-called occasionals (food leftover, see Box 1 in appendix). This suggests that “Urban” systems are likely to correspond to industrial systems while “Other” systems seem closer to backyard-type systems;
- “Other” systems are usually better performers in transforming feed into animal products outputs (Fig. 8). This result which may appear as surprising could result from a wrong reporting (underestimation) of the quantities of occasional fed to animal rather than indicating higher performances of “Other” systems compared to “Urban” systems.
Finally, whatever the sector, initial data show that:
- within sectors, feed-to-output ratios vary widely across production systems and across regions. The differences across regions are significantly more marked for ruminant sectors than for monogastric sectors. Monogastric production systems are indeed more homogenous across the world than ruminant systems which are far different from one region to the other (Fig. 8);
- whatever the sector, livestock systems are far more efficient in transforming feed into animal product outputs in developed countries than in developing countries (Fig 8.).
- as far as ruminant sectors are concerned, mixed systems have usually the highest share in total production. Notable exceptions are Oceania where the production shares of mixed systems are particularly low in the beef and dairy sectors, and the American continent exhibiting low production shares for their mixed systems for small ruminant meat (Fig. 9); - Concerning monogastric sectors, urban systems produce the quasi-totality of meat outputs in
developed and emerging countries. In developing countries, other systems have usually the highest production share. One may notice the particularly low production share of urban systems in India (Fig. 9).
Following our general rules, applied reductions on feed-to-output ratios (Fig. 10):
- do not differ between “Conventional intensive livestock” with imported or local resources and “Agroecological livestock” for ruminant sectors. Indeed, in contrast to our quantitative hypotheses regarding crop systems pathways, we were not able to find evidence of any performance gaps (in terms of feed-to-output ratios) between conventional and agroecological systems. Hence the only difference in global performance changes in ruminant sectors lies in the diverging evolution of production shares between conventional and agroecological livestock pathways: in the first pathway, the production shares of mixed systems increase to the detriment of all pastoral systems, while in the second pathway, the production shares of the mixed systems increase to the detriment of urban and other systems, the shares of pastoral systems remaining constant (Tab. 4);
- do not differ between “Livestock on marginal land” and “Backyard livestock” for ruminant sectors: no change is applied in both sectors;
29 - do not differ between “Conventional intensive” with imported and local resources and “Livestock on marginal land” for monogastric sectors, while no change is applied in “Agroecological livestock”. Based on expert knowledge, we considered that shifting to agroecological systems would not allow to gain any efficiency in monogastric sectors as far as feed-to-output ratios are concerned;
- are significantly greater in developing regions than in developed regions. For the latters, Bouwman et al.’s projections to 2030 suggest that nearly no further improvement in efficiency (as measured by feed-to-output ratios) of mixed and pastoral systems could be realized in the dairy, pork and poultry sectors
Finally, following our general rules and due to initial data, our quantitative hypotheses generally lead to:
- improvement of the global efficiency of ruminant sectors under the “Conventional intensive” pathway (with imported and local resources) and the “Agroecological” pathways; stagnation or decrease of this global efficiency under the “Livestock on marginal land” and the “Backyard” pathways;
- ambiguous results regarding the global efficiency of monogastric sectors, mainly due to the initial better performances of “Other” systems in terms of feed-to-output ratios, which contribute to deteriorate the global efficiency of the sectors when the production share of these “Other” systems are adjusted down.
Figure 8. Livestock feed-to-output ratios for the different production systems in the various sectors in the initial 2010 situation (kg dry matter feed/kg output animal product)
30
8.b. Small ruminant meat
31
8.d. Pork
32
Figure 9. Shares of the various production systems in total animal product production of sectors, in the initial 2010 situation in the different regions
Beef meat Small ruminant meat
Dairy Pork meat