HAL Id: hal-00318299
https://hal.archives-ouvertes.fr/hal-00318299
Submitted on 29 Mar 2007
HAL is a multi-disciplinary open access
archive for the deposit and dissemination of
sci-entific research documents, whether they are
pub-lished or not. The documents may come from
teaching and research institutions in France or
abroad, or from public or private research centers.
L’archive ouverte pluridisciplinaire HAL, est
destinée au dépôt et à la diffusion de documents
scientifiques de niveau recherche, publiés ou non,
émanant des établissements d’enseignement et de
recherche français ou étrangers, des laboratoires
publics ou privés.
Geotail observations of temperature anisotropy of the
two-component protons in the dusk plasma sheet
M. N. Nishino, M. Fujimoto, T. Terasawa, G. Ueno, K. Maezawa, T. Mukai,
Y. Saito
To cite this version:
M. N. Nishino, M. Fujimoto, T. Terasawa, G. Ueno, K. Maezawa, et al.. Geotail observations of
temperature anisotropy of the two-component protons in the dusk plasma sheet. Annales Geophysicae,
European Geosciences Union, 2007, 25 (3), pp.769-777. �hal-00318299�
www.ann-geophys.net/25/769/2007/ © European Geosciences Union 2007
Annales
Geophysicae
Geotail observations of temperature anisotropy of the
two-component protons in the dusk plasma sheet
M. N. Nishino1, M. Fujimoto1, T. Terasawa2, G. Ueno3, K. Maezawa1, T. Mukai4, and Y. Saito1 1ISAS/JAXA, Kanagawa 228-8510, Japan
2Tokyo Institute of Technology, Tokyo 152-8551, Japan 3Institute of Statistical Mathematics, Tokyo 106-8569, Japan 4JAXA, Tokyo 100-8260, Japan
Received: 4 December 2006 – Revised: 12 February 2007 – Accepted: 1 March 2007 – Published: 29 March 2007
Abstract. In search for clues towards the understanding of the cold plasma sheet formation under northward IMF, we study the temperature anisotropy of the two-component pro-tons in the plasma sheet near the dusk low-latitude bound-ary observed by the Geotail spacecraft. The two-component protons result from mixing of the cold component from the solar wind and the hot component of the magnetospheric ori-gin, and may be the most eloquent evidence for the transport process across the magnetopause. The cold component oc-casionally has a strong anisotropy in the dusk flank, and the sense of the anisotropy depends on the observed locations: the parallel temperature is enhanced in the tail flank while the perpendicular temperature is enhanced on the dayside. The hot component is nearly isotropic in the tail while the perpen-dicular temperature is enhanced on the dayside. We discuss possible mechanism that can lead to the observed tempera-ture anisotropies.
Keywords. Magnetospheric physics (Magnetotail; Magne-totail boundary layers; Plasma sheet)
1 Introduction
It has been known that the near-Earth plasma sheet be-comes cold and dense when the interplanetary magnetic field (IMF) points northward (e.g. Zwolakowska et al., 1992; Zwolakowska and Popielawska, 1992; Terasawa et al., 1997; Nishino et al., 2002; Wing et al., 2005). Origin of such cold plasma sheet is an important unsolved issue of mag-netospheric physics. Because the trend of low temperature is more typical in the dawn and dusk flank regions than in the midnight region, the cold plasma is thought to be of solar wind origin and to come through the flanks (Terasawa et al., 1997). As a candidate for mechanism of plasma transport Correspondence to: M. N. Nishino
across the magnetopause as well as the cold plasma sheet for-mation, Song and Russell (1992) proposed double high lat-itude reconnection whose evidence was given through sim-ulations (Li et al., 2005; Øieroset et al., 2005) and obser-vations (Onsager et al., 2001; Lavraud et al., 2005, 2006). Kelvin-Helmholtz (KH) instability (Fairfield et al., 2000) has also been suggested with support from both simulations (e.g. Otto and Fairfield, 2000; Nykyri and Otto, 2001; Matsumoto and Hoshino, 2006) and observations as well (e.g. Hasegawa et al., 2004). However, the plasma transport mechanism across the magnetopause is still under debate, and basic sig-natures of the cold plasma have not been well understood.
As a characteristic of the near-Earth cold plasma sheet, it has been pointed out that cold and hot protons occasionally coexist in the plasma sheet near the magnetopause (Eastman et al., 1976; Sckopke et al., 1981). Especially, it is on the duskside that cold and hot proton components coexist in the plasma sheet under northward IMF (Fujimoto et al., 1998; Hasegawa et al., 2003; Nishino et al., 2005; Wing et al., 2005). It is believed that these two components have separate origins: the two-component protons result from spatial mix-ing of the cold component of direct solar wind origin and the hot component of magnetospheric origin. On the duskside the distribution function of protons gradually changes from two-component to one-component status during prolonged northward IMF intervals (Nishino et al., 2005), which im-plies that the two-component protons are in the early stage of ion mixing. Therefore, the study of each component char-acteristics is important to understand the formation of the cold plasma sheet under northward IMF. However, quanti-tative analysis of each component has not been performed from in situ observations. While Wing et al. (2005) showed the existence of two components from a statistical study of plasma sheet ions remote-sensed from low altitude satellites, the limitation of this data set is that temperature anisotropies can not be investigated. Traver et al. (1991) showed a case where low energy protons in the dusk flank plasma sheet have
770 M. N. Nishino et al.: Temperature anisotropy of the two-component protons in the dusk plasma sheet
(a) (b) (c)
Solar wind data (from Wind spacecraft)
1000 0000 0200 0400 0600 0800 (UT) IM F la t. (cm -3) d en si ty b ul k sp ee d (d eg ) (k m /s ) -90 -450 45 90 0 10 20 30 0 100 200 300 400 500 0000-1000 UT, 24 March 1995
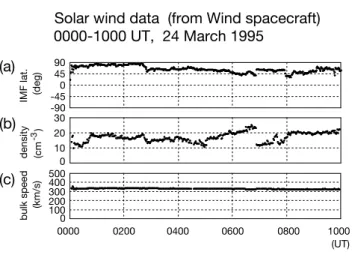
Fig. 1. Solar wind data between 00:00–10:00 UT on 24 March 1995 obtained by the Wind spacecraft. From the top, (a) latitudinal angle of the IMF, (b) proton density, and (c) bulk flow speed are plotted.
parallel anisotropy under northward IMF, while Wing et al. (2005) pointed out perpendicular anisotropy of cold protons on the duskside referring the data shown by Hasegawa et al. (2003). In this paper we study temperature anisotropies of both the cold and hot proton components in the dusk plasma sheet. We will discuss possible mechanism that can lead to the observed temperature anisotropies.
2 Instrumentation and fitting method
We use data from three-dimensional (3-D) ion distribution functions obtained every 12 s by the low energy particle (Geotail/LEP) experiment (Mukai et al., 1994) and the mag-netic field data obtained by the flux-gate magnetometer (Geo-tail/MGF) (Kokubun et al., 1994). The ion energy-per-charge analyzer of LEP-EAi detects ions with energy be-tween 32 eV/q and 39 keV/q, which covers most of the typ-ical energy range of plasma sheet ions. In order to ob-tain plasma moment parameters, such as densities, veloci-ties, perpendicular and parallel temperatures, separately for cold and hot ion components, we utilize a two-Maxwellian mixture model with a maximum-likelihood scheme (Ueno et al., 2001). In this scheme the total ion density is calculated from observed total counts (see Ueno et al., 2001, for de-tails). We denote these temperature parameters as TC⊥, TCk, TH⊥, and THk, respectively. Solar wind parameters observed by the Wind and the ACE spacecraft are obtained from the CDAWeb.
3 Case studies
3.1 24 March 1995 event (TCk>TC⊥)
We perform a case study of two-component protons in the dusk plasma sheet observed on 24 March 1995 when the IMF pointed strongly northward. The solar wind data between 00:00–12:00 UT from the Wind spacecraft (at X∼219 RE) are shown in Fig. 1, where (a) the latitudinal angle of the IMF, (b) the proton density, and (c) the bulk proton speed are plotted.
On the day Geotail came from the dusk magnetosheath into the magnetosphere and observed the cold plasma sheet in the midst of the prolonged northward IMF interval (Fu-jimoto et al., 1998; Fairfield et al., 2000). Figure 2a shows the Geotail ion observations between 09:00–10:00 UT. From the top, energy-time (E-t) diagrams of sunward and tailward ions, temperatures and densities of cold and hot components of protons are shown. The perpendicular (parallel) temper-ature is shown by the green (blue) points, the density of the cold (hot) component is shown by the blue (red) points. Before 09:10 UT Geotail stayed in the low-latitude bound-ary layer (LLBL) with cold dense tailward flow, and after 09:11 UT it was in the stagnant cold plasma sheet where two peaks are evident in the sunward and tailward E-t diagrams. At 09:10 UT Geotail was located at (−15.3, 18.4, 2.2) RE in the GSM coordinates, moving gradually inward from the dusk to the midnight region.
Throughout the interval after 09:11 UT, the cold proton component had strong parallel anisotropy, TC⊥/TCk∼0.47, where TC⊥ and TCkwere about 100 eV and 210 eV, respec-tively. The hot component has much weaker anisotropy than the cold component, with the perpendicular and parallel tem-peratures (TH⊥ and THk) being 1.9 keV and 2.2 keV which give TH⊥/THk∼0.87. The average densities of the cold and hot components were about 2.2 cm−3and 0.3 cm−3, respec-tively, which means that the main component in the plasma sheet was the cold one, although thermal pressures of the two components were comparable to each other. The parallel anisotropy of the cold proton component is consistent with a past study by Traver et al. (1991) who pointed out parallel anisotropy of cold protons in the tail-flank plasma sheet on the duskside under northward IMF.
We also compare the temperature of the cold component with the kinetic energy of the solar wind protons. Because the solar wind speed was about 330 km/s (∼0.6 keV) during this event, the perpendicular and parallel temperatures (ther-mal energy) of the cold component nor(ther-malized by the kinetic energy of the solar wind protons were as low as 0.17 and 0.35, respectively. The normalized parallel temperature is comparable to cold component temperatures obtained from DMSP observations shown by Wing et al. (2005), while the normalized perpendicular temperature is much lower than them. The temperatures and density of the hot component are similar to those in other duskside event (Wing et al.,
(b) Ion PSD
0930:10-0930:22 UT
(a) Ion parameters 0900-1000 UT
Geotail LEP-EAi 24 March 1995
1000 0940 0920 0930:10 0900 su nw ar d io ns ta ilw ar d io ns 1 10 0.1 1 10 0.1 (11.9 -7.5 8.9) nT in GSM 0 1000 2000 3000 40000 100 200 300 400 TH para TC para TC perp TH perp 10 00 1 counts/sample (UT) 0.1 1 10 co ld io ns ho t io ns (e V ) (e V ) io n d en si ty NC NH Vmax = 2100.4 km/s B log(PSD) -10 -17
(c) 1D cuts
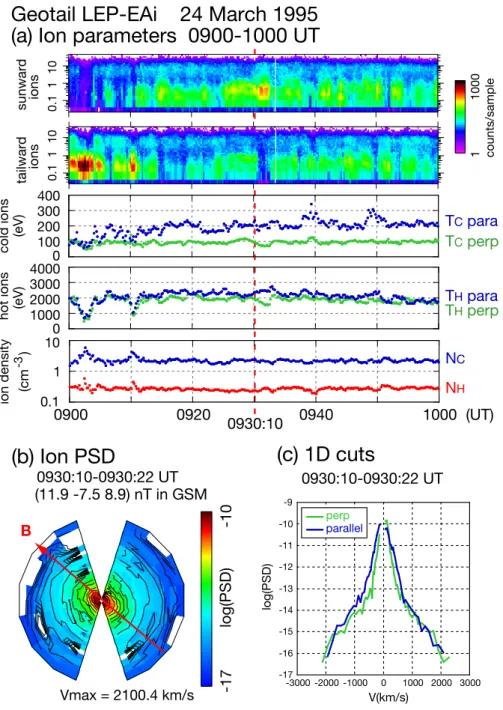
0930:10-0930:22 UT -17 -16 -15 -14 -13 -12 -11 -10 -9 -3000 -2000 -1000 0 1000 2000 3000 perp parallel V(km/s) log(PSD) (cm -3 )Fig. 2. The upper panel (a) shows Geotail observations between 09:00–10:00 UT on 24 March 1995. From the top, energy-time (E-t) diagrams of sunward and tailward ions, temperatures and densities of cold and hot components of protons are shown. The perpendicular (parallel) temperature is shown by the green (blue) points, the density of the cold (hot) component is shown by the blue (red) points. The lower left panel (b) shows a cut of ion PSD for the 12-s interval 09:30:10–09:30:22 UT in the plane that includes the magnetic field. The field direction is shown by the red arrow. The lower right panel (c) shows one-dimensional cuts of the PSD in the direction perpendicular (green curve) and parallel (blue curve) to the local magnetic field.
2006) where densities and temperatures were about 0.4 cm−3 and ∼2 keV, respectively. The temperatures of cold proton component from DMSP satellites seem to prefer the paral-lel temperature to the perpendicular temperature of the cold proton component of Geotail observations, which might be
attributed to the usage of ion flux along the magnetic field at the DMSP location. Direct comparison between DMSP and Geotail temperature data including anisotropies is beyond the scope of this paper.
772 M. N. Nishino et al.: Temperature anisotropy of the two-component protons in the dusk plasma sheet
Ion PSD and fitted curves
0930:10-0930:22 UT 24 March 1995
-17 -16 -15 -14 -13 -12 -11 -10 -9 -3000 -2000 -1000 0 1000 2000 3000 observed PSDfitted curve (hot)
one count level
V
||(km/s)
fitted curve (cold)
log (PSD)
Fig. 3. Comparison between thet observed PSD in the parallel direction and the estimated PSD by the two-Maxwellian mixture model. The black line shows the observed PSD, and the red (blue) curve corresponds to the fitted curve of the hot (cold) component. A couple of green curves are the one-count level of the detector.
Figure 2b shows a cut of the ion PSD for the 12-s interval 09:30:10–09:30:22 UT in the plane that includes the mag-netic field. The left (right) portion of the cut shows the sun-ward (tailsun-ward) moving ions. The maximum speed shown in the figure is about 2100 km/s. The magnetic field was (11.9, −7.5, 8.9) nT in the GSM coordinates, whose direc-tion is shown by a red arrow in the figure. Dominance of TCk over TC⊥ mentioned above is seen as the elongation of the PSD contours along the magnetic field in Fig. 2b (yellow-red colored region).
Figure 2c shows one-dimensional cuts of the PSDs in the direction perpendicular and parallel to the local magnetic field. The green (blue) curve corresponds to the perpendic-ular (parallel) component. The hot and cold components are clearly apparent in the PSD curves, with enhanced fluxes at high energies that do no fit a single cold Maxwellian distri-bution.
Figure 3 compares observed PSD in the parallel direction with the fitted curves of the two-Maxwellian mixture model for the same data as presented in Fig. 2. The black line shows the observed PSD, and the red (blue) curve is a fit to the Maxwellian distribution of the hot (cold) component. A cou-ple of green curves correspond to the one-count level of the detector. As a whole, the two-Maxwellian fitting seems to work well for the two-component proton cases.
3.2 23 September 1995 event (TCk<TC⊥)
Next we show another case in which the perpendicular tem-perature of the cold component (TC⊥) is higher than the par-allel temperature (TCk).
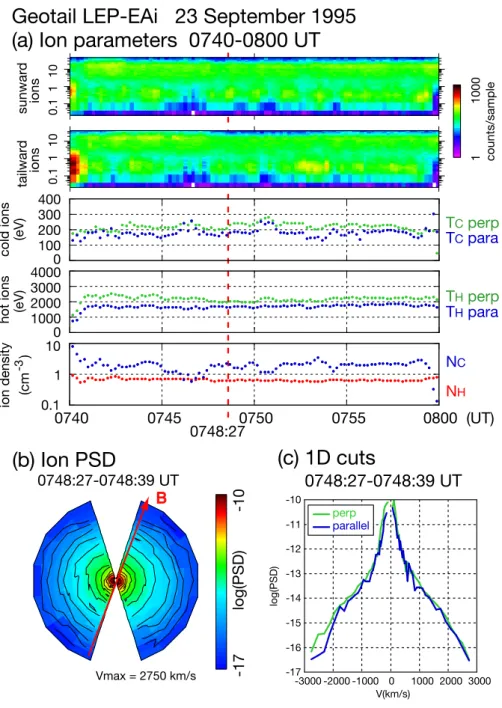
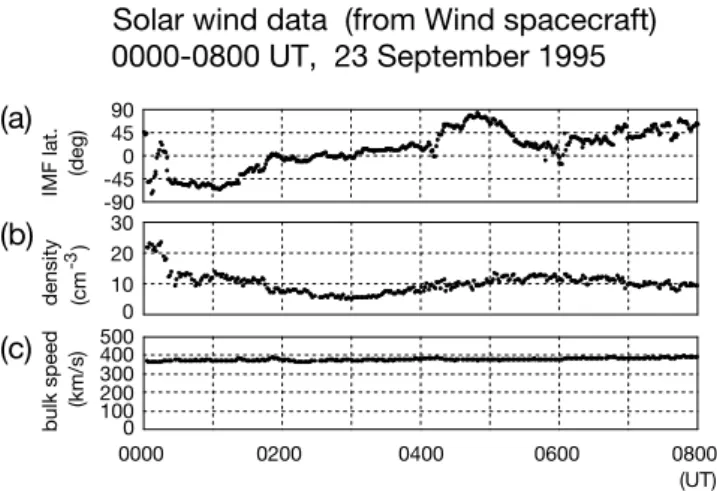
Figure 4a shows the Geotail observation of the two-component protons in the dayside-dusk plasma sheet be-tween 07:40–08:00 UT on 23 September 1995, in the same format as Fig. 2a. At 07:40 UT Geotail was located at (5.3, 9.1, −3.8) RE in the GSM coordinates, crossing the magnetopause from the dense boundary layer into the mag-netosphere. Figure 5 shows the solar wind observations between 00:00–08:00 UT obtained by Wind at X∼68 RE. The IMF pointed northward between 03:04–08:15 UT at the Wind location except for two short excursions to southward direction (Fig. 5a). The observation interval in Fig. 4a cor-responds to the end of the prolonged northward IMF period. The averaged solar wind speed was 386 km/s (0.77 keV) and its density was about 11.4 cm−3(Fig. 5b and c).
In the plasma sheet with the two-component protons, the perpendicular and parallel temperatures of the cold compo-nent (TC⊥ and TCk) were 220 eV and 160 eV, respectively. The anisotropy TC⊥/TCk was ∼1.4, where the perpendicu-lar temperature exceeded the parallel temperature in contrast to the previous event. The perpendicular and parallel tem-peratures of the cold proton component normalized by ESW were 0.29 and 0.21. The perpendicular and parallel temper-atures of the hot component (TH⊥ and THk) were 4.5 keV and 3.4 keV, respectively, and its anisotropy (TH⊥/THk) was ∼1.3. The average densities of the cold and hot compo-nents were about 2.0 cm−3 and 0.7 cm−3, respectively. In the plasma sheet adjacent to the boundary layer, both com-ponents were stagnant with flow speeds less than 50 km/s. The hot component temperatures were higher than those in the tail flank event (∼2 keV), while the cold component tem-peratures were similar in both events.
Figure 4b shows a cut of ion PSD between 07:43:40– 07:43:52 UT, in the same format as Fig. 1b but the maximum speed shown in the figure is about 2750 km/s. The magnetic field was (−0.6, 29.6, 32.5) nT in GSM. Enhancement of the perpendicular anisotropy for the cold component is seen as the elongation of the PSD contours in the direction perpen-dicular to the magnetic field in Fig. 4b (yellow-red colored region).
Figure 4c shows one-dimensional PSDs in the direction perpendicular and parallel to the local magnetic field, in the same format as Fig. 2c. In both low and high energy ranges the perpendicular component dominates over the par-allel one.
4 Statistical study
In order to further investigate the trend of temperature anisotropy of the two-component protons in the stagnant
(b) Ion PSD
0748:27-0748:39 UT
(a) Ion parameters 0740-0800 UT
Geotail LEP-EAi 23 September 1995
0800 0755 0745 0750 0748:27 0740 su nw ar d io ns ta ilw ar d io ns 1 10 0.1 1 10 0.1 0 1000 2000 3000 40000 100 200 300 400 TH para TC para TC perp TH perp 10 00 1 counts/sample (UT) 0.1 1 10 co ld io ns ho t io ns (e V ) (e V ) io n d en si ty NC NH
(c) 1D cuts
Vmax = 2750 km/s B B log(PSD) -10 -17 V(km/s)0748:27-0748:39 UT
log(PSD) -17 -16 -15 -14 -13 -12 -11 -10 -3000 -2000 -1000 0 1000 2000 3000 perp parallel (cm -3 )Fig. 4. The upper panel shows the Geotail observations between 07:40–08:00 UT on 23 September 1995, in the same format as Fig. 2. The lower panel shows a cut of ion phase space density for the 12-s interval 07:43:40–07:43:52 UT.
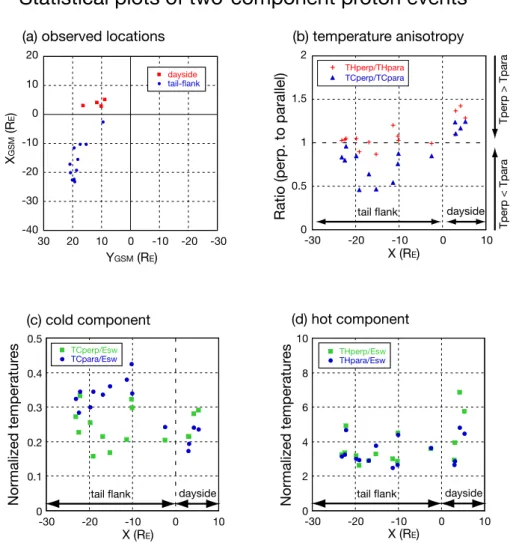
plasma sheet near the low-latitude boundary, we surveyed the Geotail E-t diagrams by eyes for the period 1995–2000, and chose 15 intervals of two-component protons (11 in the tail and 4 on the dayside, whose XY positions are shown in Fig. 6a), imposing a condition that there are two separate peaks in the E-t diagrams. The relatively small amount of events is due to limitation of acquisition of the 3-D data. The fitted parameters of each event are averaged over the intervals when the ion counts had two peaks and flows were stagnant
(|VX|<50 km/s). These events all are related to northward
IMF intervals (IMF data are not shown in this paper), which is consistent with previous studies (e.g. Hasegawa et al., 2003; Nishino et al., 2005). For each event, there was a con-tinuous northward IMF interval longer than 3 h just before the observation of the two-component protons. This time scale is consistent with those shown in the statistical study by Wing et al. (2005).
774 M. N. Nishino et al.: Temperature anisotropy of the two-component protons in the dusk plasma sheet
(a) (b) (c)
Solar wind data (from Wind spacecraft)
0800 0000 0200 0400 0600 (UT) IM F la t. d en si ty b ul k sp ee d (d eg ) (k m /s ) -90 -450 45 90 0 10 20 30 0 100 200 300 400 500 0000-0800 UT, 23 September 1995 (cm -3)
Fig. 5. Solar wind observations between 00:00–08:00 UT on 23 September 1995 in the same format as Fig. 1.
Figure 6b shows the ratio of the perpendicular to parallel temperature of each component. As for the cold component, the ratio (TC⊥/TCk) is in the range of 0.5–1.3, depending on the X coordinate of the observed location. On the dayside (X>0 RE), TC⊥/TCkis larger than unity and roughly in the range of 1.1–1.3. In the dusk tail plasma sheet (X<0 RE), the ratio is less than unity, and it can be as low as 0.47. Such strong anisotropy of the cold component is occasionally ob-served around X∼−10 to ∼−20 RE.
Original data of the perpendicular and parallel tempera-tures of the cold proton component are shown in Fig. 6c, where both of them are normalized by the kinetic energy of the solar wind protons which is denoted as ESW. The green squares (blue circles) correspond to the normalized perpen-dicular (parallel) temperature. Most of the temperatures of the cold component are in the range of 20–40 percent of the kinetic energy of the solar wind protons; that is, the typical temperature of the cold component is roughly 200–400 eV for typical solar wind energy of 1 keV (437.7 km/s). We note that the normalized parallel temperature (TCk/ESW) is roughly in the range of 0.3–0.4 in the tail plasma sheet, and it is as low as 0.2 on the dayside. The parallel temperature of the cold component in the tail is consistent with the cold component temperatures on the duskside obtained by Wing et al. (2005, 2006).
The hot proton component is less anisotropic than the cold component (Fig. 6b). The ratio of the perpendicular to par-allel temperature of the hot component (TH⊥/THk) is in the range between 0.9–1.4, exceeding 1.0 except 2 cases in the tail region. The tendency is consistent with the proton tem-perature anisotropy in the usual plasma sheet (T⊥/Tk>1) (Mauk and McPherron, 1980). The perpendicular and paral-lel temperatures of the hot proton component normalized by ESW are shown in Fig. 6d. These normalized temperatures are in the range of 3–4 in the dusk-tail plasma sheet, and
are at times more than 5 on the dayside. This trend resem-bles a statistical profile of plasma sheet temperature during southward IMF intervals (Wing and Newell, 2002), which supports the idea that the hot proton component on the day-side is of the magnetospheric origin and convect adiabatically from the tail plasma sheet.
5 Discussion
We first focus on the difference of spatial temperature files of the cold and hot proton components. The hot pro-ton component on the dayside is hotter than that in the tail flank (Fig. 6d). This temperature profile resembles that of the plasma sheet protons under southward IMF shown by Wing and Newell (2002) with the DMSP data, which suggests that the hot proton component is transported from nightside to dayside plasma sheet by convection. If the cold proton com-ponent convects together with the hot comcom-ponent from night-side to daynight-side plasma sheet, the trend of spatial change of the cold component temperature should be similar to that of the hot component temperature. The temperature profile of the cold component (Fig. 6c), however, is different from that of the hot component: that is, the parallel temperature of the cold component in the tail region is higher than that on the dayside, and the perpendicular temperatures on the dayside and in the tail seem to be similar. In addition, spatial pro-file of the parallel temperature of the cold proton component means that the cold protons are not transported from the tail flank to the dayside and vice versa, and suggests that the cold protons on the dayside and in the tail came into the mag-netosphere through separate locations. This result seems to conflict with the suggestion by Hasegawa et al. (2003) that the cold protons on the dayside is transported from the tail plasma sheet. However, further inspection is necessary to understand what occurs around the border between the day-side and tail flank plasma sheet, for there are few events in the region between X∼0 and −10 REin our study.
We discuss mechanism by which the parallel temperature of the cold proton component is enhanced in the tail (around X∼−10 to X∼−20 RE). Let us focus on adiabatic heating in the plasma sheet, for betatron acceleration influences per-pendicular temperature and Fermi acceleration does parallel temperature in general. Yamamoto and Tamao (1978) found that sunward convection in the magnetotail (from X∼−40 to X∼−20 RE) yields parallel anisotropy as a result of the interplay between Fermi and betatron accelerations. There-fore, we suggest that some fraction of parallel anisotropy of the cold proton component in the tail region is explained by adiabatic heating associated with sunward convection.
The perpendicular anisotropy of the hot component on the dayside may be attributed to losses into the ionosphere along the magnetic field. In the tail flank the hot component was almost isotropic while it had weak parallel anisotropy in two events where the cold component had strong parallel
Normalized temperatur es X (RE) dayside tail flank Normalized temperatur es
(c) cold component (d) hot component
Statistical plots of two-component proton events
0 0.1 0.2 0.3 0.4 0.5 -30 -20 -10 0 10 dayside tail flank 0 2 4 6 8 10 -30 -20 -10 0 10 X (RE) (b) temperature anisotropy 0 0.5 1 1.5 2 -30 -20 -10 0 10
Ratio (perp. to parallel)
Tperp < Tpara Tperp > Tpara dayside tail flank X (RE) THperp/THpara TCperp/TCpara dayside tail-flank
(a) observed locations
-30 -20 -10 0 10 20 30 -40 -30 -20 -10 0 10 20 YGSM (RE) X GSM (R E ) TCperp/Esw
TCpara/Esw THperp/EswTHpara/Esw
Fig. 6. Statistical plots for the 4 dayside and 11 tail events. Panel (a) shows the projection onto the GSM XY plane of observed locations of the plasma sheet with the two-component protons near the dusk low-latitude boundary. Dayside (tail) events are plotted as red squares (blue circles). Panels (b–d) show relation between the X coordinate of the observed locations and the temperature parameters. Panel (b) shows anisotropy of each component (ratio of perpendicular to parallel temperature). The blue (red) point corresponds to the ratio of the cold (hot) component temperatures. Panels (c) and (d) show normalized temperatures of the cold and hot components parallel to and perpendicular to the magnetic field, with blue circles (green squares) corresponding to the parallel (perpendicular) temperature. The temperatures are normalized by the kinetic energy of the solar wind protons (437.7 km/s=1 keV).
anisotropy (Fig. 6b). The parallel anisotropies of both cold and hot components support the idea that observed parallel anisotropy may be explained, to some extent, by adiabatic change due to sunward convection in the plasma sheet.
We discuss the relation between our findings and the pro-posed candidates for the entry mechanism of magnetosheath protons into the magnetosphere under northward IMF. One of the candidates which enables the capture of magnetosheath plasma into dayside magnetosphere is magnetic reconnection that occurs at the high-latitude magnetopause (e.g. Song and Russell, 1992; Li et al., 2005; Øieroset et al., 2005; Lavraud et al., 2005, 2006). However, the perpendicular anisotropy of the cold proton component (TC⊥/TCk>1) observed on the
dayside disagrees with proton signatures of magnetic recon-nection, since the counter streaming protons are expected to be observed near the high-latitude magnetic reconnection site (Retin`o et al., 2005). Our observations also conflict with the prediction by the numerical model (e.g. Song et al., 1999) where the cold plasma which comes across the dayside mag-netopause from the magnetosheath goes to the tail flank, be-cause tailward flows in the boundary plasma sheet supposed by the model cannot explain the observed spatial profile of the parallel temperatures on the dayside and in the tail.
The entry of cold plasma on the dayside may not be attributed to the Kelvin-Helmholtz (KH) instability, for the vortical structures around the magnetopause have been
776 M. N. Nishino et al.: Temperature anisotropy of the two-component protons in the dusk plasma sheet observed only in the downstream region of the terminator
(e.g. Hasegawa et al., 2004). On the other hand, the enhance-ment of TCkaround X∼−10 to ∼−20 REmight be explained by magnetic reconnection in the vortical structures due to KH instability that might play an important role in plasma trans-port across the magnetopause (e.g. Otto and Fairfield, 2000; Nykyri and Otto, 2001; Nakamura et al., 2006).
As a candidate of plasma transport mechanism across the dayside magnetopause, kinetic Alfv´en waves (KAWs) have been proposed (Johnson et al., 2001). Hasegawa et al. (2003), analyzing the dayside plasma sheet with two-component pro-tons, suggested heating of cold electrons in the direction par-allel to the local magnetic field. Since the KAW can explain both the proton heating in the perpendicular direction and the electron heating in the parallel direction, our results on the dayside are not inconsistent with the KAW. However, comparison to the magnetosheath is necessary to further dis-cuss heating mechanism, because the protons in the day-side magnetosheath occasionally have strong perpendicular anisotropy during the northward IMF intervals (Farrugia et al., 2001).
Finally, we consider the fate of the cold proton component on the dayside. The difference of temperature anisotropy of the cold proton component between the dayside and tail flank plasma sheet suggests that the cold component on the day-side cannot go down the tail flank via plasma convection in the plasma sheet. The cold proton component on the dayside might go further down the tail with dayside magnetic recon-nection after the southward turning of the IMF.
6 Conclusions
We have analyzed the temperature anisotropy of the two-component protons in the plasma sheet near the dusk low-latitude boundary. In the dayside dusk plasma sheet TC⊥/TCk>1, while in the tail dusk plasma sheet TC⊥/TCk<1. The hot component is isotropic (TH⊥/THk∼1) in the tail while TH⊥/THk>1 on the dayside. The paral-lel anisotropy in the tail flank might be partly explained by adiabatic heating associated with sunward convection. The difference of temperature anisotropy of the cold component between the dayside and tail-flank regions suggests that the cold plasma on the dayside entered through dayside magne-topause and that the cold plasma in the tail plasma sheet did via dusk tail-flank magnetopause. It is not plausible that the cold protons that came into the magnetosphere on the day-side go down to the tail flank.
Acknowledgements. We thank T. Nagai for providing the
mag-netic field data from the MGF instrument on board Geotail space-craft. We also thank the principal investigators of ACE MAG and SWEPAM experiments and Wind MFI and SWE instruments for providing the solar wind data via CDAWeb. M. N. Nishino thanks H. Hasegawa for fruitful discussion.
Topical Editor I. A. Daglis thanks two referees for their help in evaluating this paper.
References
Eastman, T. E., Hones Jr., E. W., Bame, S. J., and Asbridge, J. R.: The magnetospheric boundary layer: Site of plasma, momentum, and energy transfer from the magnetosheath into the magneto-sphere, Geophys. Res. Lett., 3, 685–688, 1976.
Fairfield, D. H., Otto, A., Mukai, T., Kokubun, S., Lepping, R. P., Steinberg, J. T., Lazarus, A. J., and Yamamoto, T.: Geotail obser-vations of the Kelvin-Helmholtz instability at the equatorial mag-netotail boundary for parallel northward fields, J. Geophys. Res., 105(A9), 21 159–21 174, doi:10.1029/1999JA000316, 2000. Farrugia, C. J., Erkaev, N. V., Vogl, D. F., Biernat, H. K., Øieroset,
M., Lin, R. P., and Lepping, R. P.: Anisotropic magnetosheath: Comparison of theory with Wind observations near the stag-nation streamline, J. Geophys. Res., 106(A12), 29 373–29 386, doi:10.1029/2001JA000034, 2001.
Fujimoto, M., Terasawa, T., Mukai, T., Saito, Y., Yamamoto, T., and Kokubun, S.: Plasma entry from the flanks of the near-Earth magnetotail: Geotail observations, J. Geophys. Res., 103, 4391– 4408, 1998.
Hasegawa H., Fujimoto, M., Maezawa, K., Saito, Y., and Mukai, T.: Geotail observations of the dayside outer boundary region: Interplanetary magnetic field control and dawn-dusk asymmetry, J. Geophys. Res., 108(A4), 1163, doi:10.1029/2002JA009667, 2003.
Hasegawa H., Fujimoto, M., Phan, T.-D., R`eme, H., Dunlop, M. W., Hashimoto, C., and TanDokoro, R., Transport of solar wind into Earth’s magnetosphere through rolled-up Kelvin-Helmholtz vortices, Nature, 430, 755–758, 2004.
Johnson, J. R., Cheng, C. Z., and Song, P.: Signatures of mode conversion and kinetic Alfv´en waves at the magnetopause, Geo. Res. Lett., 28, 227–230, doi:2000GL012048, 2001.
Kokubun, S., Yamamoto, T., Acu˜na, M. H., Hayashi, K., Shiokawa, K., and Kawano, H.: The GEOTAIL magnetic field experiment, J. Geomag. Geoelectr., 46, 7–21, 1994.
Lavraud, B., Thomsen, M. F., Taylor, M. G. G. T., Wang, Y. L., Phan, T. D., Schwartz, S. J., Elphic, R. C., Fazakerley, A., R`eme, H., and Balogh, A.: Characteristics of the magnetosheath elec-tron boundary layer under northward interplanetary magnetic field: Implications for high-latitude reconnection, J. Geophys. Res., 110, A06209, doi:10.1029/2004JA010808, 2005.
Lavraud, B., Thomsen, M. F., Lefebvre, B., Schwartz, S. J., Seki, K., Phan, T. D., Wang, Y. L., Fazakerley, A., R`eme, H., and Balogh, A.: Evidence for newly closed magnetosheath field lines at the dayside magnetopause under northward IMF, J. Geophys. Res., 111, A05211, doi:10.1029/2005JA011266, 2006.
Li, W., Raeder, J., Dorelli, J., Øieroset, M., and Phan, T. D.: Plasma sheet formation during long period of northward IMF, Geophys. Res. Lett., 32, L12S08, doi:10.1029/2004GL021524, 2005. Matsumoto, Y. and Hoshino, M.: Turbulent mixing and transport
of collisionless plasmas across a stratified velocity shear layer, J. Geophys. Res., 111, A05213, doi:10.1029/2004JA010988, 2006. Mauk, B. H. and McPherron, R. L.: An experimental test of the electromagnetic ion cyclotron instability within the earth’s mag-netosphere, Phys. Fluids, 23, 2111–2127, 1980.
Mukai, T., Machida, S., Saito, Y., Hirahara, H., Terasawa, T., Kaya, N., Obara, T., Ejiri, M., and Nishida, A.: The Low Energy Par-ticle (LEP) experiment onboard the GEOTAIL satellite, J. Geo-mag. Geoelectr., 46, 669–692, 1994.
Nakamura, T. K. M., Fujimoto, M., and Otto, A.: Magnetic re-connection induced by weak Kelvin-Helmholtz instability and the formation of the low-latitude boundary layer, Geophys. Res. Lett., 33, L14106, doi:10.1029/2006GL026318, 2006.
Nishino, M. N., Terasawa, T., and Hoshino, M.: Increase of the tail plasma content during the northward interplanetary mag-netic field intervals: Case studies, J. Geophys. Res., 107(A9), doi:10.1029/2002JA009268, 2002.
Nishino, M. N., Terasawa, T., and Hoshino, M.: Geotail observa-tions of the cold plasma sheet on the duskside magnetotail, Fron-tiers of Magnetospheric Plasma Physics, Celebrating 10 Years of Geotail Oparation, COSPAR Colloquia Series, 16, 28–33, 2005. Nykyri, K. and Otto, A.: Plasma transport at the mag-netospheric boundary due to reconnection in Kelvin-Helmholtz vortices, Geophys. Res. Lett., 28(18), 3565–3568, doi:10.1029/2001GL013239, 2001.
Øieroset, M., Raeder, J., Phan, T. D., Wing, S., McFadden, J. P., Li, W., Fujimoto, M., R`eme, H., and Balogh, A.: Global cooling and densification of the plasma sheet during an extended period of purely northward IMF on October 22–24, 2003, Geophys. Res. Lett., L12S07, doi:10.1029/2004GL021523, 2005.
Onsager, T. G., Scudder, J. D., Lockwood, M., and Russell, C. T.: Reconnection at the high-latitude magnetopause during north-ward interplanetary magnetic field conditions, J. Geophys. Res., 106(A11), 25 467–25 488, doi:10.1029/2000JA000444, 2001. Otto, A. and Fairfield, D. H.: Kelvin-Helmholtz instability at the
magnetotail boundary: MHD simulation and comparison with Geotail observations, J. Geophys. Res., 105(A9), 21 175–21 190, doi:10.1029/1999JA000312, 2000.
Retin`o, A., Bavassano Cattaneo, M. B., Marcucci, M. F., Vaivads, A., Andr´e, M., Khotyaintsev, Y., Phan, T., Pallocchia, G., R`eme, H., M¨obius, E., Klecker, B., Carlson, C. W., McCarthy, M., Ko-rth, A., Lundin, R., and Balogh, A.: Cluster multispacecraft ob-servations at the high-latitude duskside magnetopause: impli-cations for continuous and component magnetic reconnection, Ann. Geophys., 23, 461–473, 2005,
http://www.ann-geophys.net/23/461/2005/.
Sckopke, N., Paschmann, G., Haerendel, G., Sonnerup, B. U. ¨O., Bame, S. J., Forbes, T. G., Hones Jr., E. W., and Russell, C. T.: Structure of the low-latitude boundary layer, J. Geophys. Res., 86, 2099–2110, 1981.
Song, P. and Russell, C. T.: Model of the formation of the low-latitude boundary layer for strongly northward interplanetary magnetic field, J. Geophys. Res., 97(A2), 1411–1420, 1992. Song, P., DeZeeuw, D. L., Gombosi, T. I. , Groth, C. P. T., and
Powell, K. G.: A numerical model of solar wind-magnetosphere interaction for northward interplanetary magnetic field, J. Geo-phys. Res., 104(A12), 28 361–28 378, 1999.
Terasawa, T., Fujimoto, M., Mukai, T., Shinohara, I., Saito, Y., Ya-mamoto, T., Machida, S., Kokubun, S., Lazarus, A. J., Steinberg, J. T., and Lepping, R. P.: Solar wind control of density and tem-perature in the near-Earth plasma sheet: Wind/Geotail collabora-tion, Geophys. Res. Lett., 24, 935–938, 1997.
Traver, D. P., Mitchell, D. G., Williams, D. J., Frank, L. A., and Huang, C. Y.: Two encounters with the flank low-latitude bound-ary layer: Further evidence for closed field topology and in-vestigation of the internal structure, J. Geophys. Res., 96(A12), 21 025–21 035, 1991.
Ueno, G, Nakamura, N., Higuchi, T., Tsuchiya, T., Machida, S., Araki, T., Saito, Y., and Mukai, T.: Application of multivariate Maxwellian mixture model to plasma velocity distribution func-tion, J. Geophys. Res., 106(A11), 25 655–25 672, 2001. Wing, S. and Newell, P. T.: 2D plasma sheet ion density and
temper-ature profiles for northward and southward IMF, Geophys. Res. Lett., 29(9), 1307, doi:10.1029/2001GL013950, 2002.
Wing, S., Johnson, J. R., Newell, P. T., and Meng, C.-I.: Dawn-dusk asymmetries, ion spectra, and sources in the northward in-terplanetary magnetic field plasma sheet, J. Geophys. Res., 110, A08205, doi:10.1029/2005JA011086, 2005.
Wing, S., Johnson, J. R., and Fujimoto, M.: Timescale for the for-mation of the cold-dense plasma sheet: A case study, Geophys. Res. Lett., 33, L23106, doi:10.1029/2006GL027110, 2006. Yamamoto, T. and Tamao, T.: Adiabatic plasma convection in
the tail plasma sheet, Planet. Space Sci., 26, 1185–1191, doi:10.1016/0032-0633(78)90058-2, 1978.
Zwolakowska, D., Koperski, P., and Popielawska, B.: Plasma popu-lations in the tail during northward IMF, Proceedings of the inter-national conference on substorms (ICS-1), ESA SP-335, 57–62, 1992.
Zwolakowska, D. and Popielawska, B.: Tail plasma domains and the auroral oval: results of mapping based on the Tsyganenko 1989 magnetosphere model, J. Geomag. Geoelectr., 44, 1145– 1158, 1992.