UNIVERSITÉ DE MONTRÉ AL
DEVELOPMENT OF LACTIC AND SUCCINIC ACID BIOREFINERY
CONFIGURATIONS FOR INTEGRATION
INTO A THERMOMECHANICAL PULP MILL
HANA LEE
DÉ PARTEMENT DE GÉ NIE CHIMIQUE É COLE POLYTECHNIQUE DE MONTRÉ AL
MÉ MOIRE PRÉ SENTÉ EN VUE DE L’OBTENTION DU DIPLÔ ME DE MAÎTRISE È S SCIENCES APPLIQUÉ ES
(GÉ NIE CHIMIQUE) MAI 2015
UNIVERSITÉ DE MONTRÉ AL
É COLE POLYTECHNIQUE DE MONTRÉ AL
Ce mémoire intitulé:
DEVELOPMENT OF LACTIC AND SUCCINIC ACID BIOREFINERY CONFIGURATIONS FOR INTEGRATION INTO A THERMOMECHANICAL PULP MILL
présenté par : LEE Hana
en vue de l’obtention du diplôme de : Maîtrise ès sciences appliquées
a été dûment accepté par le jury d’examen constitué de : M. LEGROS Robert, Ph. D., président
Mme MARINOVA Mariya, Ph. D., membre et directrice de recherche M. PERRIER Michel, Ph. D., membre et codirecteur de recherche M. PARIS Jean, Ph. D., membre et codirecteur de recherche M. MATEOS-ESPEJEL Enrique, Ph. D., membre
DEDICATION
ACKNOWLEDGEMENTS
I would like to thank everyone who helped me achieve this memoire.Special thanks to Prof. Jean Paris, who gave me a chance to start in the master program in É cole Polytechnique and encouraged me from the beginning with the appropriate advices whenever I was in trouble. And I would like to thank Dr. Mariya Marinova for her undivided attention and limitless patience. Your care for this project and your correction of my writing from A to Z were invaluable. Prof. Michel Perrier, your ever present support and understanding made this task less daunting. I would also like to show my gratitude to Dr. Enrique Mateos-Espejel, Dr. Waleed Wafa Al Dajani, and Dr. Tatiana Rafione at FPIs, who guided me and showed me how to analyze process integration. I am sure that this research would not have been possible without your help.
I would like to thank the government of Quebec and the Republic of Korea for awarding me a scholarship and BioFuelNet for fundraising my research project.
Thanks to my friend Tatiana. It was my greatest luck to meet you in our research group. You helped me so much from my first day of É cole Polytechnique. You are the only person who can understand my weird humor and “Frenglishean”.
Thanks to my friend François for your patience. As correcting the very first version of my writing with a thousand basic grammar errors would not have been easy.
Thanks to my colleague in E2D2BF Alexa, Irina, Christina, Sourour, Nabila, Miyuru, Ju, Radia, Moye, Selçuk, Meryam.
I would like to thank Mengwei and Lujia who are my roommates for the last 2.5 years. Without you, I could not have continued my life in Montreal. And André, thanks for being my friend. Thanks to Shinae and MKLCC that gave me many chances to meet nice friends.
I would like to express my gratitude to Jae Min who helped and corrected my French/English presentation and to Father Joachim who encouraged me with many delicious lunches during the last moment of writing this memoire.
I would like to thank Hyunjin who made me start working out in the gym. Our never ending stormy chats and meals allowed me to release some stress during the last semester.
RÉSUMÉ
L’augmentation des émissions de CO2 et la diminution des ressources énergétiques d’origine fossile ont provoqué une augmentation de l’intérêt porté à la production de carburants et de produits chimiques biobasés ces dernières années. En même temps, le secteur des pâtes et papiers, qui était l’un des moteurs de l’industrie canadienne, a été confronté à une crise qui a été provoquée par un haut prix de l’énergie, une concurrence accrue de la part des pays en développement et une diminution de l’utilisation du papier.
La bioraffinerie verte intégrée (BRVI), qui consiste à coupler une usine de pâtes et papiers existante à une nouvelle usine de production de produits chimiques de valeur, est apparue comme étant une solution permettant aux usines de pâtes canadiennes de redevenir compétitives grâce à la diversification de leur gamme de produits.
L’acide lactique et l’acide succinique sont des produits chimiques importants de par leur haut potentiel d’application dans les industries cosmétique, agro-alimentaire et pharmaceutique. Ils sont tous les deux obtenus par des voies technologiques pétrochimique ou biochimique. Cette dernière est basée sur la fermentation de sucres par des bactéries. Ces dernières années, la voie biochimique a reçu une attention croissante, car elle offre à l’industrie chimique l’opportunité de produire des produits chimiques verts.
La production économiquement compétitive de l’acide lactique et de l’acide succinique nécessite l’utilisation de sources de carbone diverses (telles que la biomasse lignocellulosique) et le développement de procédés viables. La bioraffinerie verte intégrée à une usine de pâte thermomécanique (TMP) produisant de l’acide lactique et de l’acide succinique biobasés permet non seulement l’échange de matière première mais également de chaleur. L’objectif de ce projet est de proposer les configurations de bioraffinerie de production d’acide lactique et succinique et de démontrer la faisabilité technique et la pertinence économique de la production d’acide lactique et d’acide succinique dans une bioraffinerie intégrée à une usine de pâtes thermomécanique. Quatre modèles de simulation ont été développés sur Aspen Plus lors de ce projet : (i) la production d’acide lactique biobasé avec récupération du produit final par précipitation ou (ii) électrodialyse et (iii) la production d’acide succinique biobasé avec récupération par cristallisation directe et (iv) électrodialyse. L’intégration énergétique et la conception d’un réseau d’échangeurs de chaleur (Heat Exchanger Network, HEN) des installations de production d’acide lactique et succinique ont
été réalisées en se basant sur les résultats de simulation et des données fournies par FPInnovations. Des opportunités de réduction de la consommation des flux chauds ont été émises à partir des résultats obtenus précédemment. À la fin du projet, une analyse économique globale est effectuée en se basant sur les bilans de matière et d’énergie obtenus à partir des modèles développés.
ABSTRACT
In recent years, with rising concerns about CO2 emission and depletion of fossil fuel, production of bio-based fuel or chemicals has attracted more attention. Meanwhile the pulp and paper industry, which used to be one of the major industries in Canada, has been confronted with a crisis in its operation during last two decades resulted from high energy price, competition with developing countries, and reduced paper demand.
As an alternative to this situation, the integrated forest biorefinery (IFBR), which is a concept of coupling of an existing conventional pulp and paper mill and a new plant for the production of valuable chemicals, has appeared as a potential way to make the Canadian pulp mills competitive again by diversifying their products.
Lactic acid and succinic acid are important chemicals due to their high potential for applications in the food, cosmetic, and pharmaceutical industry. Both lactic acid and succinic acid are produced by petro-chemical pathways or bio-chemical pathways, which are based on the fermentation of sugars by bacteria. In recent years, bio-chemical pathways have received increased attention as they offer an opportunity to the chemical industry to produce green chemicals.
So far, the bio-based lactic or succinic acid have been produced commercially from corn starch. This starch based raw material is converted to sugars by hydrolysis. Microorganisms produce lactic or succinic acid by metabolizing the sugars during the fermentation. Pure lactic and succinic acid are obtained by recovery from the fermentation broth.
Making lactic and succinic acid production economically competitive requires the use of various carbon sources (such as lignocellulosic biomass) as well as the development of viable processes. The integrated forest biorefinery (IFBR) that combines two or more processes of the production of pulp and paper and co-products such as bio-fuels or bio-chemicals allows not only the supply of raw material but also the transfer of heat. Before now many researches on the IFBR have been conducted into Kraft pulp mills as a receptor and relatively less study was done about Thermomechnical pulp (TMP) mills. The main objective of this project is to propose the configurations of biorefinery of production of lactic and succinic acid and to demonstrate the technical and economic feasibility of the integrated biorefinery composed of a TMP process and a lactic or succinic acid plant.
In this project four simulation models on Aspen Plus were developed: bio-based lactic acid production with the recovery by precipitation and electrodialysis, and bio-based succinic acid production with the recovery by direct crystallization and electrodialsys. With the stream data of stand-alone lactic and succinic plant extracted from the results of the simulations and the stream data of TMP mill provided from FPInnovations, heat integration was performed and Heat Exchanger Network was designed. From these results, heat recovery opportunities that indicate the reduction of external hot utility (steam) were estimated. At the end of this project, a simple economic evaluation was performed based on the material balance and energy use from the simulation models.
TABLE OF CONTENTS
DEDICATION ... III ACKNOWLEDGEMENTS ... IV RÉ SUMÉ ... V ABSTRACT ...VII TABLE OF CONTENTS ... IX LIST OF TABLES ...XII LIST OF FIGURES ... XIV LIST OF SYMBOLS AND ABBREVIATIONS... XVII LIST OF APPENDICES ... XVIIICHAPTER 1 INTRODUCTION ... 1
1.1 Context ... 1
CHAPTER 2 LITERATURE REVIEW ... 3
2.1 Lignocellulosic biomass ... 3
2.2 The pulp and paper industry ... 4
2.2.1 The current state in Canada ... 4
2.2.2 Pulping process ... 6
2.2.3 Energy and water consumption in the pulp and paper industry ... 8
2.3 Biorefinery ... 9
2.3.1 Biorefinery classification ... 10
2.3.2 The integrated forest biorefinery (IFBR) ... 11
2.3.3 The sugar platform ... 12
2.4 LA/SA Production from biomass ... 16
2.4.2 Enzymatic hydrolysis ... 18
2.4.3 Detoxification ... 18
2.4.4 Fermentation ... 20
2.4.5 Separation and Purification ... 22
2.5 Process integration and internal heat recovery ... 29
2.5.1 Pinch Analysis ... 29
2.6 Water pinch ... 32
2.7 Energy and water pinch analysis in P&P mills ... 33
2.8 Critical review ... 34
CHAPTER 3 OBJECTIVES AND METHODOLOGY... 35
3.1 Objectives ... 35
3.2 Methodology ... 36
CHAPTER 4 DESIGN OF BIOREFINERY CONFIGURATIONS & SIMULATION DEVELOPMENT ... 38
4.1 Selection of the process configurations ... 38
4.2 Development of the simulation models ... 40
4.2.1 Feedstock composition ... 40
4.2.2 Enzymatic hydrolysis ... 41
4.2.3 Lactic acid production ... 42
4.2.4 Succinic acid production ... 45
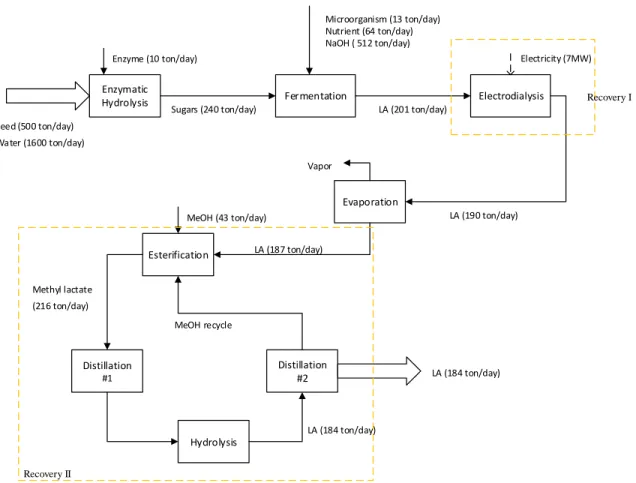
4.3 Simulation results ... 47
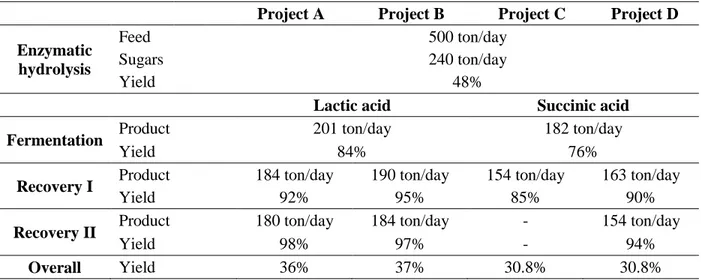
4.3.1 Stand-alone bio-based lactic acid production (Project A, B) ... 47
4.3.2 Stand-alone bio-based succinic acid production (Project C, D) ... 51
CHAPTER 5 TECHNO-ECONOMIC ANALYSIS OF THE INTEGRATED FOREST
BIOREFINERY (IFBR) ... 55
5.1 Energy analysis of the IFBR ... 55
5.1.1 Individual analysis of TMP, LA, and SA processes ... 57
5.1.2 Combined analysis ... 59
5.1.3 Heat recovery opportunities of the IFBR ... 62
5.2 Economic evaluation ... 78
5.2.1 Total capital cost estimation ... 78
5.2.2 Annual operating cost estimation ... 79
5.2.3 Annual revenue estimation ... 80
5.2.4 Summary ... 81
CHAPTER 6 GENERAL DISCUSSION ... 82
6.1 Process configurations of the stand-alone bio-based LA/SA plants and their simulation models ... 82
6.2 Technical feasibility of the IFBRs ... 82
6.3 Economic feasibility of the IFBRs ... 83
CHAPTER 7 CONCLUSION AND RECOMMENDATIONS ... 84
7.1 Conclusion ... 84
7.2 Recommendations ... 85
BIBLIOGRAPHY ... 86
LIST OF TABLES
Table 2-1 Composition of lignocellulosic biomass [8] ... 4
Table 2-2 Energy consumption of pulp manufacturing areas [19] ... 9
Table 2-3 Advantages and disadvantages of different pretreatment methods of linocellulosic biomass [41, 42] ... 17
Table 2-4 Main detoxification methods for inhibitors removal ... 19
Table 2-5 Homofermentive and heterofermentative lactic acid bacteria [34] ... 20
Table 4-1 The criteria used for process configurations selection ... 39
Table 4-2 Representation of the feedstock composition in Aspen Plus [98] ... 41
Table 4-3 Concentration of components in the hydrolysate based on simulation results [g/L] ... 48
Table 4-4 The most energy demanding units in the lactic acid production with the recovery by the conventional method (Project A) ... 49
Table 4-5 The most energy demanding units in the lactic acid production with the recovery by electrodialysis (Project B) ... 50
Table 4-6 The most energy demanding units in the succinic acid production with the recovery by direct crystallization (Project C) ... 52
Table 4-7 The most energy demanding units in the succinic acid production with the recovery by electrodialysis (Project D) ... 53
Table 4-8 Comparison of the material balances based on the simulation results... 54
Table 5-1 Energy profile of the IFBR A (integration of LA plant with recovery by conventional method to the TMP mill) ... 67
Table 5-2 Energy profile of the IFBR B (integration of LA plant with recovery by electrodialysis to the TMP mill) ... 70
Table 5-3 Energy profile of the IFBR C (integration of SA plant with recovery by direct crystallization to the TMP mill) ... 73
Table 5-4 Energy profile of the IFBR D (integration of SA plant with recovery by electrodialysis
to the TMP mill) ... 76
Table 5-5 Total capital cost estimation for the four IFBRs ... 79
Table 5-6 Assumed prices for the annual operating cost ... 80
Table 5-7 Annual operating cost estimation for the four integrated processes ... 80
Table 5-8 Annual revenue estimation ... 81
LIST OF FIGURES
Figure 2-1 Structure of wood [7]... 3
Figure 2-2 Pulp production in Canada [10] ... 5
Figure 2-3 Forest products sector contribution to the GDP of Canada [14] ... 6
Figure 2-4 Basic flow diagram of the TMP process [15] ... 7
Figure 2-5 A simplified diagram of the Kraft process ... 8
Figure 2-6 The petroleum refinery versus the biorefinery [20] ... 10
Figure 2-7 Distribution and share of resources in an integrated biorefinery complex ... 12
Figure 2-8 Bio-based products from cellulose and hemicelluloses ... 13
Figure 2-9 Overview of the two manufacturing methods for the production of lactic acid [33] ... 15
Figure 2-10 Modification of the lignocellulosic structure during pretreatment [40] ... 17
Figure 2-11 Conventional method (precipitation) for LA purification and final separation ... 23
Figure 2-12 Principle of the conventional electodialysis ... 25
Figure 2-13 Water-splitting electrodialysis (with bipolar membranes) ... 26
Figure 2-14 Double-ED process schematic [70] ... 27
Figure 2-15 Process combining electrodialysis and water-splitting electrodialysis [83] ... 29
Figure 2-16 Building and use of the composite curves to determine the energy targets [85] ... 30
Figure 2-17 Construction of the grand composite curve [85] ... 32
Figure 2-18 Water purity profiles [85] ... 33
Figure 3-1 Overview of the methodology for the bio-based lactic and succinic acids IFBR development ... 36
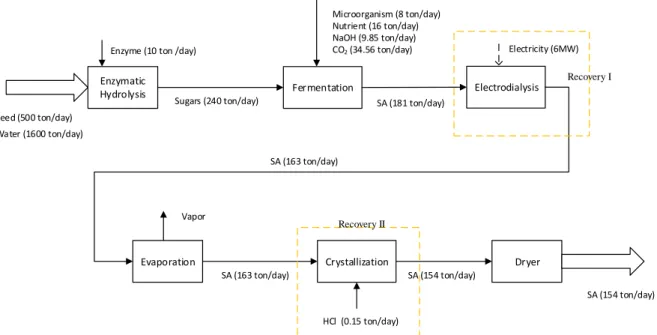
Figure 4-1 Configuration of the bio-based LA/SA production ... 38
Figure 4-2 Configurations considered for the simulation ... 40
Figure 4-4 Flowsheet of the lactic acid fermentation ... 43
Figure 4-5 Flowsheet of the lactic acid recovery by conventional method (Project A) ... 44
Figure 4-6 Flowsheet of the lactic acid recovery by electrodialysis (Project B) ... 45
Figure 4-7 Flowsheet of the succinic acid fermentation ... 45
Figure 4-8 Flowsheet of the succinic acid recovery by direct crystallization (Project C) ... 46
Figure 4-9 Flowsheet of the succinic acid recovery by electrodialysis (Project D) ... 47
Figure 4-10 Material balance for the stand-alone bio-based lactic acid production with the recovery by conventional method (Project A) ... 48
Figure 4-11 Material balance for the stand-alone bio-based lactic acid production with the recovery by electrodialysis (Project B) ... 50
Figure 4-12 Material balance for the stand-alone bio-based succinic acid production with direct crystallization (Project C) ... 51
Figure 4-13 Material balance for the stand-alone bio-based succinic acid production with recovery of electrodialysis (Project D) ... 52
Figure 5-1 Process integration strategy ... 55
Figure 5-2 HEN design and heat recovery opportunity in scenario 1 (1) ... 56
Figure 5-3 HEN design and heat recovery opportunity in scenario 1 (2) ... 56
Figure 5-4 HEN design for the heat recovery opportunity in scenario 2 ... 56
Figure 5-5 Composite curve of the TMP mill ... 57
Figure 5-6 Composite curves of the stand-alone bio-based lactic acid plant ... 58
Figure 5-7 Composite curves of the stand-alone bio-based succinic acid plant ... 59
Figure 5-8 Combined GCC of the TMP mill and the biorefinery ... 61
Figure 5-9 Integrated forest biorefineries ... 62
Figure 5-11 Comparisons of the LP steam consumptions between the project A (stand-alone) and the IFBR A ... 66 Figure 5-12 Heat recovery opportunities in the IFBR B ... 68 Figure 5-13 Comparisons of the LP steam consumptions between the project B (stand-alone) and
the IFBR B ... 69 Figure 5-14 Heat recovery opportunities in the IFBR C ... 71 Figure 5-15 Comparisons of the LP steam consumptions between the project C (stand-alone) and
the IFBR C (DC: Dirty condensate, L3_DS: Line3_Dirty steam) ... 73 Figure 5-16 Heat recovery opportunities in the IFBR D ... 74 Figure 5-17 Comparisons of the LP steam consumptions between the project D (stand-alone) and
the IFBR D (DC: Dirty condensate, L3_DS: Line3_Dirty steam) ... 76 Figure 5-18 Comparison of LP-steam consumption in the various IFBRs and scenarios ... 77 Figure 5-19 Comparison of HEN area in the various IFBRs and scenarios ... 78
LIST OF SYMBOLS AND ABBREVIATIONS
A Area of heat exchangerCC Composite Curve
CTMP Chemi-Thermomechanical Pulping
T min Minimum temperature difference GCC Grand Composite Curve
GDP Gross Domestic Product HEN Heat Exchanger Network HEX Heat exchanger
HMF Hydroxymethylfurfural IEA International Energy Angency IFBR Integrated forest biorefinery
LA Lactic acid
LAB Lactic acid bacteria LP steam Low pressure steam
NREL National Renewable Energy Laboratory P&P Pulp and Paper
PLA Poly lactic acid
RMP Refiner Mechanical Pulping
SA Succinic acid
SGW Stone Ground Wood Pulping
SSF Simultaneous Saccharification and Fermentation TCA Tricarboxylic acid
LIST OF APPENDICES
Appendix A – Reactions in the Aspen Plus simulation ... 94
Appendix B – Stream data for the energy analysis ... 95
Appendix C – Heat Exchanger Network of IFBRs ... 99
Appendix D – Capital costs ... 109
CHAPTER 1
INTRODUCTION
1.1 Context
In the modern industrial society, the use of fossil resources such as coal, petroleum, and natural gas has provided the main power to operate our world. With the increase of transportation, electricity production, and industry in general, oil became the dominant fuel during the 20th century. The total petroleum consumption in Canada increased from 1,448 thousand barrels a day in 1983 to 2,431 thousand barrels a day in 2013 [1].
The development of a fossil-fuel-based economy has greatly improved our way of life but also raised some concerns like the depletion of fossil fuel, the high dependence on oil price, and the increase of political conflicts in the world. In addition, the combustion of fossil fuel emits gas such as CO2, CH4, NOx and SOx, which cause greenhouse effect and pollution. Thus, it is important to develop alternatives based on renewable energies.
On the one hand, the pulp and paper (P&P) industry in Canada has encountered a downswing in its traditional production on account of the decrease of paper use as well as the competition of low cost products from developing countries. Moreover, its large use of energy and water makes it hard to be operated in the long term. The conversion of an existing pulp and paper mill into an integrated forest biorefinery (IFBR), which produces value-added chemicals from lignocellulosic biomass and is able to substitute petroleum-based products, has been suggested as an alternative for the transformation of the industry.
The conversion of carbohydrates into ethanol fuel is a well-developed process. Almost all the bioethanol is currently produced from sugarcane or grain. The use of these raw materials has some disadvantages, for example, food shortage in developing countries, increase of the international price of grain and devastation of forests to increase agricultural land. Therefore, there is a need to develop the use of non-food resources in a biorefinery concept.
Besides bio-fuels there is also a strong demand for bio-based chemicals that can substitute petroleum-based chemicals. Lactic and succinic acids are promising candidates as products of the IFBR. They have been chosen between the top 12 value-added chemicals from sugars and syngas by the US Department of Energy, thanks to their various potential uses [2].
Lactic and succinic acid production from biomass consists of the following main steps: extraction and hydrolysis of sugars from various carbon sources (e.g. energy crops, lignocellulosic biomass, and agricultural residues), fermentation of sugars, and purification of the final product. So far, the main raw material for commercial production of biobased lactic and succinic acids are grain crops, which forms a large part of the total production cost.
It has been reported that the cost of feedstock of biobased Poly Lactic Acid (PLA) production is more than 34% of the entire manufacturing cost [3]. Therefore, making lactic and succinic acid economically competitive requires the use of various carbon sources such as lignocellulosic biomass as well as the development of economically viable processes.
From this point of view, the integration of a biorefinery in a Thermomechanical Pulping (TMP) mill is a good alternative to process sugars obtained from the wood components. Moreover, it is also important to reach high energy efficiency to make the biorefinery process competitive. Heat integration based on Pinch Analysis can be conducted to increase thermal efficiency of the biorefinery by analyzing interactions between processes. Heat sources are used to supply heat to the heat sinks minimizing the demand of external energy.
CHAPTER 2
LITERATURE REVIEW
2.1 Lignocellulosic biomass
Biomass is the living or recently living biological material including carbohydrates that can serve as a source of energy or chemicals. Lignocellulosic biomass is one of the most abundant materials in the world such as trees, agricultural food and residues, and pulp and paper mill residues [4]. As Canada has a large, well-developed forest that occupies 397.2 million ha, 41% of Canada’s land area and 10% of the world’s forested land, the utilization of wood has been considered as one of the country’s important valuable resources [5].
Wood is mainly composed of cellulose, hemicelluloses, lignin, and extractives. Cellulose makes up about 45% of the dry weight of wood and forms long chains of glucose linked by β-1,4-glycosidic bonds [6]. Hemicelluloses make up 25~30 % of the dry weight of wood and are composed of several sugars such as xylose, mannose, galactose, glucose, and arabinose. The different sugars are linked to each other by β-1,4- and β-1,3-glycosidic bonds and form branch structures with short lateral chains. Lignin makes up 18~35 % and is the most abundant polymer in nature. It is an amorphous heteropolymer, water insoluble that protects the plant body from microbial attacks and oxidative stress. The structure of wood in a microscope scale is represented in Figure 2-1.
The composition of lignocellulosic biomass varies in the different plant species. For example, woody biomass contains more cellulose, whereas agricultural biomass (e.g. wheat straw) has more hemicelluloses. A comparison of compositions of different lignocellulosic biomass is shown in Table 2-1. The hardwood hemicelluloses are composed of higher fraction of pentoses than softwood hemicelluloses, which contain more hexoses [8].
Table 2-1 Composition of lignocellulosic biomass [8]
Lignocellulosic biomass Cellulose (%wt.) Hemicelluloses (%wt.) Lignin (%wt.)
Hardwood 40-55 24-40 18-25
Softwood 45-50 25-35 25-35
Grasses 25-40 35-50 10-30
Wheat straw 30 50 15
2.2 The pulp and paper industry
2.2.1 The current state in Canada
The pulp and paper production in Canada has increased steadily of the last century, however, during the last 15 years the forest industry is in a declining tendency caused by U.S. recession of 2007-to-2009, the decrease of consumption of paper from the growth of the digital media and the global competition with developing countries (Figure 2-2) [9, 10].
Figure 2-2 Pulp production in Canada [10]
As a consequence, the contribution of the pulp and paper industry to the gross domestic product (GDP) in Canada has been decreasing for the last decade (Figure 2-3). In 2013, forest products contributed $19.8 billion, which is 1.25 % of GDP in Canada, while pulp and paper product manufacturing accounted for 36% of the contribution of the forest sector [11].
In fact, several pulp and paper mills in Canada closed their operations over the past few decades: for example, Eurocan mill (Kitimat, BC, 2010), Resolute Forest Products Inc. (Fort Frances, ON, 2014), Laurentide mill (Shawinigan, QC, 2012) [12]. Therefore, it is necessary to develop an alternative approach for using forest biomass and maintain P&P mills in operation. In 2009, the Government of Canada launched “The Pulp and Paper Green Transformation Program”, with a funding of $90.4 million over four years in order to help pulp and paper mills to be more energy efficient, to degrease their greenhouse gases emissions and water waste, or to produce new bio-based products [13]. 0 5 10 15 20 25 30 1900 1920 1940 1960 1980 2000 2020 Pu lp p ro d u ctio n [ m ill ion s o f t o n s]
Figure 2-3 Forest products sector contribution to the GDP of Canada [14]
2.2.2 Pulping process
Pulping is the process of separating the fibrous mass (cellulose) from the other wood components (hemicelluloses and lignin) by rupturing the strong linkages within the wood structure. This task can be accomplished mechanically, chemically, or by combination of these two treatments. As the oldest form of pulping, mechanical pulping separates fibers by mechanical energy. The main objective in the mechanical pulping is to separate the fibers from the lignin and suspend them in water for paper making. The advantage of mechanical pulping is a high yield of production (up to 90~95%) [15]. However, the fiber strength and the resistance to discoloration are low, because the mechanical pulping process does not dissolve lignin. Therefore, most of the mechanical pulp is used for lower grade papers such as newspaper and magazines. The main variations of the TMP processes are Stone Groundwood Pulping (SGW), Refiner mechanical Pulping (RMP), Thermomechanical Pulping (TMP), or Chemi-Thermomechanical Pulping (CTMP) [16].
The objective of chemical pulping is to separate and dissolve the lignin by cooking wood chips with chemicals under high temperature and pressure. The two main methods are the Kraft process (alkaline) and the sulphite process (acidic) [15].
0 0.5 1 1.5 2 2.5 3 3.5 4 4.5 Con trib u tio n [ % ]
pulp and paper products wood product manufacturing Forestry and logging Total forest products sector
2.2.2.1 Thermomechanical Pulping
TMP process is the most common mechanical process today. The TMP process produces the highest grade mechanical pulp but a large amount of energy is required due to the use of steam because of thermal pretreatment.
Basic flow diagram for the TMP process is shown in Figure 2-4. In the TMP process, wood chips are first steamed to make them soft before being grounded during the refining. It is important to conduct the refining at a temperature below 140 °C, if the refining is performed above 140°C, the fibres are easily separated but the lignin is also softened dramatically. With cooling this lignin reverts to a glassy state thus making hard to separate the fibres. The refining process causes the fibres to form a coiled shape that is termed ‘Latency’. It is necessary to disintegrate this freshly produced fibres in hot water. A vigorous mixing at a temperature 71~93°C in a chest is conducted for the latency removal to produce paper. To maximize the average time in a chest of a given volume, it is preferable to have a long rectangular chest. The pulp produced by TMP process is dark, and is costly to bleach.
Figure 2-4 Basic flow diagram of the TMP process [15]
2.2.2.2 Kraft Pulping
Kraft pulping is the dominant pulping method in the world [17]. In the Kraft process, chips are cooked in a solution of sodium hydroxide (NaOH) and sodium sulfide (Na2S), then the wood fibres are separated from lignin by dissolution [15]. After delignification, the cellulose fibres are
separated from the spent liquor (black liquid) and bleached by adding chemicals. Finally the fibres are drained, pressed, and thermally dried. The removed black liquor is concentrated by evaporation and sent to the recovery boiler for steam production. A causticizer is used to regenerate the white liquor. A schematic of the Kraft process is shown in Figure 2-5.
Figure 2-5 A simplified diagram of the Kraft process
2.2.3 Energy and water consumption in the pulp and paper industry
A large amount of water is consumed in the pulp and paper industry. It is used for the dilution of pulp, washing, cooling, and general cleaning operations. The larger the amount of water used and effluent produced, the larger the energy needed for heating, cooling and pumping the streams. In 2005, 14% of the total water consumption in Canada was used in the manufacturing sector and 45% of the manufacturing share was supplied to the paper manufacturing [18]. The electricity consumption in the manufacturing areas of Canadian P&P mills is shown in Table 2-2.
Table 2-2 Energy consumption of pulp manufacturing areas [19]
Area Electricity (kWh/ODT) Thermal energy (GJ/ODT)
Wood Preparation 22.20 0
Kraft Pulping 169.30 4.94
Kraft Evaporators – Direct Contact 24.50 5.91
Kraft Recausticizing 32.10 0.14
Kraft Bleaching (Softwood /
Hardwood) 179.50 / 143.90 3.41 / 2.33
Sulphite Pulping 766.40 5.00
Sulphite Acid Plant 32.00 N/A
TMP for Newsprint / Paper 2661.60 / 2943.20 0.56 / 0.67
SGW 1780.30 0
2.3 Biorefinery
According to the National Renewable Energy Laboratory of the US, a biorefinery is defined as a specific facility that converts biomass into various high-value products such as fuels, power, and chemicals. The biorefinery concept is analogous to the petroleum refineries that produce diverse fuels and products from petroleum. A comparison between the petroleum and the biomass-based refineries is shown in Figure 2-6.
Figure 2-6 The petroleum refinery versus the biorefinery [20]
2.3.1 Biorefinery classification
The IEA has introduced a biorefinery classification system based on the complete biomass to end product chains: the raw material utilized, conversion processes, platforms, and final products generated [21].
- Various types of raw materials can be used in a biorefinery, including dedicated crops and residues. Depending on the raw material, biorefineries can be classified in 1st , 2nd, and 3rd generation [22]. As the first generation biorefinery uses starch based biomass (e.g. grain crops), it causes several side-effects such as a destabilization of the world grain price, a risk of depletion of minerals in soil, and a competitive use of arable land [23]. The second generation biorefinery uses ‘plant biomass’ refers largely to lignocellulosic biomass that are cheap, abundant, and non-food materials [24]. Using the 2nd generation biorefinery is recommended to prevent the issues of the 1st biorefinery, however, as these 2nd generation biorefinery is relatively immature, the products are not cost-effective. So they should have good potential for cost reductions and increase of production efficiency. The third generation uses microalgae. Because microalgae can produce 15-300 times more oil for biodiesel production and have a very short harvesting cycle compared with conventional crops, it is considered to be an alternative energy resource. Although microalgae biorefinery has many advantages and potential benefits, some challenges including the production cost
of microalgae, environmental impacts from the microalgae production and waste treatment [25].
- The technologies that are capable of being applied to convert biomass feedstock into valuable products can be classified into four processes: mechanical /physical (pressing, milling, and separation), biochemical (fermentation, enzymatic conversion), chemical (hydrolysis, pulping), and thermochemical (pyrolysis, gasification, combustion) [21]. - The platform is an intermediate between the raw material and the final products such as
sugars (C5/C6), syngas, biogas, hydrogen, lignin, and pyrolysis liquid [2].
- The final product can be broadly grouped into two classes: energy products and material products [22]. Energy products include biofuels such as bioethanol, biodiesel, biogas, and bioenergy (bio-steam). Material products include chemicals and building blocks and polymers, for example, amino acids, xylitol, succinic-, lactic-, levulinic acid, furfural, PLA etc [2].
2.3.2 The integrated forest biorefinery (IFBR)
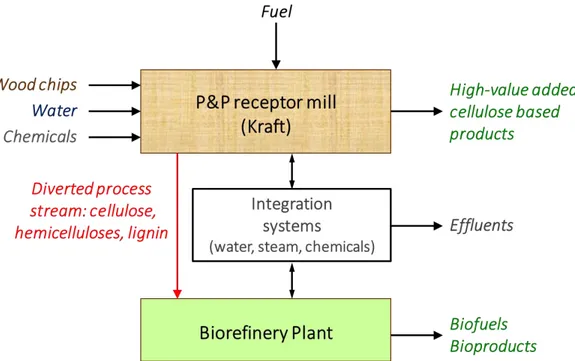
The integrated Forest Biorefinery (IFBR) is the integration of one or more bio-processing facilities that use lignocellulosic biomass into an existing process such as a pulp and paper mill in order to reduce costs of investment and operation by sharing infrastructure. Figure 2-7 represents an example of an integrated biorefinery based on the Kraft mill and the possible interactions.
Pulp and paper mills are appropriate sites for the integration of a biorefinery process, because they are located near to the raw material, and they have an extensive experience to handle biomass and utilities such as steam and water that can be transferred to the biorefinery.
The integration of a bio-process in a P&P mill can affect the quality of the pulp produced and the material and energy balance. For example, the integration of a lignin extraction technology to a P&P mill would affect its energy balance. The extraction of hemicelluloses from wood chips before pulping will impact both the material balance and the heating value of the black liquor.
Figure 2-7 Distribution and share of resources in an integrated biorefinery complex
2.3.3 The sugar platform
Burning is the most basic way to use lignocellulosic biomass to produce heat and electricity. However, there is great potential in the use of lignocellulosic biomass to produce liquid fuel or chemicals. In order to make possible the use of lignocellulosic biomass as feedstock for the production of bio-based products, it is fundamental for them to be converted to a sugar platform [23].
Cellulose and hemicellulose are hydrolyzed using biochemical or chemical pathways to produce sugars that can be converted to various bio-chemical products including bio-ethanol/butanol or organic bio-acids (lactic, succinic, etc.), as shown in Figure 2-8. After the hydrolysis step, the stream contains not only sugars but also toxic compounds such as hydroxymethylfurfural (HMF), acetic acid, formic acid, and phenolic compounds, therefore, a detoxification step is essential to purify the stream and to use the sugars.
The production of bio-ethanol by the conversion of glucose via a biochemical pathway is well-developed process at the industrial scale. Yeasts are mainly used as micro-organisms during the fermentation because of their characteristics: high ethanol yield, tolerance to ethanol, toxicity, and high fermentation ability at a low pH [26]. However, yeasts cannot ferment xylose that is derived
from hemicelluloses. To overcome this limitation, researches on the genetic modification of yeasts are developing new microorganisms [27]. Finally a recovery step with distillation is used and a pure ethanol stream is obtained.
Above bio-ethanol, various building blocks can be produced from sugars by certain micro-organisms at appropriate temperature and pH conditions. In this perspective, detailed process configurations for the production of bio-based lactic and succinic acid from lignocellulosic biomass will be reviewed in Section 2.4.
Figure 2-8 Bio-based products from cellulose and hemicelluloses
2.3.3.1 Lactic acid
Lactic acid (C3H6O3) is an organic acid naturally occurring with a long history of use for fermentation in food. Lactic acid was discovered in sour milk and considered as a milk component
by Scheele in 1780. In 1857 Pasteur discovered that it is a fermentation product by certain microorganisms [28].
Lactic acid has various applications in the food, pharmaceutical, cosmetic, and chemical industries [29]. In recent years, there has been a growing interest in Poly Lactic Acid (or PLA) which is a biodegradable plastic synthesized from lactic acid [30]. As a feedstock of PLA, the global demand of lactic acid has been increasing rapidly. In 2013, the global lactic acid and PLA market was estimated to be 714.2 kilo tons and 360.8 kilo tons respectively, and is expected to reach 1,960 kilo tons and 1,205.3 kilo tons by 2020 [31].
Lactic acid can be manufactured by both chemical and biological pathways (Figure 2-9). The chemical synthesis needs petrochemical feedstock and produces a racemic mixture of D(-)-lactic acid and L(+)-lactic acid which is not suitable for the production of PLA; the biobased production uses carbon sources such as corn, lignocellulosic biomass, or cheese whey and creates optically pure lactic acid [32]. Therefore, the biological pathway of lactic acid production has received significant interest. Around 90% of the lactic acid at commercial scale is produced by the biological pathway.
Figure 2-9 Overview of the two manufacturing methods for the production of lactic acid [33] The major manufacturers of biobased lactic acid are NatureWorks (USA, 180,000 tons), Purac (Thailand, 100,000 tons), Henan Jindan (China, 100,000 tons). Among them, NatureWorks started the first commercial-scale plant of PLA that produces 140,000 tons per year [34].
2.3.3.2 Succinic acid
Succinic acid (or butanedioic acid, C4H6O4) is a metabolite participating in the TCA (tricarboxylic acid) cycle and could be a final product of fermentation of various bacteria and fungi [35]. It is also known as an amber acid because it has originally been obtained from amber by distilling in 1550. It is widely used as a precursor of many chemicals with applications in chemical, food, and pharmaceutical industries [36]. In addition, as the synthesis of biodegradable polymers (like polybutylene succinate, polyamides and various green solvents) has been expending in the recent years, the market is expected to increase [37].
Conventional succinic acid is produced from butane by the conversion of maleic anhydride, however the operation is complex, expensive and causes environmental contamination. Recently the production of succinic acid by the bio-based pathway using fermentation has increased. The global succinic acid market was estimated to 40,000 tons in 2011 and is expected to reach about 600,000 tons in 2020 [38]. Currently, 97% of the succinic acid is produced via the petrochemical pathway and the main producers are Gadiv petrochemical Industries, Mitsubishi Chemical, Kawasaki Kasel Chemical, Nippon Shokubai, and several Chinese companies. The main producers of bio-based succinic acid are Succinity (25,000 tons/year, Spain), BioAmber (3,000 tons/year, France and 35,000 tons/year, Ontario), Myriant (5,000 ton/year, Germany), and Reverdia (10,000 tons/year, Italy) [38].
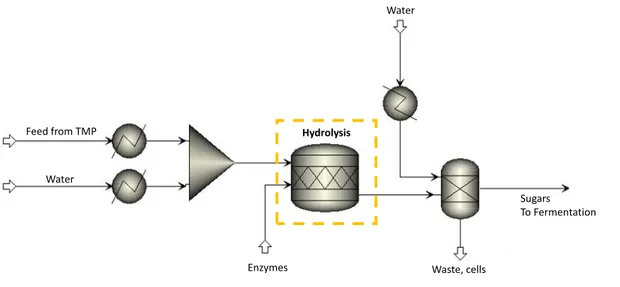
2.4 LA/SA Production from biomass
Bio-based lactic and succinic acid production from biomass feedstock is obtained through the fermentation of sugars by microorganisms. The pre-treatment and hydrolysis steps are necessary depending on the type of biomass. The configurations of the process for the production of lactic and succinic acids from lignocellulosic biomass consist of five steps: i) pretreatment, ii) enzymatic hydrolysis, iii) detoxification, iv) fermentation, and v) product recovery.
2.4.1 Pretreatment
Lignocellulosic feedstock (LCF) has a strong structure to protect itself from physical, chemical and biological attacks occuring in nature due to its inner complex linkages between cellulose, lignin, and hemicellulose. Therefore, the pretreatment process is a critical step in the biorefinery. The main goals of the pretreatment are removing lignin and changing the primary structure to make the reaction between cellulose, hemicellulose and enzymes (that converts carbohydrate polymers into mono sugars) more effective in the hydrolysis step [39]. The effect of pretreatment is illustrated in Figure 2-10.
Figure 2-10 Modification of the lignocellulosic structure during pretreatment [40]
Given that each pretreatment process has advantages and disadvantages, it is important to choose an appropriate process according to the raw materials and the desired final products. Some features have to be considered: high recovery of carbohydrates, less inhibitors produced, less energy demands, less catalysts or chemicals added, and less capital costs. Table 2-3 shows the comparisons of the main pretreatment routes.
Table 2-3 Advantages and disadvantages of different pretreatment methods of linocellulosic biomass [41, 42]
Pretreatment Advantages Disadvantages
Mechanical
- Simple operation
- Handle large volumes of biomass
- No use of chemicals
- Very little inhibitors generated
- Low sugar yield
- High energy consumption - Requires an additional pretreatment step
Dilute acid - Dissolution of hemicelluloses - High sugar yield
- High costs of acids and need for neutralization
- Corrosive resistant equipment are required
AFEX
- Effective for agricultural biomass
- High sugar yield
- Low formation of inhibitors
- Recycling of ammonia is needed
- Hemicelluloses are not hydrolyzed
Steam explosion
- No corrosion equipment required
- Suitable for hardwood
- Formation of inhibitors
- Requires washing of the treated biomass or conditioning of the hydrolyzate to remove inhibitors
2.4.2 Enzymatic hydrolysis
In the pretreatmnet step, the bonds of cellulose and hemicelluloses can be broken into oligosaccharides. These oligosaccharides should be broken to fermentable monosaccharides. Enzymatic hydrolysis is a very promising method to obtain fermentable sugars from pretreated lignocellulosic biomass. The main goals of the enzymatic hydrolysis are the break of chemical linkages in polysaccharides and the obtention of monosaccharides [43]. The enzymes are generally classified as cellulases and hemicellulases, suitable to convert cellulose and hemicellulose into sugars, respectively. Mixtures of theses enzymes are used to maximize the yield of hydrolysis and to decrease the reaction time and the process cost [44]. Enzymatic hydrolysis allows to produce relatively pure sugars, which can be done in mild operating conditions, without environmental and corrosion problems. However, a preliminary biomass pretreatment is required, the cost of enzymes is high, and the hydrolysis rate is low.
2.4.3 Detoxification
The pretreatment and hydrolysis steps may result in the production of inhibitors that are toxic for the fermentation microorganisms. The inhibitors can be classified in three groups: furan compounds (furfural and HMF) derived from sugars, weak acids (acetic, formic, and levulinic acid), and phenolic compounds due to the degradation of lignin [45]. As an example, the formation of acetic acid and furfural can prevent yeasts from growing and producing ethanol [46]. It is demonstrated that the phenolic components destroy and damage the cell membrane [47]. To correct
this, it is necessary to remove the inhibitors before the fermentation. The detoxification methods can be categorized in physical, chemical and biological, as shown in Table 2-4.
Table 2-4 Main detoxification methods for inhibitors removal
Methods Features Ref
Physical
Membrane (Nanofiltration or ultrafiltration)
High cost
Selective removal of inhibitors [48]
Evaporation (Vacuum evaporation) Reduce volatile compounds (acetic acid,
furfural) [49]
Chemical
Activated charcoal
Low cost
Remove phenolics and furans Low sugar loss
[50]
Ion Exchange Resin
Reduce phenolics Recycle is possible Difficult to scale-up
[51]
Overlimming Addition of Ca(OH)2
High sugar loss [48]
Extractive solvents (liquid-liquid extraction)
Using ethyl acetate, trialkylamine Remove acetic acid, furfural, and phenolics
High cost of operation Long process time
[52]
Biological Enzymes
Little waste generated Environmentally friendly Long process time High cost of enzymes
2.4.4 Fermentation
2.4.4.1 Lactic acid fermentation
The production of bio-based lactic acid is based on the fermentation of sugars by several microorganisms such as bacteria, fungi, and yeast. Lactic Acid Bacteria (LAB), such as
lactobacillus, lactococcus, and E.coli strains can produce lactic acid with high yield at pH condition
of 5~7 and temperature of 35~45 °C [54].
LAB are classified into two groups according to the fermentation end product: homo-fermentative or hetero-fermentative (Table 2-5). The conversion reactions of the C6 and C5 sugars by homo-fermentative LAB can be described by the following equations [34, 55]:
- C6H12O6 → 2C3H6O3 - 3C5H10O5 → 5C3H6O3
The theoretical yield of lactic acid production is 2 mol/mol glucose and 1.67 mol/mol xylose, on the other hand, the maximal yield of hetero-fermentative LAB is only 1 mol/mol sugar [34]. While the homo-fermentative LAB converts glucose into lactic acid almost exclusively, the hetero-fermentative LAB produces mixture of lactic acid, ethanol, CO2 and acetic acid. The ratio of ethanol to acetic acid is dependent on the redox potential in the cells.
Table 2-5 Homofermentive and heterofermentative lactic acid bacteria [34]
Homofermentative LAB Heterofermentative LAB
Products Lactic acid Lactic acid, ethanol, formic
acid, acetic acid, carbon dioxide
Theoretical yield of lactic acid from sugar
2.0 mol / mol glucose 1.67 mol / mol xylose
1.0 mol / mol glucose 1.0 mol / mol xylose
Strain Lactococcus, Enterococcus,
Lactobaillus
Leuconostoc, Oenococcus
Availability for commercial production
Available due to high yield Not available due to high by-product formation
The high production yield and the safety make homofermentative LAB suitable for the production at the commercial scale. Most LAB strains used in the commercial production of lactic acid belong to lactobacillus because they are tolerant to acid and easy to be engineered for the selective production of lactic acid [56, 57].
Generally, LAB need complex nutrition including amino acids, peptides, and vitamins because of their limited ability to grow. This not only increases the production costs but also prevents the recovery of lactic acid. E.coli and yeast need simple nutrition that facilitates the recovery of lactic acid. Moreover, the tolerance of yeast to pH is as low as 1.5, which makes fermentation possible without the use of neutralizing agent. However, a wild type of E.coli produces a mixture of ethanol and several organic acids and a wild type of yeast hardly produces lactic acid.
The moderate temperature condition in LAB fermentation needs less energy but it increases the risk of contamination of the fermentation broth. In addition, the low fermentation temperature hinders the use of Simultaneous Saccharification and Fermentation (SSF) of lignocellulosic biomass that is carried out at higher temperature than that of LAB fermentation. Therefore, research on the use of genetically engineered yeast for the fermentation of lactic acid to compensate the difficulties related with nutrients and recovery is ongoing.
2.4.4.2 Succinic acid fermentation
Succinic acid can be produced via the fermentation of carbon sources by several microorganisms at 37~39°C, pH 6~7.5, in presence of CO2. The overall yield can vary depending on the supply of CO2 and hydrogen:
- C6H12O6 + CO2 → C4H6O4 + CH3COOH + HCOOH [58] - 7C6H12O + 6CO2 → 12C4H6O4 + 6H2O [59]
- C6H12O6 + 2CO2 + 2H2 → 2C4H6O4 + 2H2O [60]
The supply of CO2 is an important factor for the fermentation of succinic acid. At low CO2 availability, the formation of microorganism and succinic acid is strongly inhibited [61]. Both external CO2 gas and carbonates in the medium resulting from the addition of CaCO3, NaCO3, or MgCO3 can be a source of CO2.
In addition to CO2, H2 is considered as a potential electron donor that affects the cellular metabolism. For a ratio of 5 % H2 / 95% CO2, the succinic acid production yield is increased by 5.86% compared with 100% CO2 [62].
Actinobacillus succinogenes isolated from rumen is reported to produce a large amount of succinic
acid from various carbon sources such as glucose, arabinose, xylose, galactose, mannose, sorbitol, cellobiose [63]. Acinobacillus succinogenes tolerates high concentrations of glucose, which is advantageous for fermentation [37]. Theoretically, 1 mol of CO2 is spent to produce 1 mol of succinic acid. Actinobacillus succinogenes 130Z is an appropriate candidate that can be used to produce large amounts of succinic acid. The variant strain produces succinic acid up to 85% yield (g SA/ g glucose) and concentration of 68.5 g/L [64].
Anaerobiospirillum succiniciproducens isolated from the throat of dogs can produce succinic acid
from renewable sources such as whey or wood hydrolysate [65, 66]. An important issue with this strain is the synchronous fermentation of the mixture of C5 and C6 sugars. It is reported that A.
succiniciproducens produces succinic acid with 91.8% yield (g SA/ g glucose) and concentration
of 30.5 g/L [67].
Another promising succinic acid bacteria, Manheimia succiniciproducens, is isolated from the bovine rumen and is also a capnophilic bacterium which grows well in presence of CO2. It is expected to be able to produce 1.71 mol of succinic acid from 1 mol of glucose if the supply of CO2 is enough [37].
Likewise with lactic acid bacteria, succinic acid producers require complex nutrition, including nitrogen sources and mineral salt for their metabolism and a strict pH control in the medium is essential. Therefore, there are vigorous research works on the use of genetically modified E.coli,
Corynebacterium glutamicum, or yeast which needs simple nutrient to make the recovery step
easier.
2.4.5 Separation and Purification
2.4.5.1 Lactic acid recovery
In the fermentation broth, lactic acid exists as a form of lactate salt rather than free lactic acid because of the neutralizing agents (CaCO3, Ca(OH)2, NaOH, and NH3) that were added to control
the pH at 5~7 in the fermenter. The purification of lactic acid is one of the major steps that affects the global production cost and the final quality of lactic acid at commercial scale production. Precipitation (Figure 2-11) is widely used as a traditional separation method. The fermentation broth is first neutralized by calcium carbonate so that a pH of 10 is reached and then heated at the temperature of 80 °C. The high temperature and pH let the remaining proteins coagulate and make the filtration simpler [68]. The liquor is then filtered to remove cells, evaporated and acidified by adding sulfuric acid to turn lactate salt into lactic acid and CaSO4 in the precipitation step [69]. The insoluble CaSO4 is removed by filtration. Esterification, distillation and hydrolysis are finally performed to get pure lactic acid [70].
Figure 2-11 Conventional method (precipitation) for LA purification and final separation
The conventional process can be described by the following reactions:
Neutralization:
2C3H6O3 + CaCO3 → (C3H5O3)2Ca + H2O + CO2
Precipitation by H2SO4:
Esterification:
C3H6O3 + CH3OH → C4H8O3 + H2O
Hydrolysis by H2O:
C4H8O3 + H2O → C3H6O3 + CH3OH
The disadvantages of this method are the generation of gypsum as a by-product and the high cost of the chemicals consumed.
There are several alternatives to the conventional separation such as electrodialysis, adsorption, reverse osmosis, reactive extraction, and liquid membrane [71]. These separation methods are more expensive but environment-friendly and energy-saving compared to the conventional process [72]. Among these methods, the electrodialysis is considered to be a potentially attractive process because it is a sustainable technique, which makes possible to treat quickly and obtain high concentrations of lactic acid [73]. In addition, an in-situ recovery system makes the relief of the product inhibition, which may cause the reduction of pH in the fermenter.
Electrodialysis is a process that is performed to separate ions from the fermentation broth under the influence of a direct current. The basic principle is that positively (cations) or negatively (anions) charged ions migrate toward the cathode or the anode, respectively (Figure 2-12). In desalting electrodialysis, ion-exchange membranes that can transfer cations or anions selectively are used. Because cations (sodium or ammonium ions) move across the cation exchange membranes in the direction to the cathode but they cannot pass the anion exchange membranes, so cations reach the compartment. On the other hand, anions (lactate ions) go through the anion exchange membranes towards the anode [74]. Finally, the originally-fed solution becomes diluted while the solution in the adjacent compartment is concentrated. Therefore, highly-concentrated lactate salt can be obtained from the fermentation broth.
Figure 2-12 Principle of the conventional electodialysis
Desalting electrodialysis is used first to concentrate lactate and bipolar membrane electrodialysis is then applied to turn lactate into lactic acid by acidification [75]. After the desalting eletrodialysis, water-splitting electrodialysis (Figure 2-13) with the bipolar membrane is done to produce lactic acid from lactate salt and the resulting base is recycled to the fermentation step as a pH controller [76]. Bipolar membranes can separate water to H+ and OH- ions and convert ionic salt into acids and bases without chemical addition. To obtain pure lactic acid, further purification by ion exchange is required [75].
Figure 2-13 Water-splitting electrodialysis (with bipolar membranes)
Recently, various techniques of eletrodialysis for lactic acid recovery have been studied. The application of one-stage water splitting electrodialysis, combined nanofiltration and watersplitting electrodialysis has been reported [77]. Another particular process was proposed as well that is combined with desalting electrodialysis, water-splitting electrodialysis, esterification, and distillation, called the ‘double ED’ process, (Figure 2-14) has been developed at the Michigan Biotechnology Institute (MBI) [70]. However, there is still a challenge involved in a co-instantaneous operation of the fermentation and the electrodialysis.
2.4.5.2 Succinic acid recovery
The purification and downstream processing represent a large part of the total cost of biobased succinic acid production. The purification consists of two processes: the removal of the cells and the rest of the nutrients, and the conversion of succinic salts to succinic acid. Because of the neutral agents added in the fermentor to adjust the pH value around 7 for the growth of microorganism, the resulting products exist in a form of succinic salts in the broth.
Ca(OH)2 is usually added to neutralize the fermentation broth and to precipitate calcium succinate at the same time. Calcium succinate is separated by filtration and converted to succinic acid by adding sulfuric acid [78]. However, a large amount of by-product calcium sulfate (CaSO4) is generated and an important amount of the chemicals which cannot be regenerated are consumed with this method.
Reactive extraction with amine-based extractants has also been reported in many studies in the literature because of its easy operation at mild temperature and pressure conditions [79].
Vacuum distillation combined with crystallization was developed, which enables the removal of by-products such as acetic, formic acids from the broth and crystalizes succinic acid [80].
Electrodialysis (Figure 2-15) is used to separate succinate from non-ionized compounds such as carbohydrates, proteins and amino acids, then water-splitting electrodialysis converts succinate salt to succinic acid [81].
Recently, the application of one-step recovery method which crystallizes succinic acid directly in the fermentation broth was reported [82]. In the neutral solution, about 90 % of the succinic acid and by-products such as formic, lactic and acetic acid exist in their ionic forms. When the pH value of the solution is 2.0, the solubility of succinic acid is only 3%. On the other hand, the by-products still have larger solubility in the fermentation broth at pH 1.0~1.4 and temperature of 0~4 °C. Therefore, succinic acid can be selectively separated by crystallization if the pH is controlled at 2.0 by adding HCl. According to the report of Qiang et al., 70% yield and 90% purity of succinic acid using this process can be obtained [82].
Figure 2-15 Process combining electrodialysis and water-splitting electrodialysis [83]
2.5 Process integration and internal heat recovery
When a biorefinery process is added to an existing pulp and paper facility, it is unavoidable that the demands for heating and cooling increase. However, building a new utility system, including a cooling tower and a steam boiler in a stand-alone design is not cost-effective. Therefore, it is imperative to analyze the process and to identify opportunities for heat integration and energy reduction in order to decrease the energy demand and the operation costs. Pinch Analysis can be applied to the heat integration studies.
2.5.1 Pinch Analysis
The Pinch Analysis, which was developed by Linnhoff et al. in 1982, is a widely-used method for energy integration [84]. It provides a systematic methodology to save energy within a process by maximizing internal heat recovery and minimizing external hot and cold energy demands supplied
by utilities. It also provides systematic guidelines to design a heat exchanger network for the maximum internal heat recovery and optimal utility use.
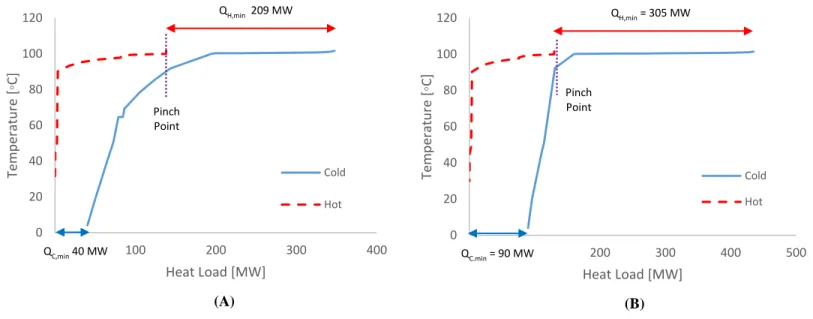
In order to start a pinch analysis, thermal data such as in/out temperature and heat load of streams are extracted from the process. The streams are identified as either hot, which need to be cooled, or cold, which need to be heated. The total energy excess or deficit can be illustrated separately by means of the Composite Curves where enthalpy is represented on the x-axis against temperature on the y-axis (Figure 2-16 a). Once the construction of the hot and cold composite curves is done, the cold composite curve is moved toward the hot composite curve in order to obtain the minimum energy target (Figure 2-16 (a)). The minimum temperature difference, Tmin, determines the closest point between the curves and the minimum temperature difference in a heat exchanger. The Composite Curves provide several important features of the thermal system, such as (Figure 2-16(b)):
Maximum potential heat recovery, QRmax: the overlap between the composite curves.
Minimum hot utility requirement, QHmin: the remaining heating needs.
Minimum cold utility requirement, QCmin: the remaining cooling needs.
Figure 2-16 Building and use of the composite curves to determine the energy targets [85]
The point of closest approach between the hot and the cold composite curves is called “Pinch point”. It separates the system into two regions: one above the pinch is the heat sink and one below
the pinch is the heat source. In Pinch Analysis, three rules should be followed to reach the minimum energy targets of the process:
Heat must not be transferred across the pinch
No external cooling above the pinch
No external heating below the pinch
For the selection of Tmin, the consideration of a trade-off between capital and energy costs is required. Higher value of Tmin causes higher hot and cold utility requirements while lower Tmin needs larger and more expensive heat exchangers in P&P processes. The optimum Tmin is approximately 10~20°C [86].
The composite curves provide the overall energy targets. However, they do not show how much energy must be supplied based on the utility conditions. The energy can be supplied by various utility levels such as different steam pressure levels, cold water, refrigeration, etc. It is necessary to design heat exchangers that maximize cheaper utility levels and minimize expensive utility levels in order to save energy cost. In fact, it is encouraged to use LP steam or cooling water instead of HP steam or refrigeration because of their cost. Therefore, the grand composite curve is used to choose the appropriate utility levels and to target the optimal heat loads.
To build the Grand Composite Curve, hot and cold composite curves are shifted by moving down the hot curve and moving up the cold curve, each by ½ Tmin until they touch at the pinch point (Figure 2-17 (b)). The grand composite curve is drawn by plotting the heat load difference between the hot and the cold composite curves, as a function of the temperature (Figure 2-17 (c)). The pinch point is where the curve touches the y-axis. From the Grand Composite Curve, the utility levels required for the process can be chosen.
Figure 2-17 Construction of the grand composite curve [85]
2.6 Water pinch
Over the past two decades, there has been a growing concern regarding freshwater consumption and wastewater treatment in the industry. The purpose of water pinch analysis is to reduce flows going to the water treatment process and to reuse them where possible. Its principles are similar to those of thermal pinch analysis. However, the driving force is the difference of contaminant concentration. Similarly in the way as energy pinch does, water purity profiles that correspond to composite curves in energy pinch are built. The flow rate is indicated on the horizontal axis and water purity is represented on the vertical axis. By moving both water source and sink curves until they touch at the pinch, water purity profiles are completed. The water pinch indicates the amount
(b) (c)
of water that can be re-used (overlapped parts), the minimum wastewater generated (on the left), and the minimum freshwater consumed (on the right) (Figure 2-18).
Figure 2-18 Water purity profiles [85]
2.7 Energy and water pinch analysis in P&P mills
pinch analysis is applied in many energy-intensive industries such as oil refining, pulp and paper, or textiles to reduce external fossil fuel consumption [86]. In the old pulp and paper mills, pinch analysis has not be considered for the energy recovery. Therefore, it is possible to obtain economically attractive energy savings just by respecting the pinch rules [87]. Actually, the Augusta Newsprint Company in the US identified overall steam savings of 42% and cost savings of $7.15 per ton of paper, Kimberly Clarke’s Coosa Pines facility in US achieved energy savings of 22% and cost savings of $15.4 per ton of paper [88]. Lafourcade, S. et al. carried out pinch analysis on TMP mills and improved the energy efficiency: the steam consumption has dropped from 60.5 ton/h to 56.1 ton/h [89]. Jacob et al. proposed water network optimization methods that can be applied to pulp and paper mills [90]. Mateos et al. performed an interaction study between the water and energy systems in a Kraft mill, showing synergistic effects of water reutilization on energy consumption [91, 92].
2.8 Critical review
Integrated forest biorefinery (IFBR) has been recommended as a reasonable alternative to overcome the current operational risk of the P&P mills and to find sustainable fuels and chemicals that can substitute petroleum-based process. The interaction between the biorefinery and the existing pulp mill in terms of material and energy should be considered without negative impacts on the quality of final products.
So far, several studies for the development of an IFBR concept were performed. However, many researches have dealt with specific parts of the process configuration in biorefinery such as pretreatment, hemicellulose extraction technology, or combining of black liquid gasification instead of the overall process [79, 93, 94].
In addition, most of the studies are focused on the Kraft pulp mill as a biorefinery receptor mill [95]. There are 28 mechanical pulp mills and 24 Kraft pulp mills in Canada [19], and the economic value of their manufacturing in 2010 were 973 M$ and 5 659 M$, respectively [96]. Therefore, research work on IFBR with a mechanical pulp mill as a receptor mill is also needed.
Most of studies on the IFBR consider the production of bio-ethanol [97], however, it is important to expand the types of final products to various value-added chemicals to diversify the sources of revenue.
In this work, overall process configurations for the production of bio-based lactic and succinic acid from a hydrolysate diverted from a TMP process were developed and simulated on Aspen Plus. The interactions between the biorefinery plant and the TMP process were analyzed in terms of heat integration. Finally, the strategies and the technical/economic feasibility of a IFBR composed of a TMP mill and a LA/SA plant were discussed.
CHAPTER 3
OBJECTIVES AND METHODOLOGY
3.1 Objectives
The main objective of this study is to demonstrate the technical and economic feasibility of an integrated forest biorefinery (IFBR) composed of a TMP process and a biorefinery plant for the production of lactic or succinic acid.
The specific objectives of this work are to:
Review the production processes for lactic and succinic acid.
Propose process configurations for the production of lactic and succinic acid from forest biomass.
Develop simulation models for both lactic and succinic acid on ASPEN Plus.
Perform energy analysis by using Pinch Analysis.
Evaluate the proposed process configurations to identify the effects from energy perspectives (e.g. heat integration potential, minimum hot and cold utility demand).
Demonstrate the technical and the economic feasibility of the concept of integrated forest biorefinery (IFBR) in a TMP process.
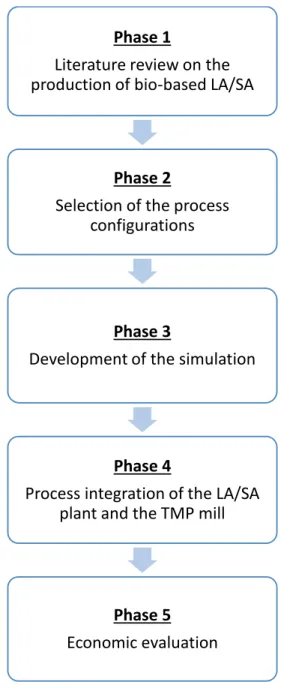
3.2 Methodology
The methodology used to develop the lactic and succinic acids IFBR is illustrated in Figure 3-1. The project consists of five phases that are listed below:
Figure 3-1 Overview of the methodology for the bio-based lactic and succinic acids IFBR development
Phase 1
Literature review on the production of bio-based LA/SA
Phase 2
Selection of the process configurations
Phase 3
Development of the simulation
Phase 4
Process integration of the LA/SA plant and the TMP mill
Phase 5
![Table 2-3 Advantages and disadvantages of different pretreatment methods of linocellulosic biomass [41, 42]](https://thumb-eu.123doks.com/thumbv2/123doknet/2336230.32750/35.918.111.810.731.1063/table-advantages-disadvantages-different-pretreatment-methods-linocellulosic-biomass.webp)
![Figure 2-16 Building and use of the composite curves to determine the energy targets [85]](https://thumb-eu.123doks.com/thumbv2/123doknet/2336230.32750/48.918.123.756.674.928/figure-building-use-composite-curves-determine-energy-targets.webp)