HAL Id: hal-00750961
https://hal.archives-ouvertes.fr/hal-00750961
Submitted on 7 Nov 2015
HAL is a multi-disciplinary open access
archive for the deposit and dissemination of
sci-entific research documents, whether they are
pub-lished or not. The documents may come from
teaching and research institutions in France or
abroad, or from public or private research centers.
L’archive ouverte pluridisciplinaire HAL, est
destinée au dépôt et à la diffusion de documents
scientifiques de niveau recherche, publiés ou non,
émanant des établissements d’enseignement et de
recherche français ou étrangers, des laboratoires
publics ou privés.
heavy precipitation events over the Mediterranean
region (France).
Jean-François Rysman, Yvon Lemaître, Emmanuel Moreau
To cite this version:
Jean-François Rysman, Yvon Lemaître, Emmanuel Moreau. X-Band Polarimetric & Doppler radar
observations of heavy precipitation events over the Mediterranean region (France).. ERAD 2012, 7th
European Conference on Radar in Meteorology and Hydrology, Jun 2012, Toulouse, France.
�hal-00750961�
X band polarimetric & Doppler radar observations of heavy
precipitation events over the Mediterranean region (France)
J.F. Rysman1, Y. Lemaître1, E. Moreau2
1LATMOS/IPSL/UVSQ-P6/CNRS, 11 Boulevard d'Alembert 78280 Guyancourt, France,
jean-francois.rysman@latmos.ipsl.fr
2Novimet, 11 Boulevard d'Alembert 78280 Guyancourt, France, emoreau@novimet.com
1. Introduction
Precipitations in the Mediterranean region are characterized by a high spatial and temporal variability. Indeed, because of its latitude (between 36° and 44° N) the Mediterranean region is affected both by sub-tropical storms and mid-latitude synoptic disturbances. Summer is warm and dry while being persistently affected by the Azores anticyclone and winter is temperate and moderately humid because of the mid-latitude westerlies. Moreover since the Mediterranean region is surrounded by mountain barriers and strong contrasts between sea and continent exist, local forcings are also important. In this context the HyMeX (HYdrological cycle in the Mediterranean EXperiment) experiment has been launched in order to better understand and quantify the hydrological cycle and related processes of this Mediterranean region. Particular emphasis is given to high-impact weather events, inter-annual to decadal variability of the Mediterranean coupled system and associated trends in the context of global change. This campaign extends from 2010 to 2020 with special intensive observing periods (SOP) involving a lot of dedicated instruments. The first SOP will begin the 5th September 2012 and will last until the 6th of November 2012. LATMOS participation, related to high precipitation events, will be done by mean of an X band polarimetric & Doppler weather Radar called HYDRIX based close to Nice in the North East of the French Mediterranean coast. This radar, owned by the LATMOS/CNRS, developed and operated by NOVIMET, collects in an operational way since 2008 reflectivity, Doppler and polarimetric data with a time step of 5 minutes and a mean spatial resolution of 1 km. The present work is devoted to the temporal and spatial characterization of the precipitation that affects the Provencal and Ligurian regions. A statistical and a spectral analysis are performed in order to establish a climatology of rain events and to determine main variability and tendency of the regional rainfall. In the following some technical information upon the HYDRIX radar and the used dataset are given in section 2 and 3. The fourth section is dedicated to the main methods used in this study to analyze the dataset. The fifth section discusses results and the conclusions are given in the last section.
2. Instrument
The X band, polarimetric and Doppler radar HYDRIX is based on Mont Vial (~ 1500 m) close to Nice in the south-eastern part of France. Main specifications are summarized in table 1. This radar is particularly efficient in mountainous region thanks to its frequency of operation and its offset feed, which reduce ground clutters. Moreover it has a reduced size (antenna diameter ~ 1.5m) and no radome. More technical information can be found in Lebouar et al. 2008 and Moreau et al. 2009.
Frequency 9375 MHz Wavelength 3.2 cm
Antenna 1.5 m (offset feed) Antenna gain 41dBZ
Scan velocity 14 deg./s in azimuth Beam width 1.5 deg
Pulse length 0.5 to 2 µs
Pulse repetition frequency 1000 Hz and 500 Hz Sensitivity 0 dBZ at 55 km or 100 km Polarization mode Simultaneous H and V
Table 1 Hydrix capabilities.
The conversion of radar reflectivity to rainfall intensity is done by the ZPHI algorithm (Testud et al. 2000). This algorithm corrects the beam attenuation along the path, and computes a N0* parameter (derived from the drop size distribution N(d)) in
order to retrieve the rain rate through the relation:
b b
Z
aN
=
R
∗1− 0An estimation of rain at ground is done using a weighted average of rainfall obtained at multiple elevations. Weights are computed base on a quality index which takes into account the altitude of measurement, water phase and beam masking. For much detailed description about those methods see Testud et al. (2000) and Lebouar et al. (2009).
Rainfall data validation has been performed by comparison with S band radar (Diss et al. 2009) and rain gage (Moreau et
al. 2009) observations
3. Dataset
The radar provides several real time quantities: instantaneous rainfall, cumulated rain, rain displacement, reflectivity and hydrometeor classification. It also provides Doppler information in rainy regions and in clear air regions close to the radar. The dataset gathers observation since March 2009 until now with nearly no interruption. The data range is 150 km with a spatial resolution of 1 km² and a temporal resolution of 5 minutes. However despite the correction of radar attenuation along the beam path, precision on rainfall estimation decreases with distance from the transmitter. Thus, for precise quantifications, we restricted our study to measurements realized at less than 60 km from the radar. All these quantities will be used to document the low level environment and the internal dynamics of rain events, their microphysics and the interaction-mechanisms leading to high-accumulated surface rainfall.
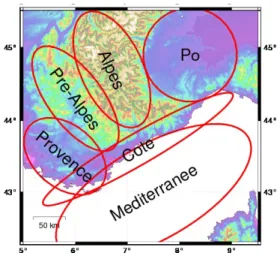
The region is particularly attractive because it covers a great number of different types of basin, topography and soil. Hence this area is divided in 6 regions (see figure 1): a high mountain region (Alpes), 2 flatland regions (Pô and Provence), a foothill region (Pré-Alpes), a coastal region (Côte) and the Mediterranean Sea (Méditerannée).
Figure 1 On the map is shown regions that were studied in different analysis.
Such a dataset with a wide range, spatially and temporally speaking, is highly valuable to study and analyze rain processes.
4 . Methods
For characterized rainfall and better understand its variability, various statistical methods were applied to the dataset including Fourier and wavelet transform, probability distribution function (pdf) and correlation. Some technical points are summarized in this section.
4.1 Wavelet analysis
To detect large scale temporal oscillations, we realized a wavelet analysis. Since Morlet had mathematically formalized it in 1984, wavelet analysis has been applied successfully in various fields (medicine, economy, meteorology). Indeed wavelets are a powerful tool to detect and analyze intermittent oscillating signals in time series.
By definition, a wavelet function satisfies two conditions: - the admissibility condition
0
)
(
=
∫
−+∞∞ψ
t
dt
with ψ the wavelet function called mother wavelet, which insures that the wavelet has a wave-like structure. This condition is very important to detect oscillations in the signal.
1
²
)
(
=
∫
−+∞∞ψ
t
dt
which insures that the wavelet has a fast-decay . This condition helps us to localize the oscillations in the time series. Wavelet function can be dilated (or contracted) and translated trough the transformation:
⎟
⎠
⎞
⎜
⎝
⎛ −
=
a
b
t
a
t
b aψ
ϕ
,(
)
1
where φ is a daughter wavelet, a the scaling coefficient and b the translation coefficient. Wavelet transform is then realize on a given f(t) function with this operation :
dt
a
b
t
t
f
a
t
t
f
b
a
C
⎟
⎠
⎞
⎜
⎝
⎛ −
=
∫
+∞ ∞ −ψ
ψ
(
))
1
(
)
),
(
,
,
(
where C are the wavelet coefficients.
For our analysis we used the Morlet wavelet function that is widely used in geophysics because its shape permits to easily detect oscillations: 2 / ² 2 / ² 4 / 1
(
)
)
(
t
−e
ite
−e
−t−
=
π
ε εψ
where ϵ is a non-dimensional number assumed to be equal to 5 in order to satisfy the admissibility condition. 4.2 Scaling
The atmosphere is a complex system where various processes with various spatial and temporal scales happen together. However this system has some statistical properties known as scaling or self-similarity that can link the different scales by only the scale ratio and a single parameter. First steps of the theory have been developed by Kolmogorov (1941) for velocity increments. He showed that power spectral density S of velocity increments follow the form (in isotropic atmosphere assumption):
S
(
υ
)
∝
ε
2/3υ
−5/3 where υ is the frequency and ϵ is the kinetic energy dissipation rate.Within a turbulent energy flow, transfer from large scales to fine scales can be seen as decreasing size eddies which separated always in the same way until dissipation scale. Despite atmosphere isn't isotropic and homogeneous and that the Kolmogorov relation has been defined in a spatial framework, lot of studies have shown that this behavior is found in most of geophysical fields (e.g. Gage 1986 (wind and temperature), Tessier 1993(clouds radiance) or Verrier 2011(rain)). We tried to verify the existence of such symmetries in our rain measurements.
5. Results
5.1 Statistical validation
As explained previously, rainfall products have been validated in term of instantaneous value in the past. These products are presently evaluated in a statistical sense based on the scaling properties of rainfall (c.f. subsection 4.2). A Fourier transform is applied on the dataset and power spectral slopes and scaling breaks position are evaluated through comparison with previous studies. Within the 60 km range around the radar, 5 km² areas are selected, their rain power spectra are calculated and averaged.
To estimate the slopes of the spectra, linear regressions are realized on a log-log representation of the spectra (see figure 2). The slopes are found to be 1.81 for periodicity lower than 2 hours, 1.5 between 2 hours and 1 day, 0.73 between 1 day and about 10 days and about zero higher. Those results, including the position of the breaks and the slopes are shown to be in good agreement with previous studies (e.g. Fraedrich and Larnder 1993). We can notice peaks related to the diurnal cycle (one day), the annual cycle and a peak at 15 minutes, which results from a change in the pulse repetition frequency of the radar (every 15 minutes) during test phases.
Figure 2 Power spectra for rainfall between 2009 and 2011. Lines highlight the 4 scaling regimes.
Despite the spectral power displays the full range of scales of rainfall, it is restricted to the second moments (variance). In order to analyze every order of moments, the probability distribution function can be analyzed. Indeed the n order moments are directly related to this function (see Schertzer 2002 for precisions). Therefore, the shape of the function is an important indicator to validate the dataset.
Results are given in figure 3 for each region indicated on figure 1. The pdfs of the different regions appear rather similar to each other except for the Pô region, which underestimates low rain rate and overestimate high rain rate. These biases result certainly from the effect of the mountain that masks over the plains of Pô low elevated precipitation events. These pdfs are lower in probability than the climatologic data corresponding to the north Mediterranean region and used by the ITU (International Telecommunication Union). It is probably related to different temporal resolutions (1 min for ITU) and to the fact that the region cover by the ITU covers the all North Mediterranean region. Moreover some rains events can be missed by the radar because of mask or beam attenuation. Nevertheless shapes are in good agreement (except for the Pô region).
5.2 Temporal variability
The rainfall behavior in the region and main processes that control precipitation can be first studied in analyzing the main cycles in the rainfall.
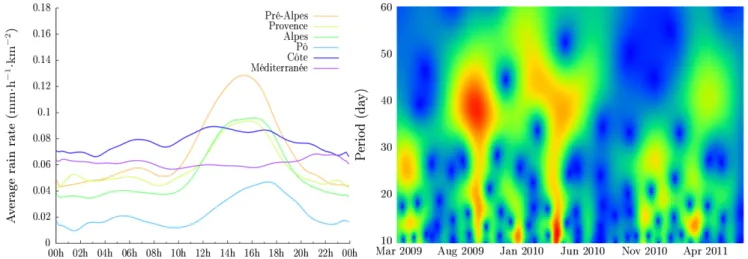
Figure 4 gives the diurnal cycle of the rain rate for the various geographical regions. Strong contrasts between the different regions can be seen. Especially, the Mediterranean and the coast keep a rather constant rainfall rate during the day whereas land regions experiment a strong diurnal cycle link to the convection in the afternoon. Seasonal variations are also important (not shown) with no diurnal cycle between October and March. During this period, rainfall is maximal on the coast and the Mediterranean. Between April and September, the average rate is maximal during the afternoon on land region and very low on the Mediterranean. Those results put in evidence that the main weather regimes are stratiform in winter and convective in summer.
Figure 4 Annual Mean of average rain rate on various domains, function of the time of the day (mm/(h.km²))
Figure 5 Wavelet coefficients for rainfall between 2009 and 2011
Figure 3 Probability distribution function of the rain rate (mm/h) for various domains and for climatologic data used
by ITU (International Telecommunication Union) corresponding to Mediterranean region
As explained previously, another way to explore cycle is the wavelet analysis. This tool is presently used to detect large scale and intermittent signals impacting the region.
Results given in figure 5 reveal significant signatures with a 40-50 days periodicity. This mode impacts fundamentally the rainfall in the region but doesn’t seem to be related to any seasonal cycle. Other studies (on wind and pressure fields) showed similar periodicity in the Mediterranean region (Gomis 2008 for instance).
In conclusion, important and variable diurnal cycles are observed in the region depending on the season and the geographical location. A large scale oscillation which influences strongly the local precipitation is also clearly detected in the rainfall.
5.3 Extreme events localization
In this section the spatial variability of extreme events is investigated statistically. As previously the pdf is computed on 5 km² area in the radar domain and the value for which rain rate is exceeded for 0.01% of the whole time series is got.
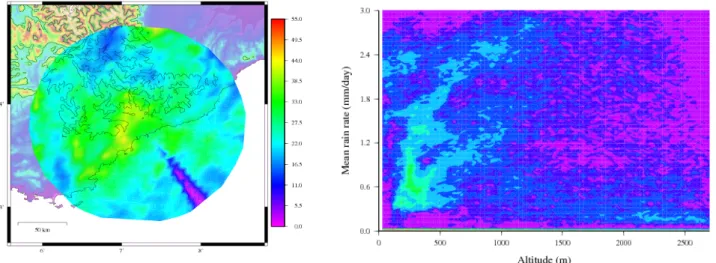
Figure 6 Rain rate (mm/h) exceeded for 0.01% of a year
Results are given Figure 6 for all the year. They highlight regions statistically prone to extreme rainfall events. It reveals that foothills and concave regions have a higher probability to be subjected to heavy precipitation than high mountain or sea. Summer months are also (not shown) prone to heavy events because of deep convection. Such results highlight the high impact of local forcing on rainfall in this region. They could be used to choose regions were mobile stations can be deployed (area were the probability of extreme events is higher).
5.4 Relationship between rainfall and altitude
Previous subsection showed that extreme rainfall events are highly space dependent. On this context which role has the relief on rainfall events ?
Figure 7 gives the rain intensity in function of the ground altitude. It shows that altitude and rain rate is positively correlated until about 1200 m. Higher such a relation doesn’t exist anymore. This result can be explained by rainfall that is essentially generated by orography. We can also notice 2 regimes of correlation, which could be related to different orientation of slope versus the main moisture flux that led to rain.
5.5 Relationship between rain displacement and rain rate
In previous subsections, we showed how rainfall is dependent on geographical characteristics of the region and time periods. In this last section, we investigated the link between rain rate and rain displacement that is coarsely connected to the local atmosphere dynamics.
Figure 7 Point density of height versus rain accumulation. Colors are logarithmically spaced.
Figure 8 Point density of rain displacement angle versus rain accumulation. O° is pointing to the North, 90° to the East. Colors are logarithmically spaced.
Results presented in figure 8 show that the most probable direction of displacement of rain events is from south-west to north-east. It is also in this direction that the daily mean rain rate is the higher. If we assume that, in average, the rain displacement is with and along the wind, this result can be explained because of the humidification by the Mediterranean Sea of the lowest layers feeding convective motions. The Mediterranean Sea appears thus as a key factor in rainfall events over the region covered by the radar.
6. Conclusion and Outlook
A 3-year rainfall time series obtained from the X band, polarimetric and Doppler radar HYDRIX is analyzed to investigate the spatio-temporal variability of rain events over the southeastern coast of France. The spatial resolution is 1 km and the temporal resolution is 5 minutes. Statistic tools such as Fourier and wavelet spectra and probability distribution functions are used for this purpose. The results show a strong spatial and temporal variability of rainfall over this region. Diurnal cycle exists only on land and high scale oscillations (40-50 days) strongly affect the area. Regions prone to heavy precipitation events are mainly foothills. Intense rain events come mainly from the southwest and results from flux bringing humidity from the Mediterranean Sea that rise over elevated foothills. Strong rain accumulation corresponds to altitude up to 1200 m.
Complementary statistical analyses such as principal component analysis are presently realized on ECMWF reanalyzes in order to know the main dynamical modes, which impact the region and are related to the present rain variability. Case studies of the dynamical and microphysical characteristics of extreme events sampled during this period (selected on the basis on the main findings of this work) will be also done. The database will be extended until 2013.
References
Gage K.S., Nastrom G.D., 1986: Scaling Theoretical Interpretation of Atmospheric Wavenumber Spectra of Wind and Temperature Observed by Commercial Aircraft During GASP. Journal of Atmospheric Sciences, 43, 729–740
Fraedrich K., Larnder C., 1993: Scaling regimes of composite rainfall time series. Tellus, 45, 289–298
Tessier Y., Lovejoy S., Schertzer D. 1993: Universal Multifractals: Theory and Observations for Rain and Clouds. Journal of Applied Meteorology, 32, 223–250
Testud J., Le Bouar E., Obligis E., Ali-Mehenni M., 2000: The rain profiling algorithm applied to polarimetric weather radar. Journal of Atmospheric and Oceanic Technology, 17, 332–356
Schertzer D., Lovejoy S., Hubert P., 2002: An introduction to stochastic multifractal fields. Mathematical Problems in Environmental Science and Engineering, Ser. Contemp. Appl. Math vol. 4. Higher Educ. Press, Beijing.
Gomis D., Ruiz S., Sotillo M.G., Alvarez-Fanjul E., 2008: Low frequency Mediterranean sea level variability: The contribution of atmospheric pressure and wind. Global and Planetary Change, 63, 215-229
Le Bouar E., Moreau E., Testud J., 2008: The rain accumulation product from the X-band polarimetric radar HYDRIX. Weather Radar and Hydrology Symposium
Diss S., Testud J., Lavabre J., Ribstein P., Moreau E., 2009: Ability of a dual polarized X-band radar to estimate rainfell. Advances in Water Resources, 32, 975–985
Moreau E., Testud J., LeBouar E., 2009: Rainfall spatial variability observed by X-band weather radar and its implication for the accuracy of rainfall estimates. Advances in Water Resources, 32, 1011–1019
Verrier S., Mallet C., Barthès L., 2011: Multiscaling properties of rain in the time domain taking into account rain support biases. Journal of Geophysical Research, 116, D20119