HAL Id: insu-01263583
https://hal-insu.archives-ouvertes.fr/insu-01263583
Submitted on 12 Mar 2021
HAL is a multi-disciplinary open access
archive for the deposit and dissemination of
sci-entific research documents, whether they are
pub-lished or not. The documents may come from
teaching and research institutions in France or
abroad, or from public or private research centers.
L’archive ouverte pluridisciplinaire HAL, est
destinée au dépôt et à la diffusion de documents
scientifiques de niveau recherche, publiés ou non,
émanant des établissements d’enseignement et de
recherche français ou étrangers, des laboratoires
publics ou privés.
Systematic lidar measurements of the stratospheric
ozone vertical distribution
Sophie Godin, Gérard Mégie, Jacques Pelon
To cite this version:
Sophie Godin, Gérard Mégie, Jacques Pelon. Systematic lidar measurements of the stratospheric
ozone vertical distribution. Geophysical Research Letters, American Geophysical Union, 1989, 16 (6),
pp.547-550. �10.1029/GL016i006p00547�. �insu-01263583�
GEOPHYSICAL RESEARCH LETTERS, VOL. 16, NO. 6, PAGES 547-550, JUNE 1989
SYSTEMATIC LIDAR MEASUREMENTS OF THE STRATOSPHERIC OZONE VERTICAL DISTRIBUTION
S. Godin, G. M6gie, J. Pelon
Service d'A•ronomie CNRS, Universit• Pierre et Marie Curie, Paris
Abstract. Lidar measurements of the ozone
vertical distribution have been performed on a
routine basis at the Observatoire de
Haute-Provence, starting in October 1986. They provide a unique data base which is used to
derive the observed seasonal behaviour of ozone
in various altitude ranges from 25 to 45 km with a height resolution much higher than previous operational systems. Comparison with Umkehr measurements performed at the same location show a rather good agreement in layers 5 and 6 with unexpected differences appearing in the uppermost layers.
Introduction
Early detection of changes in the stratospheric chemical composition and structure
related to human activities is a major issue for the protection of the ozone layer. A recent
study (NASA, 1988) shows that satellite observations alone, despite their global coverage of the stratospheric ozone field, are not sufficient to provide an accurate determination of trends, mainly because of
drifts in instrument calibration. It is thus fully recognized that complementary ground-based
measurements are a required component of any
global ozone observation system. Such
measurements should be conducted routinely from
several sites at different latitudes to constitute an effective Network for the
Detection of Stratospheric Changes (NDSC-NASA, 1986). As part of the various passive (UV-visible, infrared, microwave spectrometers) and active systems to be implemented, lidars are recognized as being the required instrument to provide the most accurate measurements of the ozone vertical distribution from the ground up
to the 45-50 km level.
Since the early development of the ozone
lidar at the Observatoire de Haute Provence (OHP
- M•gie et al., 1977 ; Pelon and M•gie, !982a) several improvements have been brought to the system which have resulted in successive increases in the maximum attainable height of the measurements (Pelon and M•gie, 1982b; M•gie et al., 1985). As a last step, a new excimer laser source has been implemented in 1986, to
improve the reliability of the system allowing
routine operation starting in October 1986 (Godin et al., 1986). Such a two years measurement period is obviously too short to
provide any indication on potential trends. The
data reported here will thus be analysed in terms of seasonal variations and compared to measurements performed at the same location by
the Umkehr technique using a Dobson
spectrophotometer (March• et al., 1983). A brief description of the system and of the data processing methods will be given in sections 2 and 3. Data analysis and results of comparison will be presented in section 4.
Operational lidar system
The lidar measurements of the ozone vertical distribution are based on the
Differential Absorption Laser (DIAL) technique (Schotland, 1964 ; M•gie and Menzies, 1980) which requires the simultaneous emission of two
laser wavelengths. The ozone absorbed wavelength (on line) is provided by a Xenon Chloride excimer laser emitting at 308 nm (Lambda Physics MG 201). An unstable resonator cavity
arrangement is used to reduce the laser divergence down to 0.5 mrad. The reference wavelength is obtained using the 3rd harmonic
(355 nm) of a Nd:Yag laser, the output energy of
which is adapted to provide a return signal
equivalent to the on-line signal at 40 km altitude. This is done to preserve the same dynamical range for the signals at the two
wavelengths in the whole altitude domain. Due to saturation problems in the photodetectors, an additional acquisition is also performed at reduced emitted energy to derive lower altitude
profiles in the 15-35 km altitude range. Further
details of the experimental procedure have been given in a previous publication (Godin et al.,
1986). In today operation, the nighttime measurement of the ozone vertical distribution in the 15-45 km range requires an integration time of 3 hours.
Data processing
Two types of errors can directly influence the
DIAL measurement of the ozone vertical
distribution. The statistical error related to
the signal to noise ratio defines the limits of
the precision of the measurement. Systematic
errors due to interferences of molecular and
aerosol scattering and extinction, and to
temperature dependence of the ozone
cross-sections will affect the accuracy of the
retrieved ozone profile. Such uncertainties ha.ve
already been quantified in previous publications
(M•gie et al., 1985 ; Godin et al., 1986). The
possible bias which can be induced by the data processing has also been carefully analysed by simulations using a direct-inverse modeling
scheme and a Monte-Carlo method (Godin, 1987).
For the present analysis this study has led to
the use of a combination of linear digital Copyright 1989 by the American Geophysical Union. filters which corresponds to a compromise at
high altitudes between the systematic bias on Paper number 89GL00261. the retrieved ozone values and the magnitu4e of 0094-8276/89/89GL-00261503.00 the statistical error in order to keep the
548 Godin et al.' Systematic Lidar Measurements
overall uncertainty of the measurement lower than 5% at 40 km for a vertical resolution of 3 kin.
Data analysis
The ozone lidar system at the Observatoire
de Haute-Provence has been operated on a research mode in 1984-1985 and on an operational
mode starting in October 1986. On the whole period, more than sixty ozone profiles have been
obtained in the altitude range from 25 to 45 km,
allowing thus a study of the absolute value and seasonal variations of the ozone content at
various altitudes. Concerning the absolute values of the ozone number density, the data
show usually a good agreement within 15% with the U.S. Standard Atmosphere 1976 values which
corroborates the already observed discrepancy
with calculated ozone vertical distributions
above 35 km. (WMO, 1985).
Furthermore, taking advantage of the unique capacity provided by the OHP Geophysical Station to obtain simultaneous measurements of ozone distribution by lidar and Umkehr technique, comparison between these two techniques can be performed on a statistically significant basis. Such comparisons require the conversion of the lidar data (number density rs. height) in units compatible with Umkehr retrieved values (partial pressure in various pressure intervals). Lidar data have first been averaged over the altitude range of the Umkehr layers using pressure-altitude conversion as given by the CIRA 1986 model which includes seasonal and
latitudinal variations. The lidar number density ozone values have then been converted to partial
pressure using temperature profiles taken again
from the CIRA 1986 atmospheric model. Both data
sets have first been compared in terms of the
seasonal variations. To that end, we have
calculated for each measurement the difference with the total mean for the years 1985-1987. Those differences, as obtained by lidar for the
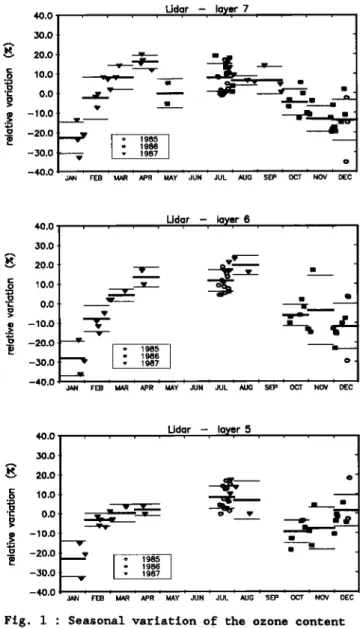
40.0
....
Ud?r -, laye.
r 7
,30.0 • 20.0 o 10.0 ß c o.o >o w -10.0 .__. _o -20.0 -,30.0 -40.0o 1985
ß 1986 - 1987FEB MAR APR MAY JUN JUL AUG SEP OCT NOV DEC
40.0
....
Lid?r
-, Ioye,
r 6
,30.0 • 20.0 • 10.0 .-- ß c 0.0.• - 10.0
_.o -20.0 -,30.0 -40.0 o 1985 ß 1986 • - 1987 i i i i i i i i i i iJAN FEB MAR APR MAY JUN JUL AUG SEP OCT NOV DEC'
40.0
....
Lid?r
- laye,
r 5
30.0 • 20.0 .o 1 o.o ß r- 0.0 > • w -10.0 • -20.0 • o 1985 I '- I ' 1986 [ -,30.0 • -40.0 i ßJAN FEB MAR APR MAY JUN JUL AUG SEP OCT NOV DEC
Fig. 1 ß Seasonal variation of the ozone content
Umkehr
layers 5(23.5 - 28 kin), 6(28-33 kin) and
as measured
by lidar at the O.H.P. and averaged
7(33-38.5 km), are represented in per cents as a
over various Umkehr layers
(a) layer 5 - 23-28
function of the day of the year and for the
three consecutive years on the figures la, lb, lc. Accurate measurements in layer 8 are yet too
few to make a significant stastistical analysis. Due to bad weather conditions in 1986 and 1987 at the end of spring in the south of France, few profiles have been obtained during this period, and none in june. Besides, as mentionned
earlier, these data correspond to different experimental set-ups and different operational
modes throughout the three years involved in this analysis. This explains the discrepancies
in the number of profiles used to determine the
seasonal variation in the various Umkehr layers. On these figures, the bold lines represent the monthly average and the thin lines the related
standard deviation. The amplitude of the
seasonal variation is defined in the following
analysis as the difference between the lowest
and highest monthly averages. In the layer 5,
(figure la), the seasonal variation of ozone is
less than 5 % if one excepts the January values. This latter corresponds in fact to only three measurements taken during consecutive days in January 1987 at a time of the year when the
km' b) layer 6- 28-33 km; c) layer 7 33-38 km)
planetary wave activity is quite strong and
drives the ozone behaviour in this altitude range. They should then not be considered as fully significative. In the above layer 6 (figure lb) the amplitude of the seasonal
variation is larger (30 %) with a summer maximum
in the ozone concentration. The standard deviation of the measurements which can be attributed to a large extent to the natural variability is larger during winter, emphasizing again the importance of dynamical processes related to wave propagation. At higher altitudes
(layer 7 - figure lc), the peak-to-peak variation is again of the order of 35 %, whereas
the shape of the variation appears different
with a maximum extending through spring and summmer. Here again the day-to-day variability is somewhat larger during the winter months.
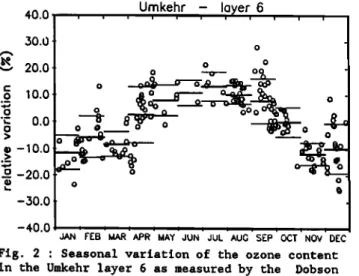
The comparison with the Umkehr retrieved
profiles show a rather good agreement with the lidar data as far as the general features of the
Godin et al.' Systematic Ltdar Measurements 549 40.0
,, , ,, U,,mkehr
!- layer
i i30.0
o
• o o -• 20.0 o oo .9 •o.o •• ••, o ß • o o.o. I o • o • T ••• • o o>
-o.o
i.Oo
• -20.0 -30.0 -•0.0JAN FEB •R APR MAY JUN JUL AUG SEP OCT NOV DEC
Fig. 2 ß Seasonal variation of the ozone content in the Umkehr layer 6 as measured by the Dobson spectrophotometer at the O,H.P,
represents the seasonal variation for the Umkehr
layer 6. The major difference lies in the
amplitude of the observed variations which are
generally 20 to 40 % higher on the 1tdar data.
This effect can most likely be attributed to the non-tndependance of the various Umkehr layers
for Dobson spectrophotometer measurements. Due to the different amplitudes of the ozone
variations throughout the altitude range, this tnterdependance results in an averaging effect
which reduces the amplitude and modifies the
phase of the altitude dependent ozone
variations. This can be further assessed if one
considers the direct 1tdar measurements at a
given altitude (35 km ñ 1 km, figure 3) obtained
with a higher vertical resolution which show a
significantly larger peak-to-peak amplitude 50 •).
To allow a further comparison of the
absolute values of the ozone concentration as
retrieved by lidar and by the Umkehr technique at the OHP, all profiles coincident in time have been averaged to provide an accurate estimate of a possible bias. 25 profiles were compared as shown on figure 4 (Umkehr minus ltdar refered to Umkehr values) showing a negative bias at lower
altitudes (layers 5 and 6) shifting to a
positive bias increasing up to 10 % in the upper layers 7 and 8.
To account for a possible effect of the seasonal variation, comparisons have also been made
averaging only summer-time measurements (figure 4) which shows however similar values of the
bias. As measurements
were taken in the years
1985-1986, one should not expect a large effect
of aerosol interferences in the Umkehr
measurments as the high stratosphertc aerosol
load following the E1 Chichon eruption
(Mars-April 1982) had already decreased by one
order of magnitude resulting in optical
thicknesses below 0.015 as measured by lidar at the same site. This value is compatible with the observed bias in layers 5 and 6 (De Luisi, 1979) whereas it could not explain the positive bias observed in the upper layers and especially the large bias observed in layer 7. It should be
mentionned however that a similar positive bias
has been found between the SAGE I and the Umkehr
ß 10 •2 2.5 0.0 Lidor - 35 ñ 1 km I i i i i i I i i o 1985 ß 1986 ß 1987 I I I I I I I I I I I JAN FEB MAR APR MAY JUN JUL AUG SEP OCT NOV DEC
Fig. 3 ß Seasonal variation of the ozone number density at 35 _+ 1 km as measured by lidar at the
O.H.P.. The monthly averages are given by the
thick lines and the standard deviations are indicated by the thin lines.
summertime measurements, based on 36
observations performed in 1979 and 1981
(Newchurch et al., 1987). Extension of the lidar
data base to provide monthly averaged
comparisons will bring further information on a
potential seasonal variation of the bias
allowing thus to distinguish between the various influencing factors related to data conversion
such as temperature, pressure and geopotential
height.
Conclusion
Operational lidar measurements performed at
the Observatoire de Haute Provence (1985-1987)
confirm the ability of,such systems to provide a
continuous survey of,, the ozone vertical
distribution
in the 25-45 km altitude range.
Lidar observed seasonal variations of the ozone concentration give evidence for a transition
between dynamically controled region at lower
altitude
and photochemical influence at upper
level. If the same features are also observed on
4O .• 35 E
025
:
ß Annual * Summer'
•
1
'0
2'0
20
30 -20
0
0
30
Bias (umkehr-lidar)Fig. 4 : Relative bias between the Umkehr and lidar measured ozone vertical distribution at
O.H.P. The error bars indicate the la confidence
550 Godin et al.' Systematic Lidar Measurements
Umkehr measurements, lidar observations show distribution verticale d'ozone dans la haute
larger amplitudes in the retrieved variations stratosphere. Th•se de Dpctor.at ... de
related to the higher vertical resolution of the l'Universit• Pierre et Marie Curie, Paris.
system. In terms of absolue values, Godin S., G. M•gie, J. Pelon, A.J. Miller, R.M.
statistically significant comparison show a rather good agreement between lidar and Umkehr retrieved ozone values in layers 5 and 6, although unexpected positive bias corresponding to larger Umkehr values are observed in layers 7 and $.
Comtinuation of the ozone lidar operation
are planned to imcrease the data base. They are complemented by other lidar measurements of
aerosol and temperature, automated Dobson
Nagatani and A.J. Fleig (1988) :Comparison of the ozone vertical distribution obtained
by lidar and by the SBUV instrument. Quadrennial Ozone..Symposium, ed. R. Bojkov
and P. Fabian, G6tttingen (RFA).
March• P., Meunier C., Barbe A. and Jouve P.
'(1983) : Total atmospheric
ozone
measured
by
ground-based high resolution infra-red
spectra. Comparison with Dobson measurements.
planet. Space Sci., 39, 791.
observation of the total ozone content and M•gie G., J.Y. Allain, M.L. Chanin and J.E.
vertical distribution by the Umkehr technique. Blamont (1977) ß Vertical profile of
Future addition of microwave measurements
of
stratospheric
ozone (18-28 km) by lidar
chlorine monoxide distribution and UV-visible sounding from the ground. Nature, 270, 329i
spectrometer measurements of ozone and nitrogen M•gie G. and R.T. Menzies (1980) ß dioxide is also planned. The global system such Complementarity of UV and IR differential implemented at the Observatoire de Haute absorption lidar for global measurements of Provence will thus constitute the basis of an atmospheric species. ADD1. Opt,, 19,!7 1173 , ß
established site
of the future Network for
M•gie G.,
G. Ancellet
and J. Pelon (1985) ß
Detection of Stratospheric Changes. Lidar measurements of ozone vertical profiles. Appl. Opt., 24, 21,3454-3463.
•NASA (1986)'Network for•ith e Detection
Ac•mowled•ements.
The. Geophysical
StatiOn
StratOsPheric Changes•,•!•i!•Repor
t
at the Observatoire de Haute Provenc e is
operated with the financial support of the
french Centre National de la Recherche
Scientifique, Institut National des Sciences de l'Univers, Centre National d'Etudes Spatiales
and Minist•re de l'Environnement. The
Workshop, Boulder, Colorado, March 5'7, 1986. •
Atmospheric Research Program, NASA Headquarters, Washington D.C..
NASA (1988) ß Present state of knowledge of the Upper Atmosphere 1988 ß An Assessment Report.
NASA Reference Publication 1208, OSSA,
implementation of the ozone lidar has been
Washington
D.C., August 1988.
•upported by a
grant
from
the
Chemical
Pelon J. and G. M•gie (1981) : Ozone monitoring
Manufacturers Assiociation FPP Pannel. The in the troposphere and lower stratosphere :
authors wish to thank particularly
Philippe
evaluation and operation of a ground based
Gil•arg
for his contribution to the system
lidar station. J. Geophys• Res.,, 87, C7,
operation and data acquisition, J.P. Schneider 4947-4956. ß
and F. Syda for their responsability in the Pelon J. and G. M•gie (1982) 'Ozone vertical
overall maintenance of the station, and P.
March,, A Bekkadour and C. Da Canceicao for
providing the Dobson data.
References
De Luisi J.J. (1979) ß Umkehr vertical ozone
profile errors caused by the presence of stratospheric aerosols. J. Ge.0ph•s..
Res,,84,766.
Godin S., J. Pelon and G. M•gie (1986) 'Lidar
Stratospheric Measurements at the
Observatoire de Haute Provence. 13th
International Laser Radar Conference, NASA
Conference Publication G2431, 215.
Godin S. (1987) ß Etude experimentale par
t•l•d•tection laser et mod•lisation de la
distribution and total content using a ground based active remote sensing system. Nature,
299, 137-139.
Schotland R.M. (1964) : The determination of the
vertical profile of atmospheric gases by
means of a ground based optical radar. Proceedings of the •rd Symposium..on Remote Sensing of the Environment, Ann Arbor,
U.S.A..
5. 'Godin, G. M•gie, J. Pelon, Service
d'A•ronomie d u CNRS, Universit• Pierre et Marie
Curie, Tour 15-14 5•me •tag e, 4 Place jUSsieu, 75230 Paris Cedex 05.
(Received December 30, 1988;