Publisher’s version / Version de l'éditeur:
Canadian Geotechnical Journal, 2, 4, pp. 313-326, 1965-12-01
READ THESE TERMS AND CONDITIONS CAREFULLY BEFORE USING THIS WEBSITE.
https://nrc-publications.canada.ca/eng/copyright
Vous avez des questions? Nous pouvons vous aider. Pour communiquer directement avec un auteur, consultez la première page de la revue dans laquelle son article a été publié afin de trouver ses coordonnées. Si vous n’arrivez pas à les repérer, communiquez avec nous à [email protected].
Questions? Contact the NRC Publications Archive team at
[email protected]. If you wish to email the authors directly, please see the first page of the publication for their contact information.
NRC Publications Archive
Archives des publications du CNRC
This publication could be one of several versions: author’s original, accepted manuscript or the publisher’s version. / La version de cette publication peut être l’une des suivantes : la version prépublication de l’auteur, la version acceptée du manuscrit ou la version de l’éditeur.
For the publisher’s version, please access the DOI link below./ Pour consulter la version de l’éditeur, utilisez le lien DOI ci-dessous.
https://doi.org/10.1139/t65-047
Access and use of this website and the material on it are subject to the Terms and Conditions set forth at
Correlating freeze-up and break-up with weather conditions
Williams, G. P.
https://publications-cnrc.canada.ca/fra/droits
L’accès à ce site Web et l’utilisation de son contenu sont assujettis aux conditions présentées dans le site LISEZ CES CONDITIONS ATTENTIVEMENT AVANT D’UTILISER CE SITE WEB.
NRC Publications Record / Notice d'Archives des publications de CNRC:
https://nrc-publications.canada.ca/eng/view/object/?id=db8b0e24-339f-4a24-97c2-47acbaedbfd3 https://publications-cnrc.canada.ca/fra/voir/objet/?id=db8b0e24-339f-4a24-97c2-47acbaedbfd3A N A L Y Z E D
CORRELATING FREEZE-UP AND BREAK-UPWITH WEATHER CONDITIONS
The results of studies on the relation be- tween freeze-up, break-up and weather condi- tions for a small fresh-water lake in the Ottawa area are reported. Techniques using air temperature records for estimating when a solid ice-cover will form on the lake are investigated. I\ formula using weather records is also developed for estimating the time taken for ice to melt from the lalce. The usefulness of these relatior~ships for estimating "freeze-up" and "break-up" dates for rivers and lakes is discussed.
Cet article prCsente les resultats d'etudes faites dans le but d'etablir le temps de prise et de dCb%cle des glaces en fonction des con- ditions atmosphbriques pour un petit lac dans la rCgion dlOttawa. Les techniques d'estima- tion de la date de prise du champ de glace ii partir des relevCs de la tempCrature de l'air ont Ct6 examinCes et une formule permettant d'estimer, ii partir des donnCes mCt6oro- logiques, le temps requis pour la for~te de la glace sur le lac a CtC dCveloppCe. L'utilite de ces relations servant A estimer les dates de prise et de dhb%cle des glaces sur les rivibres e t les lacs est discuthe.
T h e first ice cover or freeze-up in early winter marks the end of water navigation and the end of the season when run-off from rainfall will increase the water supply in reservoirs. Spring break-up (defined as the complete clearing of ice covers from rivers, laltes, and harbours) marlts not only the beginning of the navigation season, but also the time when depleted water reservoirs will be filled by spring run-off. Although the prediction of freeze-up and break-up would be of great value in planning construction, logging, navigation, and hydro-electric operations, i t is only in very recent years that organized efforts have been made t o assemble the basic information available in Canada on this problem (Meteorological Branch, DOT, 1959).
One approach to the prediction of freeze-up and break-up is through a statistical analysis of past records (i\iIacI<ay, 1962a; Cote, 1950). With such an analysis it is possible to use past freeze-up or break-up records as a guide to what can be expected in the future. This approach has limitations, however, which can best be illustrated by an analysis of some available freeze-up and break-up records.
The results of statistical analysis of relatively long-term records from several laltes and rivers are tabulated in Table I. T h e difference, in days, between the dates of earliest and latest freeze-up and between the dates of earliest and latest break-up are shown. T h e 10 per cent level (one year out of ten) was used to define these dates. T h e difference for freeze-up varies from 14 to 37 days for the rivers and lakes analysed; that for break-up varies from 20 to 45 days. This type of statistical analysis of past records enables one to estimate only that freeze-up or break-up will probably occur within a period of several weeks.
Freeze-up and brealt-up records seldom show a cyclic pattern from which future trends can be established. For example, an analysis of 106 years of
*Snow and Ice Section, Division of Building Research, National Research Council, Ottawa. Canada.
314 CANADIAN GEOTECHNICAL JOURXAL
break-up records for Lake Mendota, Wisconsin (Ragotzkie, 1960), shows that in 1880-81 freeze-up occurred on 23 November and break-up on 3 May, a duration of ice cover of 161 days and one of the longest on record for that lake. T h e next winter season, 1881-82, freeze-up occurred on 2 January and break-up on 21 March, a duration of ice cover of 78 days and one of the shortest on record.
Attempts have been made to improve on this statistical type of prediction by correlating meteorological elements with ice conditions so t h a t weather fore- casts can be translated into ice forecasts. T h e usual procedure is to correlate accumulated degree days (the differences between air temperature and a given base tenlperature for a given period) with freeze-up and break-up dates. Stanltiewicz (1947) used this degree-day technique for estimating from air temperature records the date when a river would be open for driving logs. Mackay (1961), in a study of freeze-up and break-up of the lower Mackenzie River, related a weighted air temperature, based on the estimated flow time of the river, to freeze-up. Burbidge and Lauder (1957), in a preliminary investiga- tion of freeze-up and break-up, presented some relationships between degree days and freeze-up and break-up. More recently, Bilello (1964) presented a n improved technique for forecasting river and lake ice formation using air temperature records, and MacKay (1962b) studied in some detail the factors t h a t affect freeze-up and break-up on the Nelson River drainage system. T h e use of weather information for predicting freeze-up and break-up has limita- tions, however, which are considered in this paper.
In 1956 observations on initial ice formation, on the rate of ice growth in winter, and on the rate of ice melt in spring were initiated a t RIcKay Lake, a small, sheltered lake located within the city of Ottawa. Ice thickness observa- tions were used, along with ice thickness records from other lakes, in a statistical analysis of ice growth rates and maximum ice thicknesses (Williams, 1963b). In 1959 observations on water temperature in the fall cooling period were included in this program. Heat losses determined from these temperature measurements were shown to be approximately proportional to the difference in temperature between the water surface and the air, indicating that the energy gained by solar radiation equals that lost by evaporation (Williams, 1963a). These water temperature observations, together with observations on initial ice formation and ice melt, are analysed and used in this paper to establish relationships between freeze-up and break-up and weather.
ENVIRONMENTAL FACTORS AFFECTING FREEZE-UP AND BREAK-UP
Some background information on the environmental factors that affect freeze-up and break-up may be useful.
T h e formation of a solid ice cover a t freeze-up is determined by the following factors: heat exchange with the atmosphere, heat stored in a water body, and inflow of warm or more saline water to a site.
1. Atmospheric heat exchange (the rate of heat loss from the water surface to the surrounding air) is determined by the weather conditions that prevail during the period prior to freeze-up. Air temperature, wind velocity, and solar
WILLIALIS: CORIIEI.ATING FREEZE-UP AND BKEAIC-UP WITH WEATHEll 315 radiation are the ~iiost important weather elements affecting this rate of heat loss.
2. T h e heat stored in a water body is a function of water depth. In general, t h e deeper the lake, the deeper the convective mixing and the slower the rate of cooling for a given surface heat loss. In rivers the water is lcept a t nearly the same temperature by turbulent mixing, b u t t h e deeper the river the slower t h e rate of cooling for a given rate of heat loss.
3. Inflow of heat from upstrean1 sources such as water flowing from a deep
reservoir can delay or prevent sheet ice forniation on a river. In salt-water harbours inflow of more saline water because of density currents can also retard the formation of a n ice cover.
T h e clearing of ice from bodies of water a t break-up is affected by the follow- ing factors: heat gain from the at~nosphere, snow and ice conditions, wind and currents, and inflow of warm or more saline water to a site.
I . T h e heat gained from the atniosphere, principally fro111 solar radiation, weakens and melts the ice; the reflectivity of the snow or ice surface determines t h e amount of solar radiation absorbed.
2 . T h e thicltness of the snow and ice determines the amount of ice to be melted, and this affects the duration of the break-up period.
3. Of great importance is t h e mechanical action of wind and currents in break-
ing up t h e ice and mixing i t \vitIi warmer sub-surface water.
4. I n salt-water harbours n-ind and current can break u p the ice so t h a t i t is mixed with more saline water. Run-off water also from surrounding land areas can accelerate break-up, a s can the flow from southern portions of a northward- flowing river affect t h e break-up of t h e northern section.
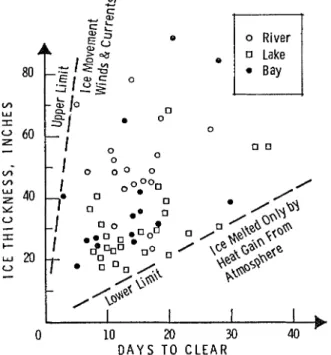
T h e mechanical breaking of solid cover by wind and currents can sometimes be more important in t h e break-up process than the heat gained from the atniosphere. T o illustrate tlie difference between break-up due almost entirely to heat gained from the atmosphere and breali-up resulting froni wind or currents, some available break-up records for several laltes, rivers, and salt- water harbours in Canada were analysed (Rleteorological Branch, DOT, 1959). T h e number of days from the time the ice thickness was last measured in the spring to the time when it was completely cleared was related to the total ice thickness a t t h e time of the last measurement (Figure I ) . T h e co~nparison shows the great variation in the rate a t which ice disappears from different bodies of water. T h e lower limit, where t h e ice liielt is due entirely to t h e heat from tlie atmosphere, is about 1 in./day. This is less than one tenth the upper limit where the ice is cleared from a river or harbour largely by wind and current effects.
Ice break-up caused only by heat froni t h e atmosphere will probably occur for a relatively s ~ n a l l percentage of laltes, rivers, and harbours. Even for quite small lakes, wind effects can be appreciable. After observing ice break-up for several years on laltes in Kew Brunswiclt, Smith (1951) stated: ''\b7ith strong winds the ice disappeared simultaneously froni several small lakes, b u t with calm weather, such a s in 1943, a number of days may intervene between their break-up dates."
CANADIAN GEOTECHNICAL JOURNAL
ul
o River
n Lake
D A Y S T O C L E A R
FIGURE 1. Comparison of number of days for ice to dis- appear with ice thickness a t time of last measurement.
when it will melt, wealten, and disappear are complicated and interrelated. Of all these factors, however, the rate a t which heat is gained or lost a t the surface because of prevailing weather conditions is usually dominant. Even when wind and currents accelerate break-up by mechanically breaking the solid cover the ice has often been weakened previously by mild weather. A large part of forecasting freeze-up or break-up dates a t any site is thus a problein of relating weather conditions t o ice conditions. I t is for this reason that the relation between freeze-up and break-up and weather conditions was investigated on a sheltered lake where atmospheric heat exchange was dominant and effects of wind and current were minor.
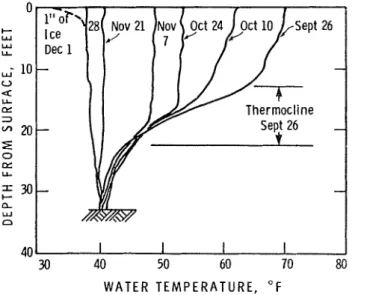
Figure 2 shows typical water temperature profiles a t McI<ay Lake from the beginning of the fall cooling period in 1961 until freeze-up. T h e profiles obtained for other years were similar, although there were some differences in the thiclt- ness of the thermocline a t any particular time. After the water became iso- thermal a t 39 to 40 OF, the surface water remained a t the surface and quickly cooled to 32 OF. With further cooling sheet ice started to form.
T h e observations show that the cooling of a fresh-water lake is divided into two stages: gradual cooling until all the water is a t a temperature of about 39 OF, and cooling of a shallow layer of surface water from the time the water is isothermal a t 39 OF until sheet ice forms. Predicting freeze-up dates is a two- fold problem: to predict when the water will become isothermal a t 39 OF, and when ice will form after the water temperature has reached 39 O F .
WILLIAMS: CORRELATING FREEZE-UP 4 N D BREAK-UI' WITH WEATHER 317
40
30 40 50 60 70 80
W A T E R T E M P E R A T U R E , " F
FIGURE 2. Typical water temperature profiles, McICay Lake, 1961.
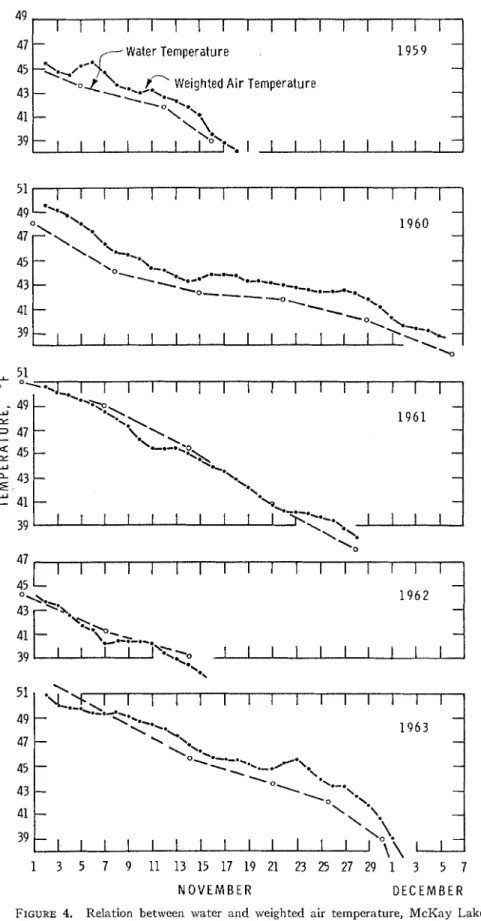
These two aspects can be illustrated by plotting changes in surface water temperature during several fall cooling periods (Figure 3). While the lake is cooling to 39 O F the rate of change of the water surface temperature parallels
the rate of change of mean air temperature. During this period the lake has a large thermal inertia and surface heat loss cools it to a considerable depth. In McKay Lake the effects of cooling extend 15 to 20 feet below the surface and i t thus takes considerable surface cooling to change the surface temperature
10 20 30 9 19 29 9 19 29 8 18 28 8 18 A U G S E P T O C T N O V
318 CANADIAN GEOTECHNICAL JOURNAL
appreciably. When the lake water becomes isothermal a t 39 OF, however, surface heat loss affects only a thin surface layer of water so that surface temperature is I I I U C ~ more sensitive to the weather and fluctuations in it.
Surface water may be quiclcly cooled to 32 OF and ice will form if cooling continues. This ice may melt again or freeze into a permanent cover, depending on the weather conditions.
T h e sensitivity of surface ice formation to variable weather conditions during this final stage of cooling is one reason why freeze-up dates fluctuate within rather wide limits (Table I). In 1962 the duration of the second stage of cooling
Difference in Days between the 10 per cent Level Early and Late Freeze-up and Early and Late Break-up for Some Lakes and Rivers
Difference between Difference between dates of earliest and dates of earliest and latest freeze-up latest break-up
Body of water Years of record (10 per cent levels-days) Reference
Charlottetown 37 22 37 Met Branch
Harbour 1959
Christina L. B C
L. Mendota
Port Arthur and 59 1 4
Fort William South Bay 29 16 (Coral Harbour) Mirarnichi R. 128 27 North Sasltatchewan R. 56 20 (Edmonton) Coppermine R. 28 18 45 Met Branch 1950 20 Met Branch 1959 31 Ragotzlrie 1960 25 Met Branch 1959 22 Met Branch 1959 20 Met Branch 1959 2 1 Met Branch 1959 20 Met Branch 1959
was 28 days (14 Novenlber to 13 December); in 1963 it lasted only 5 days (30 November to 4 December).
Because surface water temperature change parallels air tenlperature change during the first stage of cooling, it should be possible t o establish a relationship between air and water temperature. Such a relationship has been established for sea water where, because the maximum density of salt water depends on salt concentration, convective mixing is maintained until it cools t o the freezing point, and there is generally no second stage of cooling. For example, Rodhe (1952) used a relationship between mean daily air temperature and water temperature for predicting ice fornlation in the Baltic.
WILLIAMS: CORRELATING I ~ R E E Z E - U P AND BREAK-UP WITH WEATHER 319
T h e mathematical expression, based on the assumption that the rate of heat loss from a water surface depends on air-water temperature difference, is:
where T w = surface water temperature, which remains essentially constant to
depth D (depth of convective mixing), TA = air temperature,
A = area of water,
s = specific heat of water,
ho = coefficient of heat transfer from a water surface.
This equation can be reduced to that used by Rodhe by letting I< = ho/Ds, which can for practical purposes be treated as a constant with the iriverse dimensions of time. Equation (1) then becomes:
(2) dTm/dt = K ( T w - TA)
Bilello (1961) used the technique developed by Rodhe to compute from daily air temperatures the date of ice formation a t several locations in the Arctic. A value of K-' was found by trial and error for each location. Once K was determined, it was possible to malie a reasonably accurate estimate of the date of ice formation from daily air temperature records.
Using the computation procedure outlined by Bilello, I<-' was calculated to be 17.5 days for the period 1 October to 28 November 1961 for McI<ay Lake. With this value of I<-' mean air temperatures were used to con~pute synthetic water temperatures for the first stage of fall cooling for McI<ay Lake for the years 1959,1960, 19G2,1963. Figure 4 shows the result of plotting the calculated water teinperature against the measured water temperature. By this procedure the date when McKay Lake would become isothermal a t 39 OF (obtained from synthetic water temperatures) agreed with the actual date within +3 days, an error about the same as that obtained by Bilello for estimating freeze-up dates in the Arctic.
T h e relationship between air temperature and surface water temperature cannot be applied after a sheltered fresh-water lake becomes isothermal a t 39 OF because the water surface temperature is much more sensitive to the weather and may be quickly cooled t o 32 "F. During this second cooling stage it was found that accumulated degree days, using 32 OF as a reference tempera- ture, could be correlated with the time taken for a solid ice cover to form on the lalie. T h e basis for this relationship is that during this final cooling stage the lake-water surface temperature is close to 32 OF, and the rate of heat loss is approximately proportional to (TA
-
32)OF.Accumulated degree days for i\/IcKay Lake were calculated for 1950 to 1963 from the time the lake water was isothermal a t 39 OF until 4 to 6 in. of ice had formed. A solid cover of 4 to 6 in. was used as a reference because this thickness of ice will generally not melt during subsequent mild weather. Figure 5 shows that the accun~ulated degree days during this second stage of lake cooling varied from 70 to 100 for the five years studied. After the lake water became
49 1 1 1 1 1 1 1 1 1 1 1 1 1 1 1 1 1 ' 47
-
-Water T e m p e r a t u r e 1 9 5 9-
-
43-
Weighted Air T e m p e r a t u r e-
41-
-
. . 1 1 1 1 1 1 1 1 l J-
1 9 6 3 47-
-
45-
-
43-
,0\.-.
-
41-
39-
1 3 5 7 9 11 13 15 17 19 21 23 25 27 29 1 3 5 7 N O V E M B E R D E C E M B E R FIGURE 4. Relation between water and weighted air temperature, McKay LakeWILLIAMS: CORRELATING FREEZE-UP AND BREAK-UP WITH WEATHER 32 1
D U R A T I O N O F S E C O N D C O O L I N G S T A G E , D A Y S
FIGURE 5 . Accumulated degree days during period from when water temperature 39 "F
until 4 to 6 in. of ice forms, McICay Lake.
isothermal a t 32 O F the first sustained period of cold weather, usually from
3 to 5 days, would result in an ice growth of 4 to G in. By using this relationship the time taken for a solid ice cover of 4 to G in. to form could be estimated from air temperature records to within a day or two.
Predicting the date when a sheltered lake will be completely free of ice is somewhat different from predicting when a solid ice cover will first form. Predic- tion of freeze-up depends almost entirely on prediction of weather conditions, but prediction of break-up depends not only on weather conditions but also on the thickness of ice to be melted and the condition of the ice surface, including the depth of snow cover. In the fall the rate of heat loss from open water can be related to the air-water temperature difference because solar radiation approxi- mately equals evaporation. During the spring melt period the heat from solar radiation is usually much greater than evaporative heat loss and, consequently, calculations of the heat gained a t melting ice surfaces must include heat gained from solar radiation.
In a previous study on the use of dust to advance the break-up of ice on lakes and rivers (Williams and Gold, 1963) a simplified heat balance equation was used for estimating the heat gained a t a melting ice surface. A modified form of this equation is:
where
Qm = net heat gain a t melting ice surface,
CANADIAN GEOTECIINICAL JOURNAL
Ae = (e, - e,), e, equals saturated vapour pressure of air a t tempera- ture of surface and ea equals vapour pressure of air (mbs), AT = (Ts - Ta), Ts temperature of surface, and Ta equals temperature
of air (OF),
Rsw = Incoming short-wave radiation (cal./sq. cm./24 hr).
Equation (3) was used to calculate the heat available for melting ice in each spring melt period a t McKay Lalte for the ten years from 1952 t o 1961. In malting the calculations the following assumptions were made, based on field observations in the Ottawa area from 1956 to 1963:
I. If the daily air temperature was above freezing the surface te~nperature was assumed equal to 32 OF.
2. If the daily air temperature was below freezing, the surface temperature was assumed equal to the daily air temperature.
3. Values of albedo or reflectivity of the melting surface were assumed as
follows:
(a) if air temperature was above 32 OF, albedo equalled 50 per cent;
(b) if rain occurred, the albedo was assumed t o be 40 per cent for the two days following the rain, then 50 per cent if air temperature was above 32 OF;
(c) if new snow occurred, the albedo was assumed to be 80 per cent on the first d a y after the snowfall, 70 per cent after the second day, and 50 per cent if air temperature was 32 OF by the third d a y ;
(d) in the late stages of melting, if the air temperature was above 40 OF for several days, the albedo was assumed to equal 40 per cent.
4. T h e beginning of the effective melt period was assumed to start when the five-day average air temperature was above 35 OF.
5. T h e end of the melting period was taken as the time when ice completely melted from the lake.
A check on the accuracy of the calculated total heat loss was obtained by comparing it with the heat required to melt the thicltness of ice recorded a t R/IcI<ay Lalte a t the beginning of the break-up periods (prior t o 195G maximum ice thickness was estimated from ice thicltness records on other lakes in the Ottawa area). T h e calculated heat is compared with the heat required to melt the observed thicltness of ice in Table 11. Considering the inany assumptions made, the agreement is surprisingly good.
T o show the relative importance of the different components of the heat exchange, these are tabulated in Table I11 a s percentages of the total calculated melt. T h e importance of each component varied considerably from year to year. The short-wave radiative heat gain varied from 65 to 109 per cent, the evaporative heat loss from 2 to 29 per cent, and the combined long-wave and convective heat gain from 20 t o 40 per cent of the total melt. I t is considered that these percentages are representative of the relative importance of the different coinponents of the heat balance in melting the ice cover of a sheltered lake in the Ottawa area.
These calculations illustrate the importance of solar radiation in the ice melting process. Because the albedo of the ice surface is highly variable, i t will always be difficult to estimate accurately how much incorning solar energy goes
WILLIAMS: CORRELATING FREEZE-UP AND BREAK-UP WITH WEATHER 323 TABLE I1
Conlparison of Calculated Heat Gain to Heat Required to Melt Ice Break-up period 1952-61, McICay Lake
Heat required
Calculated heat melt ice Per cent
Year (Btu) (B tu) difference
TABLE 111
Calculated Percentage of Total Melt Caused by Different Components of Heat Exchange Break-up period 1952-61. McICay Lake
Percentage of Total Melt Long-wave Short-wave radiation and
Year radiation convection Evaporation
to melt ice, unless actual measurements of albedo are made a t several represen- tative locations on a lake.
As an outconle of the preceding analysis a simplified heat exchange formula was developed combining a solar radiation term with a degree-day term: (4) Qm = 0.5 ZRsw
+
10 ZAT cal./sq. cm.where
Qm = heat available for melting lake ice,
ZRsw = accumulated short-wave radiation over break-up period (cal./sq. crn.),
324 CANADIAN GEOTECHNICXL JOURNAL
This formula assumes that the albedo of the ice cover equals 50 per cent during the entire break-up period. The term 10 A T in equation (4) was derived from the combined long-wave radiatioil and convection equatioils previously developed in equation (3). The evaporation term is not included in this simpli- fied formula. T h e units (OF and cal./sq. cm.) are used because air temperature and solar radiation are normally recorded a t Canadian ineteorological stations in these units.
In using this formula the active melt period is assumed to begin when the five-day average air temperature is 35 "I; or above. (Thus degree-day accumula- tions and solar radiation accumulations are started a t this time.) This arbitrary rule has some physical basis as, judging from the RIIcKay Lake observations, unless average air temperature is well above 32 "I;, melting of lalte ice during the day is offset by freezing during the night.
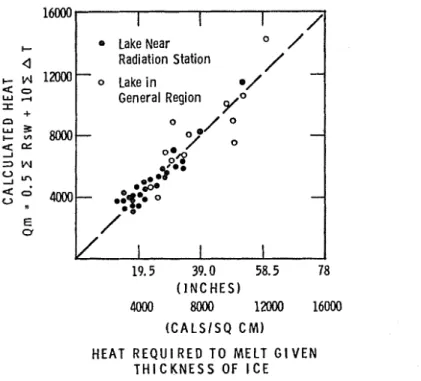
T h e formula was checked by comparing the melt estimated from the reported decrease ill ice thiclcness a t several Canadian stations with the melt calculated by formula. Only those periods during which decrease of ice thickness was estimated to be entirely due to heat excliange from the atmosphere were considered; in most cases the period of calculation was for only part of the melt period. Solar radiation and air temperature records used in the formula were obtained froin meteorological stations located near where ice thickness observa- tions are made. Unfortunately, there are few stations in Canada where both radiation and ice thickness records are maintained. Those available, usually with quite short records, were Knob Lake, Churchill, Resolute, Moncton (NIcLaughlin Reservoir), and Ottawa (NIcKay Lake). In addition, radiation ob- servations a t Churchill were used to calculate the rate of melting a t Brochet and Ennadai Laltes, two fresh-water laltes several hundred miles west of Churchill.
I t was expected that the computed melt for Brochet and Ennadai Laltes would not be very satisfactorv. T h e results of the analysis (Figure G) indicate, however, that this simplified forn~ula gives a reasonable estimate of the rate of melting of ice covers on sheltered lakes. I t s accuracy will depend on how closely the necessary assumptions, such as t h a t coilcerning the albedo, fit the actual situation a t a particular lalte. T h e accuracy of the formula should be greater the closer the radiation observation site is to the lake.
I t should be emphasized that estimating the rate of ice melt with equation (4) is only part of the problem of estimating the date of break-up. For exposed laltes and rivers the influence of wind and currents must also be considered. There is some indication that break-up of ice on a river (Stanlciewicz, 1947) or of ice on a large exposed lake (Richards, 1963) will occur after a specific amount of melting, and that equation (4) or some modification of it can be used to estimate the date when a river or large lalte will clear. Studies would have to be made, however, a t individual sites for a number of years before the value of such formulae for estimating break-up dates could be established.
T h e relation between freeze-up, break-up, and weather conditions was inves- tigated for five winter seasons a t a small fresh-water lake sheltered from wind
WILLIAMS: CORRELATING FREEZE-UP AND BREAK-UP WITH WEATHER 325 Lake Near Radiation Station
/
-
0 Lakein General Regionyo
"
1
I
I
I
I
19.5 39.0 58.5 78 ( I N C H E S ) 4000 8000 lZOOO 16MW) H E A T R E Q U I R E D T O M E L T G I V E N T H I C K N E S S O F I C EFIGURE 6. Heat required t o melt ice vs. calculated heat.
action where heat exchange with the atmosphere is the dominant factor affecting ice formation a t freeze-up and ice melting a t break-up. The follo~ving conclusions were obtained :
1. Freeze-up occurs in t ~ v o stages. During the first stage there is gradual cooling of water to a depth of 15 to 20 ft. below the surface until all the water is isothermal a t a temperature of about 39 OF. During the second stage, from the time the water is isothermal a t 39 OF until sheet ice forms, only a thin layer of surface water is cooled and thus surface temperature is much more sensitive to fluctuations in the weather.
2. During the first stage of cooling, air temperature can be correlated with surface water temperature. The rate of change of water temperature dT,,/dt can be equated with K ( T w - TA) where K is a constant and
T w
-
T A is air- water temperature difference. Using this relationship the date when a sheltered lake becomes isothermal a t 39 OF can be calculated from air temperature records.3. During the second stage of cooling accumulated degree-days (daily air
temperature minus 32 OF) can be correlated with the time taken for a solid ice cover to form. Using this correlation the time taken for 4 to G in. of ice to form can be calculated from air temperature records.
4. Observations taken on the small fresh-water lake show that the rate a t which ice melts during the spring break-up period can be estimated from the heat exchange formula
326 CANADIAN GEOTECHNICAL JOURNAL
where Qm = the heat available for melting lake ice,
XRsw = the heat available from solar radiation accuinulated over the break-up period,
XAT = accuinulated degree days over the break-up period.
The formula can be used to estimate the time taken for ice to melt froin a lalre, provided wind or currents do not accelerate the ice break-up process.
5. The usefulness of the relationships developed will depend not only on the accuracy of radiation and air temperature forecasts, but also on the length of period in the future for which these forecasts can be made. The real challenge of predicting freeze-up and break-up dates is thus a part of the more general challenge of improving the accuracy of short-term and long-term (30-day) weather forecasts.
The writer is indebted to several members of the Division of Building Research for assistance in obtaining water temperature measurements and analysing weather records. He is particularly indebted to Mr. D. Boyd and Mr. L. Gold for most helpful discussions during the preparation of this paper.
This paper is a contribution from the Division of Building Research, National Research Council, Canada, and is published with the approval of the Director of the Division.
BILELLO, M. A., 1961. Formation, growth and decay of sea-ice in the Canadian arctic archipelago. Arctic 14, 1: 2-25.
BILELLO, M. A., 1964. Method for predicting river and lake ice formation. J. Applied Meteorology 3, 38: 38-44.
BURDIDGE, F. F., and J. R. LAUDER, 1957. A preliminary investigation into break-up and freeze-up conditions in Canada. Ottawa, Dept. of Transport, Meteorological Branch, circular 2939.
COTE, J., 1950. Etude sur la dbbdcle. Province of Quebec, Meteorological Bureau, Bull. 17. MACKAY, D. I<., 1962a. River ice conditions i ? ~ the Nelson riuer drainage system. Ottawa, Dept.
Mines and Technical Surveys, Geographical Branch Paper 34.
MACKAY, D. K.. 1962b. Trends and factors affecti7zg break-up and freeze-up dates in tlze Nelson river drainage systenr. Ottawa, Dept. Mines and Technical Surveys, Geographical Branch Paper 35.
MACKAY, J. R., 1961. Freeze-up and break-up of the lower Mackenzie river, Northwest Territories. G. 0 Raasch, ed., Geology of the Arctic (Toronto: University of Toronto Press), 1119-34.
Meteorological Branch, Dept. of Transport, 1959. Break-up and freeze-up dates of riners and
lakes in Canada. Circ. 3156.
RAGOTZKIE, R. A., 1960. Conzpilation of freezilzg and thawing dates for lakes i n north central
U n i b d States and Canada. Dept. of Meteorology, University of Wisconsin, 'Tech. Rept. 3.
RICHARDS, T . L., 1963. Meteorological factors affecting ice cover on the Great Lakes. University of Michigan, Great Lalies Research Division Publication 10, p. 204-15. RODHE, B., 1952. On the relation between air temperature and ice forluation in the Baltic.
GeografLska Annaler 34, 3-4: 175-202.
S ~ T I T H , M. W., 1951. Limnology and trout angling in Charlotte County lakes. Jozlrnal of
Fisheries, New Brunswicli Research Board.
STANI(IEWICZ, M. J., 1947. Break-up can be foretold. Pzllp and Paper Magazine 48, 118-20. WILLIAMS, G. P., 1963a. Heat transfer coefficient for natural water surfaces. Proc. Int. Assoc.
Sci. Hydrology, IUGG, Publication 62: 203-12.
WILLIAMS, G. P., 1963b. Probability charts for predicting ice thickness. Eng. J. 46, 6: 31-5. ',WILLIAMS, G. P., and L. W. GOLD, 1963. T h e use of dust t o advance the break-up of ice on
laltes and rivers. Canada, Proceedings of Easrern Snozu Ccnference: 31-56. Reprinted as NRC 7725.