HAL Id: hal-01279954
https://hal.archives-ouvertes.fr/hal-01279954
Submitted on 11 Oct 2019
HAL is a multi-disciplinary open access archive for the deposit and dissemination of sci-entific research documents, whether they are pub-lished or not. The documents may come from teaching and research institutions in France or abroad, or from public or private research centers.
L’archive ouverte pluridisciplinaire HAL, est destinée au dépôt et à la diffusion de documents scientifiques de niveau recherche, publiés ou non, émanant des établissements d’enseignement et de recherche français ou étrangers, des laboratoires publics ou privés.
Inclusion/Flaw Detection in Ultrasound Imaging
Through Optimization of Random Transmitted Wave
Sébastien Ménigot, Maroun Geryes, Jean Marc Girault
To cite this version:
Sébastien Ménigot, Maroun Geryes, Jean Marc Girault. Inclusion/Flaw Detection in Ultrasound Imaging Through Optimization of Random Transmitted Wave. Acoustics 2013, Nov 2013, New Delhi, India. �hal-01279954�
INCLUSION/FLAW DETECTION IN ULTRASOUND
IMAGING THROUGH OPTIMIZATION OF RANDOM
TRANSMITTED WAVE
Ménigot Sébastien
1,2, Geryes Maroun
3, Charara Jamal
3and Girault Jean-Marc
21
IUT Ville d'Avray, Université Paris Ouest Nanterre La Défense, Ville d'Avray, France
2
UMR Inserm U 930, Université François-Rabelais de Tours, PRES Centre-Val de Loire Université, Tours, France
3
Université Libanaise, Faculté de Sciences I, Département de Physique et d’Électronique, Hadath, Liban
e-mail: {sebastien.menigot, jean-marc.girault}@univ-tours.fr
Nowadays, ultrasound imaging is become an essential tool for diagnosis in medicine and in industry. Developments in ultrasound imaging have provided more sensitive imaging system to increase the contrast and the resolution. The main improvement has made possible by taking into account the wave harmonic generation during the propagation in tissues. By extracting harmonic components, a higher contrast can be obtained. Several has been developed through post-processing first. However, to improve the resolution while maintaining the advantage of the harmonic imaging, encoding imaging has been developed. One of the most used encoding techniques is the pulse inversion imaging. However, the imaging methods are usually non-optimal, since there is no optimization process included into the imaging system. In most cases, the solution adopted by manufacturers consists of providing empirically pre-set transmit frequencies, even if it is obvious that the medium to be explored should be taken into account during the optimization process. In a previous method, to overcome this problem without assumption on the optimal wave, we have modified a current imaging system by including feedback from output to input. To resolve the waveform optimization, we have proposed using the transmitted stochastic signal chosen by a genetic algorithm where the cost function was the contrast. However the contrast computation required some a priori knowledge about the position of the inclusion in tissue. In this study, to avoid this assumption on the medium, a medium with an inclusion was compared to a reference medium without defect. To distinguish the two media, we characterized energy for each medium. These energy features enabled to create an Euclidean distance between the two media. Our aim was to find automatically the stochastic command that maximized this Euclidean distance. The advantage of the method was that no a priori information was required in order to find the optimal stochastic command and the position of the inclusion. In simulation, by using the optimal stochastic command in pulse inversion imaging, the algorithm converged after 3000 iterations. The distance could be multiplied by 4 in comparison with the distance obtained with an usual excitation at the central frequency of the transducer.
1. Introduction
Medical ultrasound imaging has become an essential tool for clinical diagnosis over the past fifty years. Historically, its principle is simple. An ultrasound sinus wave of frequency f is transmitted 0
into the medium being explored. Acoustic impedance ruptures due to medium changes generate echoes which make possible the image reconstruction. However developments of harmonic imaging techniques have brought about a revolution [1]. Actually, the ultrasound wave nonlinearly
propagates through the tissue under exploration. Consequently, harmonic components (2 f ,0 3 f ,...) 0 are generated and they are measured in the echoes. By extracting each harmonic component, it is possible to obtain harmonic images with high contrast [2].
However, the axial resolution can be limited, because good separation of the harmonic components requires a limited pulse bandwidth [3]. Several imaging methods have been proposed to improve contrast while ensuring a good axial resolution, such as pulse inversion imaging [4], power modulation [5], contrast pulse sequencing [6] and pulse subtraction [7]. Since the most commonly used is the pulse inversion imaging, we only focused our study with this technique.
However, to optimally use the pulse inversion imaging, the transmitted pulse must be correctly adjusted. Nevertheless conventional ultrasound scanners can only provide some transmit frequencies for manual selection to construct a transmitted signal at this fixed frequency. In previous studies, we were able to optimize the contrast of the image by seeking the transmitted signal. The first solution carries on transforming the shape optimization in a suboptimal parametric optimization [8]. The automatic tuning of transmit frequency made possible the maximization of the contrast. To overcome the suboptimal solution, the second method has been enabled to extend this principle without assumption on the waveform. This approach is based on the transmission of stochastic waves [9]. Although no assumption on the waveform is required, the definition of the contrast requires to know the position of the region of interest.
The aim of the study was to find automatically the optimal command which can distinguish two different tissues in a medium; for example an inclusion. We proposed to compare this medium with a reference medium without flaw in order to construct a distance between them. If the distance is maximal, the flaw must be more visible, since it is the only difference between the two media. We therefore replaced the current pulse inversion system with a closed loop system whose transmitted pulse was modified by feedback, such as:
( )
arg max( ( ( )) w n
w d w n , (1)
where w n( ) is the transmitted signal and n the discrete time. We propose to solve the shape
optimization by using a genetic algorithm and we applied it in simulation. The advantage of the method was the optimization without a priori knowledge on the optimal waveform and on the medium.
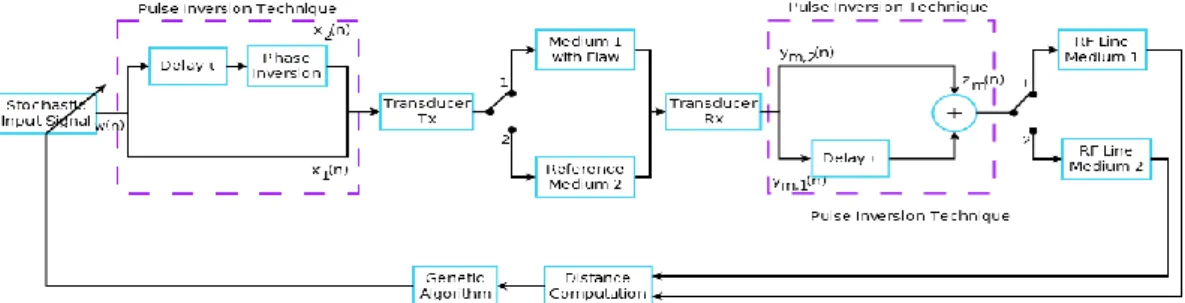
2. Closed Loop System
The principle of pulse inversion imaging including feedback is described in Fig. 1. For an individual solution at the iteration k, two pulses xk,1( )n and xk,2( )n with opposite phase were
transmitted into the medium with a flaw or an inclusion (switch on position 1) and into the reference medium without flaw (switch on position 2). For each mediumm , the sum zm k, ( )n of
their two respective echoes ym,1,k( )n and ym,2,k( )n enabled to extract the even harmonic
components [4] and it formed a radiofrequency linelk m, . From these two radiofrequency line l andk,1
,2
k
l , the distance d was computed and it meant the difference between the two different tissues. k
Finally, a new transmitted binary signal xk1,1( )n was computed by the algorithm to optimize the
Figure 1. Block diagram of pulse inversion imaging in closed loop.
2.1 Transmitted Stochastic Signal
The stochastic pulse signal xk q, ( )n in pulse inversion imaging was digitally computed with Matlab
(Mathworks, Natick, MA, USA):
, ( ) 1; ( ) ( ) 2. k k q k A w n q x n A w n q (2)
The number of samples N was set so that the duration s T of the stochastic signal w n k( ) corresponded to 100% of the fractional bandwidth of the transducer. Their value should be thus selected for optimization. Finally, the amplitude of the driving pressure A was then adjusted so that the power of the pulse xk q, ( )n was constant to
ref
x
P . Note that this power P was calculated for a xref
signal xref which was the impulse response of the transducer with a driving pressureA . 0
2.2 Cost Function
As we mentioned earlier, the cost-function to be maximized was a Euclidean distance between the two media: the medium with flaw and the reference medium. Since the acoustic propagation into the medium was nonlinear, the RF lines had harmonic components. To take into account this property, we proposed to split the transducer bandwidth within 4 sub-bands. Note that the number of sub-bands was slightly higher than the maximum number of harmonic components which could be observed. A power was thus computed for each sub-band and each environment. Finally, the Euclidean distance was defined from these powers as:
4 2 ,1, ,2, 1 ( ) k i k i k i d E E
, (3)where E is the power backscattered for the medium with the flaw in the i,1 i-th sub-band and E is i,2
the power backscattered for the reference medium in the i-th sub-band.
2.3 Algorithm
As previously explained, the search for the optimal command w nk( ) was based on the selection of the optimal stochastic signal which maximized the cost function. This step was hard optimization problem. By using a genetic algorithm [10], it was possible to add an optimization process based on the genetic reproduction. The algorithm thus had the role of search N samples to maximize s
distanced .
At the iterationk, 12 stochastic signals [10] were transmitted to the two media. Each sample was randomly chosen from a continuous uniform distribution between -1 and 1. For the generationk1, only the 6 best individual solutions which maximized the contrast were selected to become parents. It remained to construct 6 new solutions named offspring. To construct it, the crossover operator mixed the best parent with one of the 5 remaining parents. Finally, 40% samples were mutated to
obtain robust optimization. Thus the optimal stochastic command was the best individual solution of generationk.
3. Simulation Model
The simulation model was constructed on the basis of the pulse inversion imaging system to contrast realistic ultrasound image which have already proven in medical ultrasound imaging [8]. It was composed of different phases: transmission, 2D nonlinear propagation and reception.
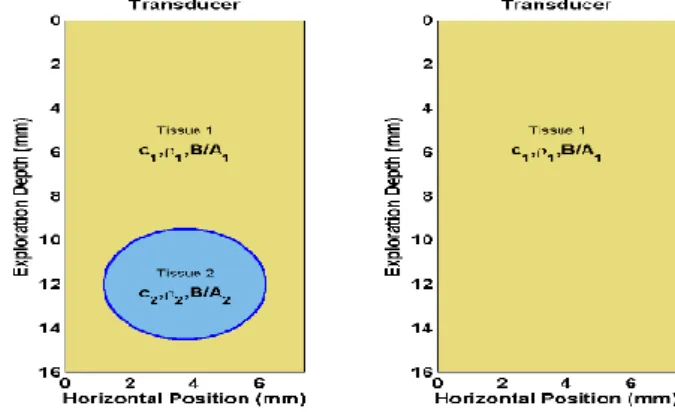
Figure 2. Grid of properties of the medium with the inclusion (left) and of the reference medium without inclusion: c is the wave velocity, the density and B/A the nonlinearity parameter. The ultrasound
transducer was at a depth of 0 mm, here at the top.
At the transmitter, a stochastic signal xk,1( )n was generated digitally and filtered by the transfer
function of a realistic transducer, centred at fc 4MHz with a fractional bandwidth of 75% at -3 dB. The pulse wave generated was propagated nonlinearly into each attenuating medium [11]. In the first medium, a 5 mm-diameter inclusion of a second tissue (Table 1) was inserted into the first tissue (Table 1) at 12 mm below the surface, whereas in the second medium, no inclusion was added (Fig. 3).
Table 1. Mechanical Properties of each tissue explored [12]. N is the symbol of the Gaussian distribution.
Tissue 1 Tissue 2
wave velocity c N(1584 m/s, 0.008 m2/s2) N (1060 m/s,75 m2/s2) Density N (1060 kg/m 3 ,0.008 kg2/m6) N (928 kg/m 3 ,75 kg2/m6) Nonlinearity parameter B/A 6 10.3
Finally, the signals backscattered by tissue were recorded for each medium. These tissue echoes were filtered by the transfer function of the transducer to construct the first echoes. The simulation process was repeated with the second transmitted stochastic pulse xk,2( )n to construct the second
echoes. Thus the envelope lk m, was constructed from the radiofrequency linezk m, ( )n . From these
radiofrequency, it was possible to compute the distanced . k
4. Results
The optimization process was applied in the simulation model to demonstrate the feasibility of our novel method. The driving pressure A was set to 400 kPa. The duration 0 T of the binary signal represented 100\% of the fractional bandwidth of the transducer. The sample number N was thus s
40 according to the sampling rate required to the simulation model.
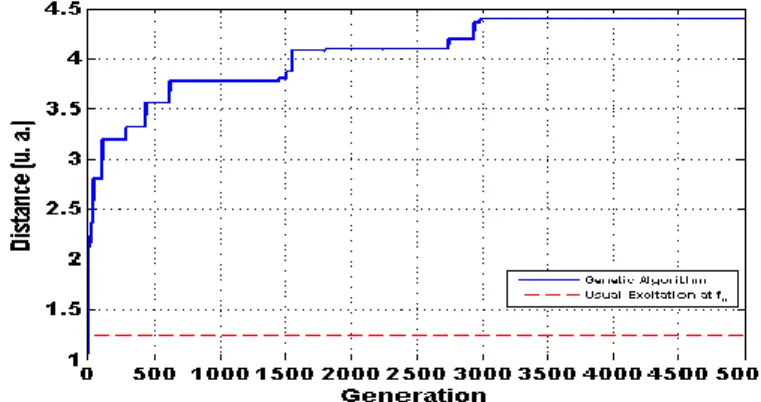
Fig. 3 shows the best Euclidean distance d as a function of generationk k . As an illustration, this result was compared with the usual transmitted signal used in tissue harmonic imaging, i.e. with a transmit frequency at the central frequency f of the transducer. After 3000 generations, the c
Euclidean distance d reached an optimal value four times superior than with usual excitation at the k
central frequency of the transducer.
Figure 3. Simulation of automatic optimization of the distance dkby a transmitted stochastic signal. The optimization was compared with the case where the transmitted signal is at the central frequency fc of the
transducer, i.e. the usual transmitted signal used in tissue harmonic imaging.
Fig. 4a shows the optimal stochastic command w nk( ). As an illustration, Fig. 4b shows the signal
( )
p n at the transducer output (Fig. 1) when w n( ) was the optimal stochastic signal. This signal was transmitted in tissue. Fig. 4c shows the respective radiofrequency lines for the medium with the flaw and the spectra of input/output imaging system in Fig. 4d. Note that in contrast with the usual transmitted signal, the optimal transmitted signal had nonlinear components.
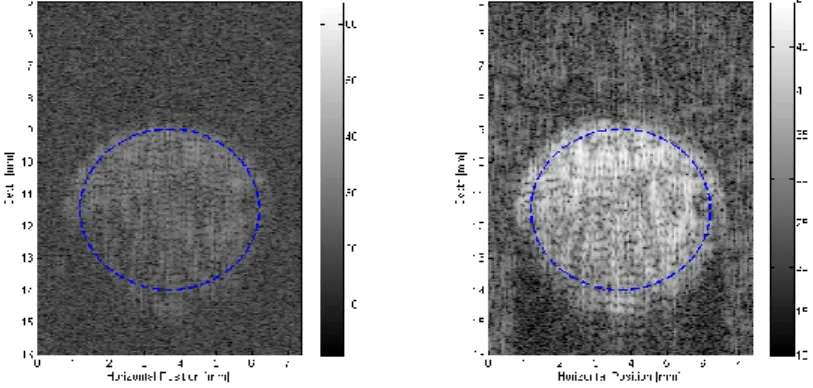
In order to illustrate the improvement on the ultrasound image, Fig. 5 shows the synthetic image using the usual transmitted signal at the central frequency of the transducer f and the optimal c
stochastic signal. Note that the optimization was performed for the central radiofrequency line of the region of interest and the same transmitted signal was applied for all the radiofrequency lines of the image. The images show a high increase in the contrast between the two tissues by using the optimal stochastic command.
5. Discussion and Conclusions
Stochastic sequences were automatically transmitted through a pulse inversion imaging system in order to optimize an Euclidean distance frame per frame. The closed loop system automatically provided an optimal stochastic command where the Euclidean distance was higher than with a fixed-frequency transmitted signal.
This optimization was performed without taking into account a priori knowledge of the medium and the transducer. This performance lied in the definition of the function of cost. By comparing it with a reference medium, the optimization was highlighted flaws over the surrounding tissue. However to be brought out flaws, the method required a reference medium whose features were close to the surrounding tissue. To overcome this drawback, a preliminary step could consist in finding an area without flaw it could to determine an fault-free area before the optimization.
In conclusion, this method improved the quality of images without assumptions on the waveform or on the position of the inclusion / flaw. We think it would be suitable for non destructive testing.
Figure 4. (a) Optimal transmitted stochastic signal xk,1( )n obtained by the genetic algorithm. (b) Signal
( )
p n at the transducer output (Fig. 1) when w n( ) was the optimal stochastic signal. (c) Corresponding radiofrequency line measured with the medium with the flaw. (d) The respective spectra.
Figure 5. Synthetic Images using (a) the usual transmitted signal at the central frequency of the transducer
c
f , (b) the optimal stochastic signal. The images showed the medium depicted in Fig. 2.
REFERENCES
[1] F. Tranquart, N. Grenier, V. Eder, and L. Pourcelot, 1999. Clinical Use of Ultrasound Tissue Harmonic Imaging, Ultrasound Med Biol, 25(6), 889–894.
[2] P.N. Burns, 2002. Instrumentation for Contrast Echocardiography, Echocardiogr-J Card, 19(3), 241–258. [3] M.A. Averkiou. Tissue Harmonic Imaging, Proceeding IEEE Ultrasonic Symposium, 2000, San Juan, Puerto
Rico, 1563–1572.
[4] D.H. Simpson, C.T. Chin, and P.N. Burns, 1999. Pulse Inversion Doppler: A New Method for Detecting Nonlinear Echoes from Microbubble Contrast Agents, IEEE T. Ultrason. Ferr, 46(2), 372–382.
[5] G.A. Brock-fisher, M.D. Poland, and P.G. Rafter, 1996. Means for Increasing Sensitivity in Non-linear Ultrasound Imaging Systems. US Patent 5,577,505.
[6] P. Phillips and E. Gardner, 2004. Contrast-Agent Detection and Quantification, Eur Radiol, 14, P4–P10. [7] J.M.G. Borsboom, A. Bouakaz, and N. de Jong, 2009. Pulse Subtraction Time Delay Imaging Method for
Ultrasound Contrast Agent Detection, IEEE T. Ultrason. Ferr., 56(6), 1151–1158.
[8] S. Ménigot, J.-M. Girault, I. Voicu, and A. Novell, 2012. Optimization of Contrast to Tissue Ratio by Frequency Adaptation in Pulse Inversion Imaging, IEEE T. Ultrason. Ferr., 59(11), 2431–2438.
[9] S. Ménigot, and J.-M. Girault, 2013. Optimization of Contrast-to-Tissue Ratio by Adaptation of Transmitted Ternary Signal in Ultrasound Pulse Inversion Imaging, Comput Math Meth Med, 2013, 6.
[10] R.L. Haupt and S.E. Haupt, 2004. Practical Genetic Algorithms, John Wiley & Sons Inc, Hoboken, NJ, USA. [11] M.E. Anderson, 2000. A 2D Nonlinear Wave Propagation Solver Written in Open-Source MATLAB Code,
Proceeding IEEE Ultrasonic Symposium, San Juan, Puerto Rico, 1351–1354.
[12] T. Szabo, 2004. Diagnostic Ultrasound Imaging: Inside Out, Academic Press, London, UK.