HAL Id: hal-02904291
https://hal.archives-ouvertes.fr/hal-02904291
Submitted on 21 Jul 2020
HAL is a multi-disciplinary open access
archive for the deposit and dissemination of
sci-entific research documents, whether they are
pub-lished or not. The documents may come from
teaching and research institutions in France or
abroad, or from public or private research centers.
L’archive ouverte pluridisciplinaire HAL, est
destinée au dépôt et à la diffusion de documents
scientifiques de niveau recherche, publiés ou non,
émanant des établissements d’enseignement et de
recherche français ou étrangers, des laboratoires
publics ou privés.
Distributed under a Creative Commons Attribution| 4.0 International License
Gas, dust, and star formation in the positive AGN
feedback candidate 4C 41.17 at z = 3.8⋆ ⋆⋆
N. P. H. Nesvadba, G. V. Bicknell, D. Mukherjee, A. Y. Wagner
To cite this version:
N. P. H. Nesvadba, G. V. Bicknell, D. Mukherjee, A. Y. Wagner. Gas, dust, and star formation in
the positive AGN feedback candidate 4C 41.17 at z = 3.8⋆ ⋆⋆. Astronomy and Astrophysics - A&A,
EDP Sciences, 2020, 639, pp.L13. �10.1051/0004-6361/202038269�. �hal-02904291�
A&A 639, L13 (2020) https://doi.org/10.1051/0004-6361/202038269 c N. P. H. Nesvadba et al. 2020
Astronomy
&
Astrophysics
L
ETTER TO THEE
DITORGas, dust, and star formation in the positive AGN feedback
candidate 4C 41.17 at z = 3.8
?
,
??
N. P. H. Nesvadba
1, G. V. Bicknell
2, D. Mukherjee
3, and A. Y. Wagner
41 Université de la Côte d’Azur, Observatoire de la Côte d’Azur, CNRS, Laboratoire Lagrange, Bd de l’Observatoire, CS 34229,
06304 Nice Cedex 4, France e-mail: [email protected]
2 Research School of Astronomy and Astrophysics, The Australian National University, Canberra, ACT 2611, Australia 3 Inter-University Centre for Astronomy and Astrophysics, Post Bag 4, Pune 411007, India
4 University of Tsukuba, Center for Computational Sciences, Tennodai 1-1-1, 305-0006 Tsukuba, Ibaraki, Japan
Received 26 April 2020/ Accepted 28 May 2020
ABSTRACT
We present new, spatially resolved [CI]1–0, [CI]2–1, CO(7–6), and dust continuum observations of 4C 41.17 at z = 3.8. This is one of the best-studied radio galaxies in this epoch and is arguably the best candidate of jet-triggered star formation at high redshift currently known in the literature. 4C 41.17 shows a narrow ridge of dust continuum extending over 15 kpc near the radio jet axis. Line emission is found within the galaxy in the region with signatures of positive feedback. Using the [CI]1–0 line as a molecular gas tracer, and multifrequency observations of the far-infrared dust heated by star formation, we find a total gas mass of 7.6 × 10¹⁰M
,
which is somewhat greater than that previously found from CO(4–3). The gas mass surface density of 103M
yr−1pc−2and the star
formation rate surface density of 10 M yr−1kpc−2were derived over the 12 kpc × 8 kpc area, where signatures of positive feedback
have previously been found. These densities are comparable to those in other populations of massive, dusty star-forming galaxies in this redshift range, suggesting that the jet does not currently enhance the efficiency with which stars form from the gas. This is consistent with expectations from simulations, whereby radio jets may facilitate the onset of star formation in galaxies without boosting its efficiency over longer timescales, in particular after the jet has broken out of the interstellar medium, as is the case in 4C 41.17.
Key words. galaxies: active – galaxies: high-redshift – galaxies: individual: 4C 41.17 – galaxies: jets – galaxies: star formation
1. Introduction
It is now widely recognized that powerful radio jets ejected by powerful active galactic nuclei (AGN) can have a major impact on the evolution of their host galaxies by regulating their gas content and interstellar medium conditions, thereby potentially facilitating the formation of new stars. Outflows of molecular, atomic, and warm ionized gas found in numerous galaxies are our prime observational evidence of feedback today.
Other potential mechanisms, by which the injection of AGN energy may regulate star formation in the host galaxies, are much less explored. This includes the enhancement of gas turbulence and pressure within the interstellar gas and star-forming clouds. A pressure increase on embedded gas clouds may temporarily facilitate star formation (“positive feedback”; e.g.,Fragile et al. 2004, 2017; Wagner et al. 2012; Silk 2013). The existence of such positive feedback has been expected theoretically for sev-eral decades, but observational evidence is hard to collect, and is only found for very few individual targets in the nearby and distant universe (Croft et al. 2006; Salomé et al. 2015, 2017). Maiolino et al. (2017) suggest that velocity offsets found in a
? IRAM data are only available at the CDS via anonymous ftp
tocdsarc.u-strasbg.fr(130.79.128.5) or viahttp://cdsarc. u-strasbg.fr/viz-bin/cat/J/A+A/639/L13
??
Based on data obtained with the IRAM NOEMA interferometer through program S19DA.
nearby ultraluminous infrared galaxy (ULIRG) may also point to positive feedback associated with radio-quiet quasar activity.
An interesting question is whether positive feedback can
boost the efficiency with which stars form from molecular gas
beyond the levels found in intensely star-forming galaxies, as
postulated by some models of galaxy evolution (Gaibler et al.
2012;Silk 2013;Mukherjee et al. 2018). Shocks driven into the gas by the radio jet may compress the denser regions of these clouds and lead to star formation from gas that was previously marginally Jeans-stable (e.g., Wagner et al. 2012; Fragile et al. 2017). The rare candidates at low redshift with signatures of pos-itive feedback often seem to fall below the relationship between molecular gas mass and star formation rate density, suggesting
these galaxies form stars at lower efficiency than those
with-out AGN (Salomé et al. 2017). However, our clearest examples
of positive feedback in the nearby Universe are either dwarf galaxies (e.g., Minkowski’s Object, 3C 285,Salomé et al. 2015) or the outskirts of massive early-type galaxies (e.g., Cen A, Salomé et al. 2017). These examples have low gas-mass surface densities compared to actively star-forming galaxies, and there-fore they do not allow us to infer whether or not AGN may boost star formation in environments dominated by dense molec-ular gas.Mukherjee et al.(2018) found from relativistic hydro-dynamic simulations that the efficiency of star formation in such galaxies likely depends strongly on the detailed properties of the gas clouds, jet power, and interaction geometry, making it very
Open Access article,published by EDP Sciences, under the terms of the Creative Commons Attribution License (https://creativecommons.org/licenses/by/4.0),
A&A 639, L13 (2020)
Fig. 1. Integrated spectra of [CI]1–0 (left), and the [CI]2–1 and CO(7–6) lines (right). The red and orange lines show the total fit to the line profile and the fits to the individual components, respectively.
difficult to predict theoretically whether the net effect of the radio jet on star formation is positive or negative.
To test whether positive feedback may enhance the star for-mation efficiency in massive galaxies in the early Universe, we
observed the powerful radio galaxy 4C 41.17 at z = 3.792
(Chambers et al. 1990) with the NOEMA interferometer of the Institut de Radioastronomie Millimetrique (IRAM), probing the [CI] lines of atomic carbon and the dust continuum at ∼500 GHz rest-frame frequency. We observed [CI] rather than CO because this line is the more reliable tracer of molecular gas mass at high redshift, it is optically thin, and is less affected by gas
excitation effects than the more commonly observed mid-J CO
lines (e.g., Papadopoulos & Greve 2004; Valentino et al. 2018; Nesvadba et al. 2019). 4C 41.17 is arguably our best example of positive AGN feedback in the early Universe, as shown by the alignment of extended, unpolarized Lyα emission with the radio jet axis (Dey et al. 1997), strongly kinematically perturbed gas (Steinbring 2014), and asymmetric absorption-emission spec-tra typical of very young stellar populations (P Cygni profiles; Dey et al. 1997).Bicknell et al.(2000) present a detailed analyti-cal study of the potential gas compression by the radio jet, finding that at least parts of the extended Lyα emission associated with the radio jet axis and bright extended UV continuum may origi-nate from star formation in gas compressed through the passage of the radio jet. A young starburst age of 30 Myr is also supported by
multicomponent SED fitting (Rocca-Volmerange et al. 2013) and
is consistent with the age estimate of the radio jet (Bicknell et al. 2000).
In the following we describe our observations of the gas, dust, and star formation in 4C 41.17, and discuss our results in the light of star formation in massive galaxies at high
red-shift with and without radio jets. We use the flat ΛCDM
cosmology from Planck Collaboration VI (2020) with H0 =
67.4 km s−1Mpc−1,Ω
M = 0.315, and ΩΛ= 1−ΩM. At z= 3.792
the luminosity distance is DL = 34.41 Gpc, and 7.26 kpc are
pro-jected onto one arcsecond.
2. NOEMA interferometry of 4C 41.17
4C 41.17 was observed between June and December 2019 with the NOEMA interferometer in the 2 mm and 3 mm bands with either 9 or 10 antennae in the C configuration under average to good atmospheric conditions. The central frequencies were 102.705 and 168.895 GHz, respectively, corresponding to the
observed frequencies of [CI]1–0 and [CI]2–1 at z = 3.79198,
respectively. The source was observed for a total of 7.0 h and 5.6 h in the 2 mm and 3 mm bands, respectively. The data were calibrated with the Continuum and Line Interferometer
Calibra-tion package CLIC1and with MWC349 and LKHA101 as flux
1 http://www.iram.fr/IRAMFR/GILDAS
Table 1. Observational results.
Line Velocity FWHM Iline Scont
[km s−1] [km s−1] [Jy km s−1] [mJy]
[CI]1–0 228 ± 21 372 ± 21 0.26 ± 0.03 0.11 ± 0.015
[CI]2–1 237 ± 52 686 ± 56 0.84 ± 0.07 0.49 ± 0.035
CO(7–6) 95 ± 55 526 ± 56 0.53 ± 0.06 0.49 ± 0.035
Notes. Velocities are given relative to z= 3.792.
calibrators. Combining both polarizations leads to a continuum
root mean square (rms) of 7.3 µJy bm−1 and 23.9 µJy bm−1 in
the 3 mm and 2 mm bands, respectively, measured over 3.8 GHz bandwidth. We rebinned the data to a spectral resolution of
20 MHz in both bands (corresponding to 58 km s−1 in band 3,
and 36 km s−1in band 2, respectively), and obtained a line rms
of 0.1 and 0.3 mJy bm−1and per spectral channel, respectively. With natural weighting, we obtain a beam size of 2.300× 1.700,
and 1.400× 1.000at 3 mm and 2 mm, respectively. Figure1shows the resulting integrated spectra.
Figure2shows the [CI] and dust morphology. All line
emis-sion is concentrated within an area of full width at half
maxi-mum (FWHM) 2.800× 1.700 around the radio core for [CI]1–0,
and 1.800× 1.100for the [CI]2–1 and CO(7–6) lines, respectively. The major axis of the line emission exceeds the major axis size of the beam significantly in both bands, clearly showing that the emission is resolved along this axis, but not extended enough to neglect beam smearing. Gaussian deconvolution suggests major axis lengths of 1.600 and 1.300 for the [CI]1–0 and the [CI]2–1
and CO(7–6) lines, respectively.
The continuum, best seen in the 2 mm band, is strongly elon-gated and more extended along the major axis than the line emission observed in the same band, has an observed size of 2.400× 1.100, and a deconvolved size of 2.000. For simplicity, and
because our main goal is to rule out that the star formation rate surface density exceeds those measured in other galaxies, we adopt a common size of 1.600× 1.100for the area emitting [CI]1–0
and the dust continuum.
The continuum major axis is roughly aligned with the radio jet axis. Integrated continuum flux densities, which are mea-sured after subtracting the line emission from the data cubes, are 488 ± 24 and 112 ± 7 µJy in the 2 mm and 3 mm band, respec-tively. Integrated line and continuum fluxes are listed in Table1.
As already noted by De Breuck et al. (2005), the nonthermal
synchrotron emission from the radio source does not signifi-cantly change these measurements.
To extract line fluxes, we fit the [CI]1–0 line with a single Gaussian centered on a velocity of (228 ± 21) km s−1relative to
z= 3.97197, a FWHM line width of (372±21) km s−1and a flux
of ICI10= (0.26 ± 0.03) Jy km s−1. L13, page 2 of4
Fig. 2. Dust (left) and [CI]1–0 morphol-ogy (right) of 4C41.17. Contours show the 1.4 GHz radio morphology. The radio core is between the two central components (Bicknell et al. 2000). The beam size is shown in the lower left corner of each panel.
A two-component fit to the [CI]2–1 and CO(7–6) lines
yields integrated line fluxes of 0.84 ± 0.07 Jy km s−1 for
[CI]2–1, and 0.53 ± 0.06 Jy km s−1 for CO(7–6), respectively.
Both lines are significantly broader than the [CI]1–0 line:
CO(7–6) has FWHM= 527 ± 56 km s−1, whereas [CI]2–1 has
FWHM= 686 ± 56 km s−1. It is possible that [CI]2–1 and
CO(7–6) luminosities are enhanced near the AGN relative to [CI]1–0, since both probe relatively high-excitation gas. The
ratio R21/10 = 3.2 of [CI]1–0 and [CI]2–1 flux falls near the
divide between gas heated by AGN and star formation, but into the star formation regime (Meijerink et al. 2007). It is there-fore possible that parts of the [CI]2–1 emission are from gas heated by the AGN. It is also interesting to note that we do not see the same double-peaked line profile in CO(7–6) that De Breuck et al. (2005) previously found for CO(4–3), which may also indicate differences in gas excitation.
3. Gas and star formation properties
We used Eq. (4) of Alaghband-Zadeh et al.(2013), MH2,[CI] =
1380 × D2L (1+z)A −1 10,−7X −1 CI,−5Q −1
10ICI[M ], where DLis the
luminos-ity distance in units of Gpc, z the redshift, ICI the integrated
line flux of [CI]1–0 in Jy km s−1. The Einstein A coefficient,
A10 = 7.93 × 10⁻⁸ is given in units of 10−7s−1, and the
car-bon abundance, XCI = 3 × 10⁻⁵(Alaghband-Zadeh et al. 2013),
in units of 10−5. We find a molecular gas mass of MH2 =
(7.6 ± 1.0) × 1010M
, which is somewhat greater than the
5.4 × 10¹⁰M previously found byDe Breuck et al.(2005) from
CO(4–3) with a 700 × 500beam; this is a sufficient to cover most
of the surrounding Lyα halo. This suggests that we have not resolved more extended line emission associated with 4C 41.17. We estimated the star formation rates from the dust contin-uum in the NOEMA data at 2 mm and 3 mm and used previous
Herschel/SPIRE and ground-based single-dish measurements
taken from the compilation ofDrouart et al.(2014) to determine
the dust temperature, TD and the β parameter. We only used
observations taken at ≥350 µm, where the AGN contamination is <5% in the spectral energy distribution (SED) of dust shown by Drouart et al. (2014). This suggests TD = (53 ± 3) K and
β = 1.9, respectively, for a modified blackbody fit calculated
in the same way as inCanameras et al.(2015). This SED
over-predicts the observed flux densities by factors 2.5 and 2 in
the 2 mm and 3 mm bands, respectively (Table 1). This may
either be due to missing flux in the interferometry data or addi-tional, fainter dust emission within the much larger beam size
(10−2000) of the single-dish observations. A potential
candi-date for additional far-infrared (FIR) emission would be diffuse emission from the large, 500× 700, Lyα halo previously found
byvan Breugel et al.(1999). In the following we use the fluxes obtained with NOEMA, which are best matched to the [CI]
emission-line region rather than those derived from the single-dish measurements.
We adopted a modified version of the relationship of Kennicutt(1998a) to estimate a star formation rate from the FIR luminosity. Using the Chabrier stellar initial mass function this implies SFR [M yr−1] = 2.5 × 10−44LFIR[erg s−1]. We find a
total star formation rate of SFR = 650 M yr−1. This is a
fac-tor ∼2 greater than the SFR = 290 M yr−1 of star formation
that van Breugel et al. (1999) found for the UV continuum in
the same region, which is likely affected by dust extinction.
Averaged over a region of 1.600× 1.100 (11.6 kpc × 8 kpc at z =
3.79), this corresponds to star formation and gas mass surface densities ofΣSFR = 8.9 M yr−1kpc−2 and 1040 M yr−1pc−2,
respectively. Since we measured and resolved [CI] and the dust continuum with similar beam sizes, these results are robust, even if some of the discrepancy between the continuum measure-ments with NOEMA and single-dish telescopes should be due to missing flux instead of additional astrophysical sources.
4. Discussion and summary
Gas mass and star formation rate surface density in galaxies are closely related; they have a near-linear relationship that holds over more than six orders of magnitude in star forma-tion and for molecular gas mass surface densities >10 M pc−2
(e.g.,Kennicutt 1998b;Bigiel et al. 2008). Actively star-forming galaxies at high redshift tend to fall above that relationship, as first noted byDaddi et al.(2010) andGenzel et al.(2010), indi-cating shorter gas consumption times and potentially higher star formation efficiency.
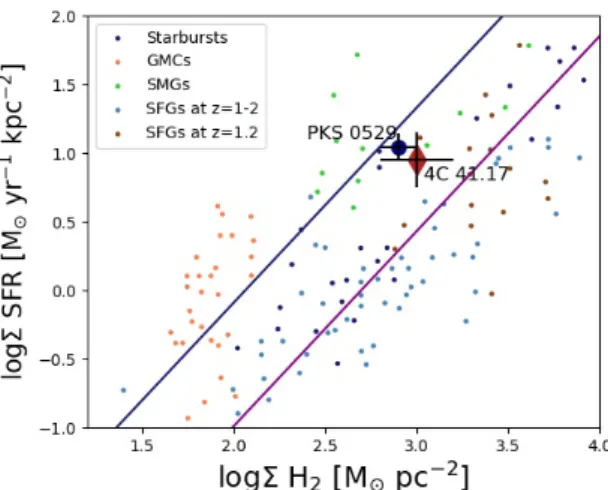
Figure 3 shows where 4C 41.17 falls in this
Schmidt-Kennicutt diagram between star formation and gas mass sur-face density, averaged over the 11.6 kpc × 8 kpc area previously
defined in Sect. 2, and the gas mass and star formation rate
from Sect. 3. We also add the second galaxy with potential
evidence of jet-triggered star formation in the early Universe,
PKS 0529−549 at z = 2.6, to this analysis. This galaxy was
previously discussed by Man et al. (2019), who point out that
star formation in this source seems to be more efficient than
in giant molecular clouds in the Milky Way. Both galaxies fall well above the typical relationship found for disk galaxies in this redshift range, which are on the main sequence of star forma-tion, as already noted by Man et al.(2019). However, the star formation rates do not fall above those found in other intensely star-forming galaxies at the same cosmic epoch (Bothwell et al.
2010), which likely include the progenitors of powerful
high-redshift radio galaxies.
This result suggests that the star formation efficiency does not exceed that found in other strongly star-forming galaxies without AGN, at least when averaged over the ∼10 kpc regions where jet-triggered star formation was found (Dey et al. 1997). We might
A&A 639, L13 (2020)
Fig. 3.Gas and star formation rate surface densities of 4C 41.17 (red diamond), PKS 0529−549 (blue dot), and several comparison samples: Giant molecular clouds in the Milky Way (Evans et al. 2014), local star-burst galaxies (Kennicutt 1998a), star-forming galaxies at z = 1−2 (Tacconi et al. 2008; Valentino et al. 2018, 2020), and submillimeter galaxies (Bothwell et al. 2010). The solid purple and blue lines indi-cate the sequences for typical main-sequence and starburst galaxies of Daddi et al.(2010).
suspect that positive and negative feedback would both be present and partially cancel the effect on each other (Dugan et al. 2017; Mukherjee et al. 2018).Steinbring(2014) found outflow signa-tures in warm ionized gas in 4C 41.17, suggesting that negative feedback is at work, although the low line width of [CI]1–0 does not suggest that a large percentage of the cold neutral gas is currently being removed. However, in situ gas removal through winds would also lower the observed gas-mass surface densities. This would move the galaxy to the left in Fig.3and artificially enhance, not lower, the observed star formation efficiency.
A more likely explanation is that the phase of positive feed-back is very short and only triggers the onset of star forma-tion without boosting it over longer timescales. This is not unexpected from a theoretical point of view: initial hydro-dynamic simulations suggested that jet-triggered star forma-tion may be long-lived (Gaibler et al. 2012), but did not take into account energy and momentum losses through disk poros-ity. More recent work suggests that the impact of the jet
on the star formation drops after a short initial “kick-off”
phase (Fragile et al. 2017; Mukherjee et al. 2018). This would also be consistent with the very high star formation rates of 7300 M yr−1required to form the 2.2 × 10¹¹M of young stars
found byRocca-Volmerange et al.(2013) within 30 Myr, that is,
an order of magnitude higher than today. Figure 2also shows
that the jet has already broken out of 4C 41.17, suggesting it may no longer be able to sustain a high overpressure within the gas. Jet-triggered star formation may also be limited by star for-mation itself once the starburst has evolved past the first few million years, as previously suggested byFragile et al.(2017). At 30 Myr age (Rocca-Volmerange et al. 2013), the starburst in 4C 41.17 is clearly evolved enough to have produced the first generations of supernovae. These may make star formation in 4C 41.17 self-regulating, as has previously been suggested for other massive, intensely star-forming galaxies at z = 2−3 (e.g., Lehnert et al. 2013).
To summarize, we used new [CI]1–0 and 2–1, CO, and
dust continuum interferometry obtained with IRAM/NOEMA
to study star formation in 4C 41.17 at z = 3.8, which is the
best example of positive feedback from radio jets at high red-shift in the literature. We estimated a molecular gas mass of
7.6 × 10¹⁰M in an elongated region where signatures of
jet-triggered star formation have previously been found. The spa-tially resolved gas and star formation rate densities suggest that stars are formed at efficiencies that are comparable to sub-millimeter galaxies at the same epoch. The same is true for PKS 0529−549, the second galaxy with likely signatures of a very young, potentially jet-triggered, stellar population.
While our results do not call into question the previous good evidence for jet-triggered star formation in 4C 41.17 obtained in the UV and radio, they do suggest that this phase is very short and not sustained after the jet has broken out from the interstel-lar gas of the host galaxy. After few 10 Myr, jet-triggered star formation proceeds with similar efficiency as in other intensely star-forming galaxies, making the signatures of positive feedback difficult to identify observationally. This result is also consistent with recent observational and theoretical findings in low-redshift galaxies, which indicate that jet-triggered star formation does not necessarily lead to a boost in star formation efficiency, even at high gas-mass surface densities of up to 1000 M pc−2.
Acknowledgements. We thank the referee for having gone through our Letter carefully, and for comments which helped clarify some aspects of our analysis. We also thank the IRAM staff, in particular Charlène Lefèvre, for taking these data, and their excellent support with the data reduction.
References
Alaghband-Zadeh, S., Chapman, S. C., Swinbank, A. M., et al. 2013,MNRAS, 435, 1493
Bicknell, G. V., Sutherland, R. S., van Breugel, W. J. M., et al. 2000,ApJ, 540, 678
Bigiel, F., Leroy, A., Walter, F., et al. 2008,AJ, 136, 2846
Bothwell, M. S., Chapman, S. C., Tacconi, L., et al. 2010,MNRAS, 405, 219
Canameras, R., Nesvadba, N., Guery, D., et al. 2015,MNRAS, 362, 41
Chambers, K. C., Miley, G. K., & van Breugel, W. J. M. 1990,ApJ, 363, 21
Croft, S., van Breugel, W., de Vries, W., et al. 2006,ApJ, 647, 1040
Daddi, E., Elbaz, D., Walter, F., et al. 2010,ApJ, 714, L118
De Breuck, C., Downes, D., Neri, R., et al. 2005,A&A, 430, L1
Dey, A., van Breugel, W., Vacca, W. D., & Antonucci, R. 1997,ApJ, 490, 698
Drouart, G., De Breuck, C., Vernet, J., et al. 2014,A&A, 566, A53
Dugan, Z., Gaibler, V., Bieri, R., Silk, J., & Rahman, M. 2017,ApJ, 839, 103
Evans, N. J., II, Heiderman, A., & Vutisalchavakul, N. 2014,ApJ, 782, 114
Fragile, P. C., Murray, S. D., Anninos, P., & van Breugel, W. 2004,ApJ, 604, 74
Fragile, P. C., Anninos, P., Croft, S., Lacy, M., & Witry, J. W. L. 2017,ApJ, 850, 171
Gaibler, V., Khochfar, S., Krause, M., & Silk, J. 2012,MNRAS, 425, 438
Genzel, R., Tacconi, L. J., Gracia-Carpio, J., et al. 2010,MNRAS, 407, 2091
Kennicutt, R. C., Jr. 1998a,ARA&A, 36, 189
Kennicutt, R. C., Jr. 1998b,ApJ, 498, 541
Lehnert, M. D., Le Tiran, L., Nesvadba, N. P. H., et al. 2013,A&A, 555, A72
Maiolino, R., Russell, H. R., Fabian, A. C., et al. 2017,Nature, 544, 202
Man, A. W. S., Lehnert, M. D., Vernet, J. D. R., De Breuck, C., & Falkendal, T. 2019,A&A, 624, A81
Meijerink, R., Spaans, M., & Israel, F. P. 2007,A&A, 461, 793
Mukherjee, D., Bicknell, G. V., Wagner, A. E. Y., Sutherland, R. S., & Silk, J. 2018,MNRAS, 479, 5544
Nesvadba, N. P. H., Cañameras, R., Kneissl, R., et al. 2019,A&A, 624, A23
Papadopoulos, P. P., & Greve, T. R. 2004,ApJ, 615, L29
Planck Collaboration VI. 2020, A&A, in presshttps://doi.org/10.1051/ 0004-6361/201833910
Rocca-Volmerange, B., Drouart, G., De Breuck, C., et al. 2013, ArXiv e-prints [arXiv:1301.1983]
Salomé, Q., Salomé, P., & Combes, F. 2015,A&A, 574, A34
Salomé, Q., Salomé, P., Miville-Deschênes, M. A., Combes, F., & Hamer, S. 2017,A&A, 608, A98
Silk, J. 2013,ApJ, 772, 112
Steinbring, E. 2014,AJ, 148, 10
Tacconi, L. J., Genzel, R., Smail, I., et al. 2008,ApJ, 680, 246
Valentino, F., Magdis, G. E., Daddi, E., et al. 2018,ApJ, 869, 27
Valentino, F., Magdis, G. E., Daddi, E., et al. 2020,ApJ, 890, 24
van Breugel, W., Stanford, A., Dey, A., et al. 1999, inThe Most Distant Radio Galaxies, eds. H. J. A. Röttgering, P. N. Best, & M. D. Lehnert, 49 Wagner, A. Y., Bicknell, G. V., & Umemura, M. 2012,ApJ, 757, 136
![Fig. 1. Integrated spectra of [CI]1–0 (left), and the [CI]2–1 and CO(7–6) lines (right).](https://thumb-eu.123doks.com/thumbv2/123doknet/14800984.606240/3.892.57.575.126.314/fig-integrated-spectra-ci-left-ci-lines-right.webp)
![Fig. 2. Dust (left) and [CI]1–0 morphol- morphol-ogy (right) of 4C41.17. Contours show the 1.4 GHz radio morphology](https://thumb-eu.123doks.com/thumbv2/123doknet/14800984.606240/4.892.59.603.126.317/fig-dust-morphol-morphol-right-contours-radio-morphology.webp)