Publisher’s version / Version de l'éditeur:
Vous avez des questions? Nous pouvons vous aider. Pour communiquer directement avec un auteur, consultez la première page de la revue dans laquelle son article a été publié afin de trouver ses coordonnées. Si vous n’arrivez pas à les repérer, communiquez avec nous à [email protected]. Questions? Contact the NRC Publications Archive team at
[email protected]. If you wish to email the authors directly, please see the first page of the publication for their contact information.
https://publications-cnrc.canada.ca/fra/droits
L’accès à ce site Web et l’utilisation de son contenu sont assujettis aux conditions présentées dans le site LISEZ CES CONDITIONS ATTENTIVEMENT AVANT D’UTILISER CE SITE WEB.
Proceedings of HCI 2005: People and Computers XIX [Proceedings], 2005
READ THESE TERMS AND CONDITIONS CAREFULLY BEFORE USING THIS WEBSITE. https://nrc-publications.canada.ca/eng/copyright
NRC Publications Archive Record / Notice des Archives des publications du CNRC :
https://nrc-publications.canada.ca/eng/view/object/?id=72ae11a2-8e62-4c22-ab5d-e6ecd9f7a46b
https://publications-cnrc.canada.ca/fra/voir/objet/?id=72ae11a2-8e62-4c22-ab5d-e6ecd9f7a46b
NRC Publications Archive
Archives des publications du CNRC
This publication could be one of several versions: author’s original, accepted manuscript or the publisher’s version. / La version de cette publication peut être l’une des suivantes : la version prépublication de l’auteur, la version acceptée du manuscrit ou la version de l’éditeur.
Access and use of this website and the material on it are subject to the Terms and Conditions set forth at
What Difference Do Guidelines Make? An Observational Study of
Online-Questionnaire Design Guidelines Put to Practical Use
Lumsden, Joanna; Flinn, Scott; Anderson, M.; Morgan, W.
Council Canada Institute for Information Technology de recherches Canada Institut de technologie de l'information
What Difference do Guidelines Make? An
Observational Study of
Online-Questionnaire Design Guidelines Put to
Practical Use *
Lumsden, J., Flinn, S., Anderson, M., and Morgan, W.
September 2005
* published in the Proceedings of HCI 2005 - People and Computers XIX, September 5-9, 2005. Edinburgh, Scotland, UK. pp. 69-83. NRC 48232.
Copyright 2005 by
National Research Council of Canada
Permission is granted to quote short excerpts and to reproduce figures and tables from this report, provided that the source of such material is fully acknowledged.
What Difference Do Guidelines Make? An
Observational Study of Online-Questionnaire
Design Guidelines Put to Practical Use
Jo Lumsden, Scott Flinn, Michelle Anderson, and
Wendy Morgan
National Research Council of Canada, IIT e-Business,
46 Dineen Drive, Fredericton, NB, Canada, E3B 9W4
Tel: +1 506 444 0544
Fax: +1 506 444 6114
Email: {jo.lumsden, scott.flinn}@nrc-cnrc.gc.ca
As a new medium for questionnaire delivery, the internet has the potential to revolutionise the survey process. Online-questionnaires can provide many capabilities not found in traditional paper-based questionnaires. Despite this, and the introduction of a plethora of tools to support online-questionnaire creation, current electronic survey design typically replicates the look-and-feel of paper-based questionnaires, thus failing to harness the full power of the electronic delivery medium. A recent environmental scan of online-questionnaire design tools found that little, if any, support is incorporated within these tools to guide questionnaire designers according to best-practice (Lumsden and Morgan, 2005). This paper briefly introduces a comprehensive set of guidelines for the design of online-questionnaires. Drawn from relevant disparate sources, all the guidelines incorporated within the set are proven in their own right; as an initial assessment of the value of the set of guidelines as a practical reference guide, we undertook an informal study
to observe the effect of introducing the guidelines into the design process for a complex online-questionnaire. The paper discusses the qualitative findings – which are encouraging for the role of the guidelines in the ‘bigger picture’ of online survey delivery across many domains such as e-Government, e-Business, and e-Health – of this case study.
1 Introduction
As a new medium for questionnaire delivery, the internet has the potential to revolutionise the survey process. Online (web-based) questionnaires provide several advantages over traditional survey methods in terms of cost, speed, appearance, flexibility, functionality, and usability (Bandilla et al., 2003; Dillman, 2000; Kwak and Radler, 2002). Online-questionnaires can provide many capabilities not found in traditional paper-based questionnaires: they can include pop-up instructions and error messages; they can incorporate links; and it is possible to encode difficult skip patterns making such patterns virtually invisible to respondents. Despite this, and the emergence of numerous tools to support online-questionnaire creation, current electronic survey design typically replicates the look-and-feel of paper-based questionnaires, thus failing to harness the full power of the electronic survey medium. A recent environmental scan of online-questionnaire design tools found that little, if any, support is incorporated within these tools to guide questionnaire design according to best-practice (Lumsden and Morgan, 2005). This paper briefly introduces a comprehensive set of guidelines for the design of online-questionnaires. It then focuses on an informal observational study that has been conducted as an initial assessment of the value of the set of guidelines as a practical reference guide during online-questionnaire design.
2 Background
Online-questionnaires are often criticised in terms of their vulnerability to the four standard survey error types: namely, coverage, non-response, sampling, and measurement errors. Although, like all survey errors, coverage error (“the result of not allowing all members of the survey population to have an equal or nonzero chance of being sampled for participation in a survey” (Dillman, 2000, p. 9)) also affects traditional survey methods, it is currently exacerbated in online-questionnaires as a result of the digital divide. That said, many developed countries have reported substantial increases in computer and internet access and/or are targeting this as part of their immediate infrastructure development (OECD, 2001; OECD, 2002). Indicating that familiarity with information technologies is increasing, these trends suggest that coverage error will rapidly diminish to an acceptable level (for the developed world at least) in the near future, and positively reinforce the advantages of online-questionnaires.
Non-response errors occur when individuals fail to respond to the invitation to participate in a survey or abandon a questionnaire before completing it. Given today’s societal trend towards self-administration (Dillman, 2000) the former is inevitable, irrespective of delivery mechanism. Conversely, non-response as a result of questionnaire abandonment can be relatively easily addressed (Dillman, 2000). For example, by incorporating a range of features into the design of an online-questionnaire, it is possible to support respondents’ estimation of the length of a questionnaire – and to provide respondents with context sensitive assistance
during the response process – and thereby reduce abandonment while eliciting feelings of accomplishment (Crawford et al., 2001).
For online-questionnaires, sampling error (“the result of attempting to survey only some, and not all, of the units of the survey population” (Dillman, 2000, p. 9)) can arise when all but a small portion of the anticipated respondent set is alienated (and so fails to respond) as a result of, for example, disregard for varying connection speeds, bandwidth limitations, browser configurations, monitors, hardware, and user requirements during the questionnaire design process. Similarly, measurement errors (“the result of poor question wording or questions being presented in such a way that inaccurate or uninterpretable answers are obtained” (Dillman, 2000, p.11)) will lead to respondents becoming confused and frustrated.
Sampling, measurement, and non-response errors are likely to occur when an online-questionnaire is poorly designed (note that coverage errors, on the other hand, are orthogonal to good-questionnaire design; mixed-mode delivery is suggested as a means to combat these errors). Individuals will answer questions incorrectly, abandon questionnaires, and may ultimately refuse to participate in future surveys; thus, the benefit of online-questionnaire delivery will be not fully realised. To prevent errors of this kind, and their consequences, it is extremely important that practical, comprehensive guidelines exist for the design of online-questionnaires. Many design guidelines exist for paper-based questionnaire design (e.g., American Statistical Association, 1999; Belson, 1981; Brewer, 2001; Fink, 1995; Jackson, 1988; Lindgaard, 1994; Oppenheim, 1992; Taylor-Powell, 1998); the same is not true for the design of online-questionnaires (Dillman, 2000; Norman et al., 2003; Schonlau et al., 2001). The guidelines introduced in this paper, and their subsequent study, help address this discrepancy.
3 Comprehensive Design Guidelines
In essence, an online-questionnaire combines questionnaire-based survey functionality with that of a webpage/site. As such, the design of an online-questionnaire should incorporate principles from both contributing fields. Hence, in order to derive a comprehensive set of guidelines for the design of online-questionnaires, we performed an environmental scan of existing guidelines for paper-based questionnaire design (e.g., American Statistical Association, 1999; Belson, 1981; CASRO, 1998; Fink, 1995; Jackson, 1988; Lindgaard, 1994; Oppenheim, 1992; Taylor-Powell, 1998) and website design, paying particular attention to issues of accessibility and usability (e.g., Badre, 2002; Brewer, 2001; Coyne and Nielsen, 2001; Coyne and Nielsen, 2002; Hinton, 1998; Kothari and Basak, 2002; Lynch and Horton, 1997; National Cancer Institute, 2002; National Institute on Aging and the National Library of Medicine, 2001; Stover et al., 2002; Stover and Nielsen, 2002; W3C, 1999). Additionally, we reviewed the scarce existing provision of online-questionnaire design guidelines (Dillman, 2000; Norman et al., 2003; Schonlau et al., 2001). Principal amongst the latter is the work of Dillman (2000): expanding on his successful Total Design Method for mail and telephone surveys (Dillman, 1978), Dillman introduced, as part of his
specifically aimed at directing the design of online-questionnaires. Albeit seminal, Dillman’s guidelines do not incorporate much of the relevant guidance uncovered as part of our environmental scan. We therefore propose – after collating, filtering, and integrating the disparate guidelines – a comprehensive set of guidelines for online-questionnaire design that are more encompassing than Dillman’s. Approximately 33% of the resulting set of guidelines stem directly from paper-based questionnaire design guidelines; the remainder (67%) are derived from webpage design guidelines as they apply to questionnaire design. This paper will only highlight the key elements of the guidelines; the full set of guidelines is available on request.
3.1 Overview of the Guidelines
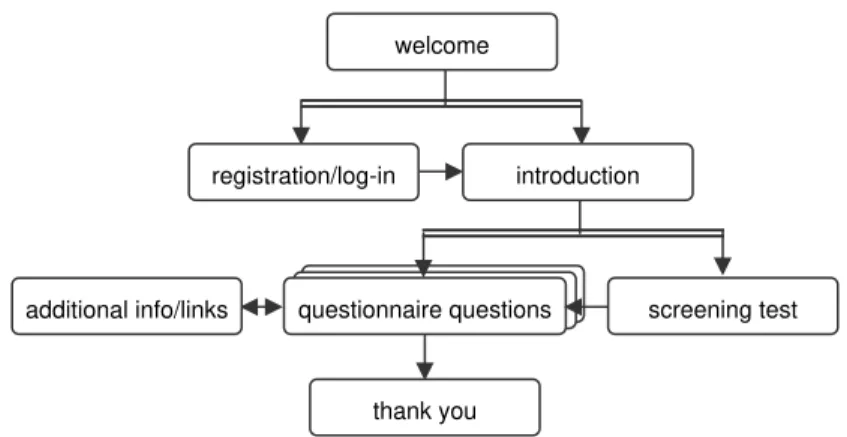
Figure 1: Organisational structure of online-questionnaires (arrows show progression, a
double-barred arrow indicating choice in the structure).
GENERAL
ORGANISATION FORMATTING
QUESTION TYPE & PHRASING GENERAL TECHNICAL ISSUES Welcome Page Registration/:Login Page Introduction Page Screening Test Page Questionnaire Questions Additional Info/Links Thank You Layout
Frames Forms & Fields
Navigation Buttons Links Site Maps Scrolling Text Colour Graphics Flash
Tables & Frames Feedback Miscellaneous Response Formats Matrix Questions Drop-Down Boxes Radio Buttons Check Boxes General Guidance Sensitive Questions Attitude Statements Phraseology Types of Question Open-Ended Closed-Ended Rank-Order Categorical/Nominal Magnitude Estimate Ordinal Likert Scale Skip
Privacy & Protection Computer Literacy Automation Platforms & Browsers Devices
Assistive Technology
Table 1: Organisation of the guidelines, showing topics covered.
welcome
registration/log-in introduction
additional info/links questionnaire questionskk dd screening test
Although the guidelines provide minimal support for other aspects of the design process for online-questionnaires, their main focus is on the design and implementation stages associated with online-questionnaire creation. They describe the general organisational structure that should be adopted by the majority of online-questionnaires (see Figure 1) and then progressively refine the guidance according to the issues shown in Table 1.
Since it is not possible to include the comprehensive set of guidelines in this paper, excerpts are shown in Table 2 and Table 3 to provide a ‘flavour’ for the guidelines as a whole; the guidance in Table 2 relates to the formatting of text in online-questionnaires whilst that in Table 3 relates to the layout of form and field components commonly used to construct online-questionnaires.
There are a number of issues of importance when designing the textual content of an online-questionnaire:
a) Fonts used should be readable and familiar, and text should be presented in mixed case or standard sentence formatting; upper case (or all capitals) should only be used for emphasis;
b) Sentences should not exceed 20 words, and should be presented with no more than 75 characters per line. If elderly respondents are anticipated, then this limit should be reduced to between 50 and 65 characters per line. Paragraphs should not exceed 5 sentences in length;
c) Technical instructions (those being instructions related to the basic technical operation of the website delivering the questionnaire) should be written in such a way that non-technical people can understand them;
d) Ensure that questions are easily distinguishable, in terms of formatting, from instructions and answers;
e) For each question type, be consistent in terms of the visual appearance of all instances of that type and the associated instructions concerning how they are to be answered. In particular, keep the relative position of the question and answer consistent throughout the questionnaire. Where different types of questions are to be included in the same questionnaire, each question type should have a unique visual appearance;
f) When designing for access by users with disabilities and the elderly, employ a minimum of size 12pt font and ensure that the font colour contrasts significantly with the background colouring. Text should be discernable even without the use of colour. It is advisable to test font colours and size with a screen magnifier to ensure usability prior to release;
g) If targeting an elderly audience, provide a text-sizing option on each page, use bold face but avoid italics, and left-justify text. It is also advisable to increase the spacing between lines of text for ease of reading by this respondent group; h) Make sure that text is read (by screen readers) in a logical order. Specifically, set the tab order on the pages. This is especially true for actual questions in the questionnaire – think carefully about the order in which a visually impaired user will hear the elements of a question, including the instructions and response options.
Table 2: An excerpt from the online-questionnaire design guidelines.
When reading the examples, it is important to note that none of the guidelines are particularly innovative in their own right; each has been drawn from the
aforementioned sources covered by the environmental scan. What is novel, however, is the fact that applicable guidelines from these disparate sources have been collated into a unified set which is presented methodically as a comprehensive, practical guide to online-questionnaire design; webpage design concepts such as visual design principles have been integrated with the large body of knowledge on paper-based questionnaire design principles to provide practical support for designers of online-questionnaire.
Layout :: Forms and Fields: By their very nature, questionnaires include elements
common to forms – that is, layout and the use of fields for data entry. Users with disabilities can find forms and fields problematic, and so it is important that the following guidelines – which are relevant across all respondent groups – be taken into consideration when laying out these elements of a questionnaire:
a) Locate field labels close to their associated fields so that respondents can easily make the association; this also prevents labels becoming lost when a screen is magnified by users with visual impairment.
b) A ‘submit’ (or similar) button should always be located adjacent to the last field on any given page so that it is easily identified by respondents at the point at which they have completed the question responses; this is again especially important for users of assistive technology since it goes some way to ensuring that such a button will not be overlooked when the screen is magnified.
c) The tab order for key based navigation around the fields in a questionnaire should be logical and reflect the visual appearance as far as is possible.
d) Fields are most easily read if stacked in a vertical column and any instructions pertaining to a given field should appear before and not after the field if it is to be understood by users of assistive technology.
Table 3: Another excerpt from the online-questionnaire design guidelines.
4 An Observational Study
Having established the set of guidelines, we set up an informal study to observe the extent of the influence of the guidelines on the design of an online-questionnaire. This is the first in a series of planned evaluations to determine the effect of applying the guidelines to online-questionnaire design, and in turn, the effectiveness of the set of guidelines as a practical support measure during the design process.
4.1 The Observational Procedure
A contract software developer was hired to create an online-questionnaire for the purpose of surveying public awareness of security issues when using the internet. We established the following process by which we could observe the use of the guidelines when applied to this real, substantial online-questionnaire development project.
The software developer (henceforth referred to as M) employed to develop the electronic survey had no previous experience of questionnaire development (paper-based or electronic). We specifically selected a developer without prior experience since we did not want previous exposure to online-questionnaire design to
influence the design process under observation. M did, however, have extensive experience with website design. We felt that a developer with this profile may be representative of many of the users of the online-questionnaire design and delivery tools on the market and/or of the typical developers of online-surveys within business environs.
M was provided with a plain text list of the 29 questions (including response sets where applicable) that were to be incorporated in the survey; no indication was given as to the question type/style nor to layout. For our purposes, we did not want to assess M’s ability to appropriately phrase the survey questions; instead, experts in questionnaire design and the domain being studied formulated the questions and response options independently of this observational study.
As a ‘warm up’ exercise, M was asked to develop a first prototype of the online-questionnaire. M was not provided with any advice on questionnaire design at this point. The aim of this exercise was simply to familiarise M with the technology and protocols of the organization as well as the survey questions; the resulting prototype was effectively a ‘throw away’ prototype and as such is not the focus of this discussion.
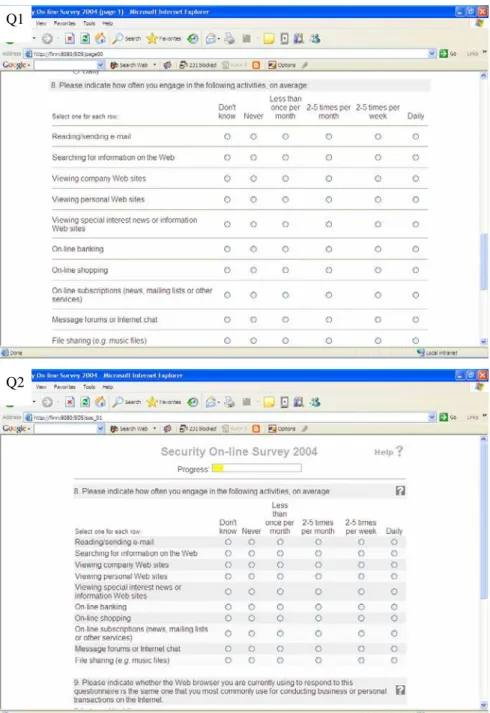
After the ‘warm up’ exercise, M was furnished with a set of guidelines for the development of paper-based questionnaires. These were drawn from the same sources for paper-based questionnaire design as were used to generate the comprehensive set of guidelines discussed in the previous section. M was then asked to design and develop an online-questionnaire with reference to the guidelines for paper-based questionnaire design. A screen shot of part of the resulting online-questionnaire (known hereafter as Q1) is shown in Figure 2.
Finally, upon completion of Q1, M was provided with the complete, comprehensive set of guidelines for the design of online-questionnaires (of which the paper-based design guidelines formed a subset). M was asked to design and develop another online-questionnaire with reference to the complete set of guidelines. A screen shot of part of the resulting online-questionnaire (known hereafter as Q2) is shown in Figure 2. During each of the above design and development exercises, M was asked to maintain a log of design issues and their resolution relative to the guidelines available at the time.
Although one might argue that learning had a significant effect on the final design of Q2, and to a certain extent this will be true, we had no option but to deliver the guidelines in this order. Since the paper-based guidelines are a subset of the comprehensive guidelines, we could not have isolated the influence of the paper-based guidelines had the comprehensive set been used by M prior to the paper-based set. Additionally, we essentially wanted to use the observed experience with the paper-based guidelines as a ‘control’ against which to compare the effect of the comprehensive set of design guidelines; we felt that it would have been an unfair comparison to have simply compared the ‘warm up’ version of the online-questionnaire to Q2 – the paper-based guidelines are readily available to questionnaire designers and so their use as a ‘control’ was considered more realistic for this study.
Figure 2: Screen shot of question 8 from both versions of the online-questionnaire, labelled
accordingly.
Q1
Once both versions of the online-questionnaire were fully tested, the survey was made publicly available online. All respondents were required to complete an identical click-through consent form; thereafter, in an alternating pattern, respondents were presented with either Q1 or Q2 – for example, if respondent x was allocated Q1, then respondent x + 1 was allocated Q2. Using this allocation, each questionnaire had an equal exposure rate; no respondent was aware of the existence of the alternative version of the questionnaire. For the purpose of the actual survey being conducted, the wording and type of each question was identical across both Q1 and Q2; what differed between Q1 and Q2 were the aesthetics, structure, provision of help, and level of automation.
4.2 Comparing the Two Designs
Consider the difference in aesthetics and structure between Q1 and Q2. Q1 comprised 4 long scrolling pages; in Q2, the questionnaire was spilt up into a maximum of 15 pages (depending on skip question responses) with, as far as possible, minimal need for scrolling. Q2 made more use of block shading to enhance the readability of the questionnaire and to differentiate between questions, instructions, and response options. Questions within Q1 were typically quite condensed within each page – each page had a ‘cluttered’ feel; in Q2 more use was made of white space between questions to enhance readability. Conversely, as shown in Figure 2, response options in matrix questions were brought into closer proximity in Q2 to support easier visual association between radio buttons and response labels and ensure that response labels were never widowed, as a result of scrolling, from the radio buttons.
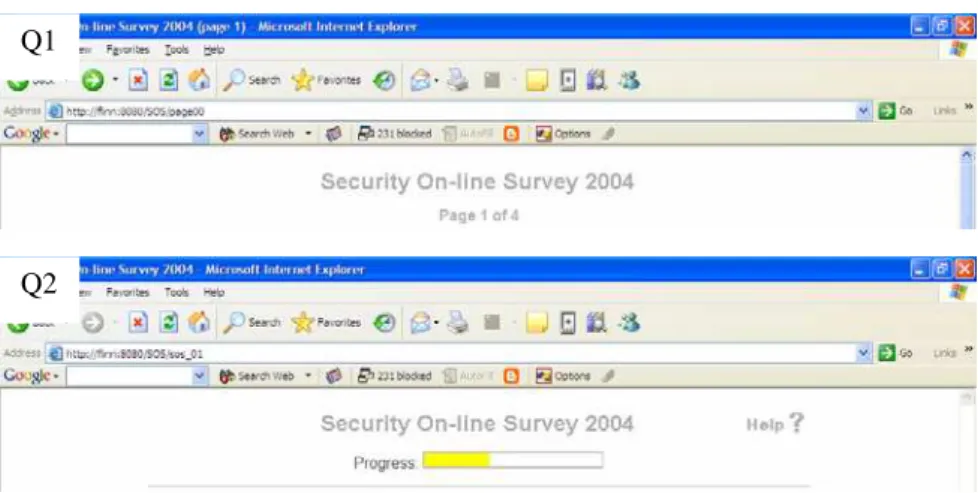
Figure 3: Progress indicators from both versions of the online-questionnaire, labelled
accordingly.
It is in the scope of help and level of automation that the two versions of the questionnaire differ the most. Although Q1 does provide some indication of progression through the questionnaire, given the extent of questions per scrolling
Q1
page of the questionnaire, the scale provides for only a very high level judgement of progress. In contrast, Q2 uses a progress indicator which, given the lesser extent of questions on each page, is better able to support a more accurate assessment of progress. Both indicators are shown in Figure 3.
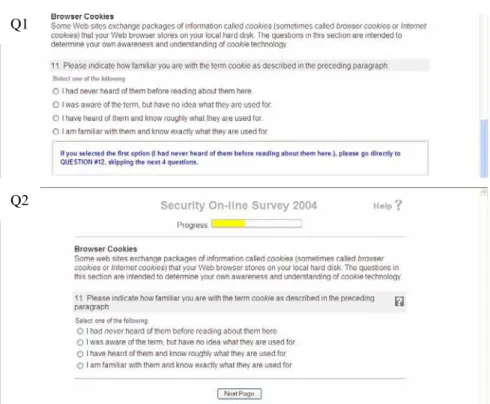
Figure 4: A skip question from both versions of the online-questionnaire, labelled
accordingly.
The online-questionnaire included four skip questions. Q1 provided written instruction to the respondents to direct them to the next applicable question, as determined by their response to the skip question (see Figure 4). In contrast, all skip questions (and thereby patterns) were encoded within Q2 such that the cognitive load associated with skip patterns was removed entirely from the respondents who were subsequently wholly unaware that they were following skip patterns (see Figure 4).
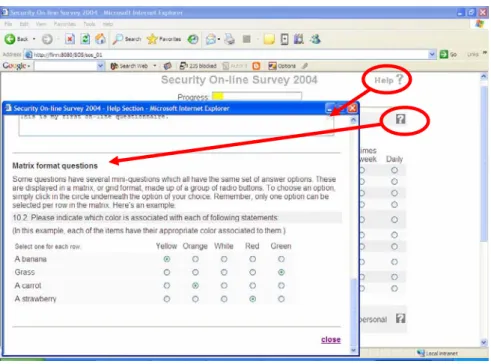
Finally, Q2 included a pop-up help facility which was entirely absent from Q1. At the top of each page, a link to a pop-up help screen was always available (see Figure 5) and provided help about the mechanics associated with answering all of the question types in the questionnaire; adjacent to each question there was also a ‘help’ link which provided context sensitive help relative to the mechanics of that particular question type - Figure 5 shows an example of help for a matrix style question.
Q1
Figure 5: Help facility in Q2 – clicking on the help links in a page brings up
context-sensitive help to assist respondents in the mechanics of responding.
As can be seen, there were a number of substantial differences between the two versions of the questionnaire in terms of general aesthetics, structure, automation, and help. While the guidelines for paper-based questionnaire design that were applied to Q1 prompted effective question formatting (this was the focus of most entries in M’s log for Q1), it was the comprehensive set of guidelines for online-questionnaire design that appeared to prompt M to make substantial changes to the aforementioned aspects of Q2. On the basis of our observations, it would seem that without the comprehensive set of guidelines, M’s design was restricted to following the traditional paper-based model – the comprehensive guidelines seemed to encourage M to ‘think out of the box’ – or more laterally – and embrace the functionality available in the electronic delivery mechanism (a process which did not seem to happen ‘intuitively’ without prompting from the guidelines). They also appeared to encourage M to give considerable thought to each functional design decision (e.g. tabular presentation and the accessibility issues associated with such presentation) since extensive discussion of rationale concerning such decisions formed the basis of most comments in M’s log for Q2. Anecdotally, M seemed to appreciate the support of the guidelines – as indicated in the following quotation taken from a post-development interview:
“By using web-based guidelines, it encompasses the practicality of paper-based guidelines as well as guidance for a web medium […] the advantages of having such guidelines are countless. […] The
guidelines offered solutions for problems I hadn’t even considered […] The [comprehensive set of] guidelines improve[d] the questionnaire”.
4.3 Comparing the Responses to the Two Designs
In terms of functionality and look-and-feel, the comprehensive set of guidelines appears to have had a substantial influence on the design of the questionnaire (based on a qualitative comparison of Q1 and Q2). We therefore decided to look for qualitative differences in the ‘responses’ returned for the two versions of the questionnaire. That is, we wanted to see what, if any, impact the above noted differences in functionality and look-and-feel had on the manner in which the respondents completed the two versions of the questionnaire; we were not concerned with the semantics of their responses. It is important to reiterate that both Q1 and Q2 asked exactly the same questions and presented the response options to these questions using the same question style; thus, any differences between the quality and/or quantity of responses between Q1 and Q2 can essentially be attributable to the differences discussed in section 4.2.
A total of 236 questionnaires were completed: Q1 achieved a completion rate of 64.6% which was only slightly less than the 65.7% rate attained by Q2. There was no significant difference in the average time taken to complete each version of the questionnaire.
Based on the hypothesis that Q2, as a result of its aesthetic and functional enhancement, would be ‘easier to use’ and therefore less frustrating, we anticipated that respondents using Q2 would complete more of the open-ended questions than respondents using Q1; that is, Q2 respondents would be more inclined to invest the necessary additional effort required to complete this type of question. This was not found to be the case and, in fact, there was no real difference in the average length of such responses between the two versions of the questionnaire. That said, albeit not statistically significant, 14.5% of Q1 respondents left questions unanswered (not counting open-ended questions or those which should have been left unanswered by virtue of applicable skip patterns) whereas this figure was only 10.1% for Q2. This would suggest that the aesthetics and functionality of Q2 were more conducive to supplying a response to questions.
For all matrix style questions, we assessed the extent to which respondents relied on neutral responses and/or exhibited response set behaviour. There was no significant difference between Q1 and Q2 in this regard.
Perhaps the two most interesting findings concern respondents’ handling of skip questions/patterns and abandonment behaviour. Consider, first, skip questions. Obviously, skip questions and their associated patterns were completely automated in Q2, and thereby hidden from the respondents. As such, it was impossible for respondents to Q2 to waste effort answering questions that should have been skipped. In contrast, Q1 required respondents to comprehend written skip patterns and manually skip the applicable questions. Consequently, 11.6% of respondents who should have skipped at least one question, answered questions that they should have skipped. On average, these respondents answered 85% of the questions that they should have skipped (ranging from a minimum of 25% to a
maximum of 100% of such questions). Naturally, this represents a significant waste of respondents’ time and effort and is likely to lead to irreparable levels of frustration. It highlights the benefit of automating this aspect of online-questionnaire delivery.
Approximately 35% of respondents who started the survey failed to complete it; this figure was essentially the same for both Q1 and Q2. We hypothesised that, as a result of its enhanced functionality and aesthetics, Q2 would hold the attention of such respondents for considerably longer than Q1; that is, respondents would complete more of Q2 before abandoning it than Q1. To test this hypothesis, for each of the respondents who abandoned the survey part way through, we calculated (taking into account skip patterns) the last possible question that they could have seen on the basis of the last webpage requested. For ethical reasons, we could not record the precise questions which respondents actually answered since they had abandoned the survey and so we too had to abandon their partial results; the only data we could ethically access was the series of webpage request patterns from the server log. From this, we calculated the extent of completion for each respondent as a percentage of the total possible given their path thus far. On average, respondents who abandoned Q1 completed 32.4% of the questionnaire before giving up; in contrast, respondents to Q2 went significantly further (on average 42.4%) before abandoning the survey (T122 = 1.82, p = 0.035). Had we been able
to assess the precise question at which the respondents abandoned their versions of the survey, we feel that the difference in extent of completion would have been even more pronounced; each of the four pages in Q1 contain considerably more questions than the fifteen pages in Q2 and so in essence our calculations were potentially giving the respondents to Q1 a large benefit of doubt – it was highly unlikely that respondents were on the last question of a page when they abandoned the survey. Given the importance, yet associated difficulty, of achieving high response rates for questionnaire-based surveys, this finding is important; it would suggest that there is demonstrated potential for the set of comprehensive design guidelines to assist online-questionnaire designers to develop questionnaires which encourage respondents to persevere with a questionnaire.
4.4 Discussion
On the basis of the aesthetic and functional disparity between the two versions of our questionnaire, we had (somewhat naively perhaps) anticipated finding more significant differences in terms of quality and quantity of responses between Q1 and Q2. With hindsight, however, we feel this study has helped raise interesting questions concerning what constitutes success in this domain. How can two (or more) designs for the same online-questionnaire be fairly and effectively compared and evaluated? What are the dimensions of a successful and effective online-questionnaire? To what extent can these dimensions be addressed through the online medium as opposed to simply being a facet of questionnaire topic, question wording, scale choice etc?
That said, the results outlined in the previous section suggest that application of the comprehensive set of guidelines to the design process for an online-survey may be extremely beneficial in tackling two of the most complex issues associated with
questionnaire-based surveys: respondent perseverance and handling of skip patterns. In this regard, we feel that our study has yielded positive results.
5 Conclusions
Albeit this was an initial observation of the merit of the guidelines for online-questionnaire design, we feel that some interesting and valuable findings have come to light. It would appear that the guidelines encourage more lateral thinking in terms of online-questionnaire design while, at the same time, promoting careful consideration of design issues that effect accessibility and thereby usability. This is reflected in the aesthetic and functional differences between Q2 and Q1.
It would have been advantageous to have been able to ‘tag’ a post-questionnaire questionnaire to the online-survey in order to elicit information about respondents’ subjective impressions of their allocated questionnaires. However, we felt this would have been too much on top of what was already a complex questionnaire and would ultimately have been detrimental to the survey itself. The extent of progress prior to abandoning the online-survey is therefore our only insight into respondents’ subjective assessment of their allocated questionnaire: the results suggest that the comprehensive set of guidelines for online-questionnaire design has the potential to improve subjective reaction to surveys delivered online.
Finally, as mentioned in Section 2, online-questionnaires have the potential to reduce non-response errors as a result of questionnaire abandonment but only when appropriate measures are incorporated within the design of online-questionnaires. The significant improvement in extent of completion prior to abandonment for Q2 indicates that the comprehensive set of guidelines has demonstrated potential for combating this error type for online-questionnaires.
We feel that the observed qualitative results of this study are encouraging for the further development of the guidelines, for the development of mechanisms for their inclusion in the design process for online-questionnaires, and ultimately for their role in the ‘bigger picture’ that is online survey delivery across many domains such as e-Government, e-Business, and e-Health.
References
American Statistical Association (1999), American Statistical Association Series:
What is a Survey?, Accessed: 7th July 2003,
http://www.amstat.org/sections/srms/brochures/designquest.pdf
Badre, A. N. (2002), Shaping Web Usability: Interaction Design in Context, Pearson Education Inc., Boston, MA
Bandilla, W., M. Bosnjak and P. Altdorfer (2003), Self Administration Effects? A Comparison of Web-Based and Traditional Written Self-Administered Surveys Using the ISSP Environment Module, Social Science Computer Review, 21(2), pp. 235 - 243
Belson, W. A. (1981), The Design and Understanding of Survey Questions, Gower Publishing Co. Ltd., Great Britain
Brewer, J. (2001), How People with Disabilities Use the Web, Technical Report W3C Working Draft, 4th January
CASRO (1998), Council of American Survey Research Organization Guidelines
for Survey Research Quality, Accessed: 7th July 2003,
http://www.casro.org/guidelines.cfm
Coyne, K. P. and J. Nielsen (2001), Beyond ALT Text: Making the Web Easy to
Use for Users with Disabilities, Technical Report Nielsen Norman Group, Fremont, CA, October
Coyne, K. P. and J. Nielsen (2002), Web Usability for Senior Citizens, Technical Report Nielsen Norman Group, Fremont, CA, April
Crawford, S. D., M. P. Couper and M. J. Lamias (2001), Web Surveys: Perceptions of Burden, Social Science Computer Review, 19(2), pp. 146 - 162
Dillman, D. A. (1978), Mail and Telephone Surveys: The Total Design Method, Wiley-Interscience, New York
Dillman, D. A. (2000), Mail and Internet Surveys: The Tailored Design Method, John Wiley & Sons, Inc., New York, NY
Fink, A. (1995), How to Ask Survey Questions, Sage Publications, Thousand Oaks, California
Hinton, S. M. (1998), From home page to home site: effective Web resource discovery at the ANU, in Proceedings of Seventh International World Wide Web
Conference (WWW7), Brisbane, Australia, 14 - 18 April, The Australian National University
Jackson, W. (1988), Research Methods: Rules for Survey Design and Analysis, Prentice-Hall, Scarborough
Kothari, R. and J. Basak (2002), Perceptually Automated Evaluation of Web Page Layouts, in Proceedings of Eleventh International World Wide Web Conference, Honolulu, Hawaii, 7 - 11 May, IBM India Research Laboratory
Kwak, N. and B. Radler (2002), A Comparison Between Mail and Web Surveys: Response Pattern, Respondent Profile, and Data Quality, Journal of Official
Statistics, 18(2), pp. 257 - 274
Lindgaard, G. (1994), Usability Testing and System Evaluation, Chapman & Hall Inc., London
Lumsden, J. and W. Morgan (2005), Online-Questionnaire Design: Establishing Guidelines and Evaluating Existing Support, in Proceedings of International
Conference of the Information Resources Management Association (IRMA'2005), San Diego, 15-18 May
Lynch, P. J. and S. Horton (1997), Web Style Guide, Yale Center for Advanced Instructional Media, Italy
National Cancer Institute (2002), National Cancer Institute's Research Based Web
Design & Usability Guidelines, Accessed: 10th June 2003,
http://usability.gov/guidelines/index.html
National Institute on Aging and the National Library of Medicine (2001), Making
Your Web Site Senior Friendly, Accessed: 19th June 2003,
http://www.nlm.nih.gov/pubs/checklist.pdf
Norman, K. L., S. Lee, P. Moore, G. C. Murry, W. Rivadeneira, B. K. Smith and P. Verdines (2003), Online Survey Design Guide, University of Maryland, Accessed: 17th June 2003, http://lap.umd.edu/survey_design/tools.html
OECD (2001), Bridging the "Digital Divide": Issues and Policies in OECD
Countries, Organisation for Economic Co-operation and Development, Accessed: 3rd July 2003, www.oecd.org
OECD (2002), Organisation for Economic Co-operation and Development ITC
Database, Organisation for Economic Co-operation and Development, Accessed: 2nd July 2003, http://www.oecd.org/EN/statistics/0,,EN-statistics-13-nodirectorate-no-no--13,00.html
Oppenheim, A. N. (1992), Questionnaire Design, Interviewing and Attitude
Measurement, Pinter Publishers, London
Schonlau, M., R. D. Fricker and M. N. Elliott (2001), Conducting Research via
E-mail and the Web, RAND, Accessed: 16th June 2003,
http://www.rand.org/publications/MR/MR1480/
Stover, A., K. P. Coyne and J. Nielsen (2002), Designing Usable Site Maps for
Websites, Technical Report Nielsen Norman Group, Fremont, CA, January
Stover, A. and J. Nielsen (2002), Accessibility and Usability of Flash for Users
with Disabilities, Technical Report Nielsen Norman Group, Fremont, CA, October Taylor-Powell, E. (1998), Questionnaire Design: Asking Questions with a
Purpose, Technical Report G3658-2, University of Wisconsin - Extension, Wisconsin, May
W3C (1999), Web Content Accessibility Guidelines 1.0, Accessed: 8th June 2003,