PAX3 confers functional heterogeneity in skeletal muscle stem
cell responses to environmental stress
Audrey Der Vartanian1,2, Marie Quétin1,2, Stéphanie Michineau1,2, Frédéric Auradé1,3, Shinichiro Hayashi4, Christelle Dubois1,2, Didier Rocancourt5, Bernadette Drayton-Libotte1,2, Anikó Szegedi1,2, Margaret Buckingham5, Simon J. Conway6, Marianne Gervais1,2,*, and Frédéric Relaix1,2,7,8,9,10,11,*
1Inserm, IMRB U955-E10, 94000, Créteil, France
2Faculté de Médecine, Université Paris Est Créteil, 94000, Créteil, France
3Sorbonne Université, Inserm U974, Center for Research in Myology, Paris, France
4Department of Neuromuscular Research, National Institute of Neuroscience, National Center of
Neurology and Psychiatry, 187-8551, Tokyo, Japan
5Department of Developmental and Stem Cell Biology, Centre National de la Recherche
Scientifique, Unité de Recherche Associée 578, Institut Pasteur Paris
6Herman B Wells Center for Pediatric Research, Indiana University School of Medicine,
Indianapolis, IN, 46202, USA
7Ecole Nationale Vétérinaire d’Alfort, 94700, Maisons-Alfort, France 8Etablissement Francais du Sang, 94017, Créteil, France
9APHP, Hopital Henri Mondor, DHU Pepsy & Centre de Référence des Maladies
Neuromusculaires GNMH, 94000, Créteil, France
10Lead Contact
SUMMARY
Muscle satellite cells (MuSCs) are the quiescent muscle stem cells required for adult skeletal muscle repair. The impact of environmental stress such as pollution on MuSC behavior remains unexplored. We evaluated the impact of 2,3,7,8-tetrachlorodibenzo-p-dioxin (TCDD) exposure, a ubiquitous and highly toxic pollutant, on MuSCs by combining in vivo mouse molecular genetic
11Correspondence: [email protected]. *senior author
AUTHOR CONTRIBUTIONS
Designed experiments, A.D.V., S.H., F.A. M.G. and F.R.; Performed experiments, A.D.V., M.G., M.Q., F.A., S.M., S.H., C.D., B.D.L., A.S.; Generated mouse models, F.A. D.R., S.J.C. and F.R.; Wrote the manuscript, A.D.V, M.G., S.M., F.A. and F.R.; Funding Acquisition, M.B., F.R., S.J.C.; Supervision, M.G. and F.R.
Publisher's Disclaimer: This is a PDF file of an unedited manuscript that has been accepted for publication. As a service to our customers we are providing this early version of the manuscript. The manuscript will undergo copyediting, typesetting, and review of the resulting proof before it is published in its final citable form. Please note that during the production process errors may be discovered which could affect the content, and all legal disclaimers that apply to the journal pertain.
HHS Public Access
Author manuscript
Cell Stem Cell
. Author manuscript; available in PMC 2020 June 06.Published in final edited form as:
Cell Stem Cell. 2019 June 06; 24(6): 958–973.e9. doi:10.1016/j.stem.2019.03.019.
A
uthor Man
uscr
ipt
A
uthor Man
uscr
ipt
A
uthor Man
uscr
ipt
A
uthor Man
uscr
ipt
models with ex vivo studies. While all MuSCs express the transcription factor PAX7, we show that a subset also express PAX3 and exhibit resistance to environmental stress. Upon systemic TCDD treatment, PAX3-negative MuSCs display impaired survival, atypical activation and sporadic differentiation through xenobiotic Aryl Hydrocarbon Receptor signaling. We further show that PAX3-positive MuSCs become sensitized to environmental stress when PAX3 function is impaired and that PAX3-mediated induction of mTORC1 is required for protection. Our study therefore identifies a functional heterogeneity of MuSCs in response to environmental stress controlled by PAX3.
Graphical Abstract
eTOC Blurb
Der Vartanian and colleagues identify a functional heterogeneity of skeletal muscle stem cells response to environmental stress. While PAX3-negative muscle stem cells display impaired survival, aberrant activation and sporadic fusion to myofibers upon TCDD exposure, PAX3-positive muscle stem cells are protected against pollutant through a mTORC1-dependent Galert response.
INTRODUCTION
Adult stem cells are found in many mammalian tissues where they are involved in tissue maintenance, repair and regeneration via self-renewal and differentiation of tissue-specific cell types (Weissman, 2000). Skeletal muscle satellites cells (MuSCs) are the myogenic stem cells of adult muscle embedded between the plasmalemma and basal lamina of myofibers
A
uthor Man
uscr
ipt
A
uthor Man
uscr
ipt
A
uthor Man
uscr
ipt
A
uthor Man
uscr
ipt
(Katz, 1961; Mauro, 1961). Under normal homeostatic conditions, MuSCs are in a quiescent state G0 (Cheung and Rando, 2013) and are characterized by the expression of PAX7, a key transcription factor required for their maintenance (Horst et al., 2006; Lepper and Fan, 2010; Oustanina et al., 2004; Relaix, 2006; Seale et al., 2000). PAX3, a paralogue of PAX7 has also been detected in a subset of adult MuSCs (Calhabeu et al., 2013; Relaix et al., 2006). Upon trauma or in diseased conditions, PAX7+ MuSCs in G0 will be activated, enter cell cycle G1, express the myogenic factor MYOD, undergo extensive expansion and
differentiate into myogenic cells by downregulating PAX7 and inducing MYOGENIN with the expression of other downstream myogenic-specific genes, allowing tissue repair (Bismuth and Relaix, 2010; Olguin and Pisconti, 2012; Zammit et al., 2006). A subset will downregulate MYOD and exit the cell cycle to self-renew the pool of PAX7+ MuSCs for future needs (Collins, 2006; Zammit et al., 2004). Interestingly, distant injury can prime G0 PAX7+ MuSCs for activation in an intermediate G(alert) state characterized by cell size increase and PI3K-mTORC1 activation, but without disrupting the niche nor entering the cell cycle or myogenesis (Rodgers et al., 2014). Alterations of the balance between
quiescence, activation and differentiation may result in impaired function, premature MuSCs exhaustion and subsequent skeletal muscle regeneration failure.
Despite the fact that environmental pollutants are a part of modern life, the impact of environmental stress on adult stem cells remains poorly understood. It has been suggested that environmental pollutants could exert their adverse effect by targeting stem cell function, resulting in changes in the stem cell differentiation potential and alterations of self-renewal capacity (Bock, 2017). Recent studies redefining the cell identity of quiescent and early activated MuSCs (Machado et al., 2017; van den Brink et al., 2017; van Velthoven et al., 2017) using direct approaches such as in situ fixation (Machado et al., 2017) show that the Aryl Hydrocarbon Receptor (AHR) is highly expressed in quiescent and early activated MuSCs, suggesting these stem cells are highly responsive to environmental stress. AHR is a cytosolic ligand-activated transcription factor that mediates toxic effects of pollutants such as 2,3,7,8-tetrachlorodibenzo-p-dioxin (TCDD) in vertebrates (Okey, 2007). Following ligand activation, the AHR-ligand complex translocates into the nucleus and heterodimerizes with the AHR nuclear translocator (ARNT) to induce expression of detoxification pathways, including those coding for the phase I xenobiotic-metabolizing cytochrome P450 enzymes such as CYP1A1 (Carrier et al., 1994; Ma, 2001). TCDD is the most toxic and ubiquitous persistent organic pollutants to which humans are daily exposed (Parzefall, 2002). The chemical structure of these pollutants allows them to be soluble in lipids leading to their facilitated bioaccumulation in adipose tissue (Pavlikova et al., 2015).
Here we identify a bimodal response of MuSCs to systemic environmental stress exposure depending on the expression of PAX3. We show that injection of TCDD promotes, without local injury, AHR-dependent- loss of PAX3 negative MuSCs by activation and fusion, and, for a small subset, impaired survival. Interestingly, PAX3-expressing MuSCs are protected via induction of G(alert) features. This resistance is dependent on PAX3 function in vivo and can be reversed by impairing mTORC1 function. Our study therefore reveals that MuSCs display a functional heterogeneity in responding to environmental stress depending on PAX3 function.
A
uthor Man
uscr
ipt
A
uthor Man
uscr
ipt
A
uthor Man
uscr
ipt
A
uthor Man
uscr
ipt
RESULTS
Exposure to TCDD pollutant affects skeletal homeostasis and the MuSC pool.
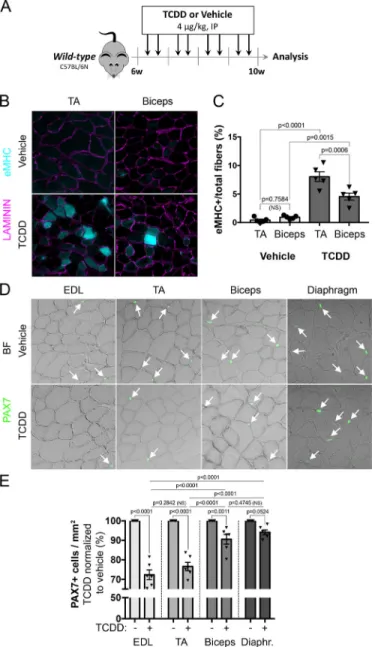
To evaluate the impact of environmental stress on skeletal muscle, wild-type mice were injected intraperitoneally with 4µg/kg of 2,3,7,8-tetrachlorodibenzo-p-dioxin (TCDD) twice per week for one month (Figure 1A). Several muscles were collected for histological analysis (Figure 1A-E). TCDD treatment had no impact on fat deposition and fibrosis in both TA and biceps (data not shown). However, histological analysis revealed significant expression of the embryonic isoform of myosin heavy chain (eMHC) in both muscles following systemic TCDD exposure, suggesting ongoing contribution from MuSCs to myofibers (Figure 1B). Interestingly, the percentage of eMHC+ myofibers upon TCDD treatment was significantly higher in TA that in biceps (Figure 1C). Since MuSCs are mediating muscle regeneration, we tested whether exposure to TCDD may affect their number. Quantification of PAX7+ MuSCs revealed a substantial reduction in all muscles examined. Consistent with eMHC analysis (Figure 1B), reduction in PAX7+ cell number was more pronounced in hindlimb muscles (EDL and TA) than in trunk and forelimb muscles (biceps and diaphragm) (Figure 1D-E). Thus, TCDD-induced systemic
environmental stress triggers sporadic and muscle-specific loss of PAX7+ MuSCs associated with a regenerative phenotype in the absence of local damage.
Differential loss of MuSCs exposed to TCDD correlates with muscle-specific expression of PAX3.
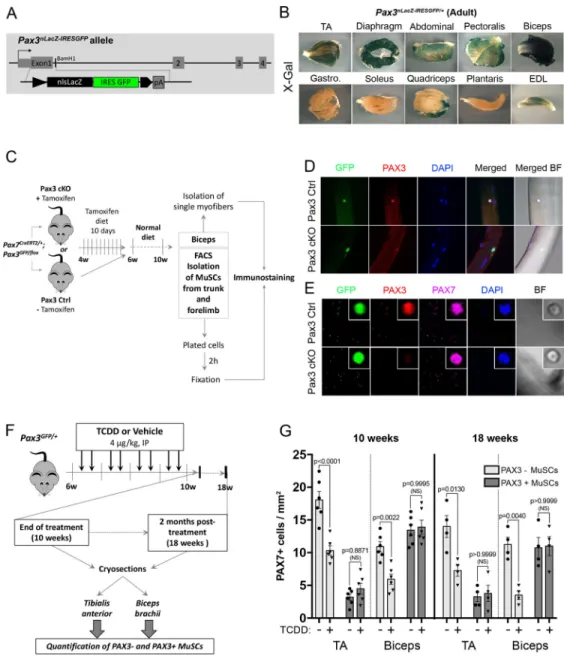
MuSCs are heterogeneous regarding PAX3 expression (Calhabeu et al., 2013; Kuang et al., 2006; Relaix et al., 2006) suggesting a possible link with the muscle-specific impact of environmental stress. Using a Pax3nlacZ-IRESGFP/+ knock-in mouse line that express a dual β-Galactosidase and GFP reporter (Figure 2A), we first characterized the pattern of PAX3 expression in various adult muscles. Biceps and diaphragm showed the strongest X-gal (PAX3) staining, whereas moderate expression was observed in pectoralis, abdominal, TA and EDL muscle staining (Figure 2B). Plantaris, quadriceps, soleus and gastrocnemius showed only rare sporadic X-gal staining (Figure 2B). As a whole, PAX3 is highly expressed in trunk and forelimb MuSCs and low in most hindlimb muscles. In order to show that Pax3 reporters faithfully reproduced PAX3 expression in vivo we intercrossed Pax7creERT2/+ (Murphy et al., 2011) with Pax3GFP/+ (Relaix et al., 2005) and Pax3flox/+ mice (Koushik et al., 2002)(Figure 2C). PAX3 protein expression was detected in GFP+ MuSCs from both isolated biceps myofibers and plated PAX7+ GFP+ MuSCs from control (Pax3 Ctrl) mice (Figure 2D-E). We did not observe any PAX3 expression elsewhere in skeletal muscle (Alonso-Martin et al., 2018). This specific PAX3 expression was lost in GFP-traced cells from Pax7creERT2/+: Pax3GFP/flox (Pax3 cKO) mice (Figure 2D-E). Thus PAX3 is expressed in a muscle-specific stem cells subpopulation.
We next investigated the impact of TCDD exposure on PAX3+ (expressing both PAX7 and PAX3) and PAX3- (expressing only PAX7) MuSCs using Pax3GFP expression in TA and biceps (Figures 2F-G, S1). PAX3+ MuSCs were revealed on muscle section by
co-immunostaining using anti-GFP (PAX3) and anti-PAX7 antibodies (Figure S1). At 10 weeks (end of the 4 weeks treatment), in control mice, only a few TA MuSCs (14%) expressed
A
uthor Man
uscr
ipt
A
uthor Man
uscr
ipt
A
uthor Man
uscr
ipt
A
uthor Man
uscr
ipt
PAX3 whereas in the biceps, the majority (55%) of the PAX7-expressing cells were also PAX3 positive (Figures 2F-G, S1B). Strikingly, systemic TCDD exposure specifically decreased the PAX3- MuSC subpopulation in both TA and biceps whereas PAX3+ MuSCs were not affected (Figures 2F-G, S1B). Thus, TCDD exposure induced a specific loss of PAX3- MuSCs in adult skeletal muscle, while PAX3+ MuSCs are preserved (Figures 2G, S1B). Long-term studies indicated that the specific loss of MuSCs persisted 8 weeks after TCDD treatment withdrawal (Figures 2F-G, S1C).
Bimodal response of MuSCs to TCDD correlates with PAX3 expression.
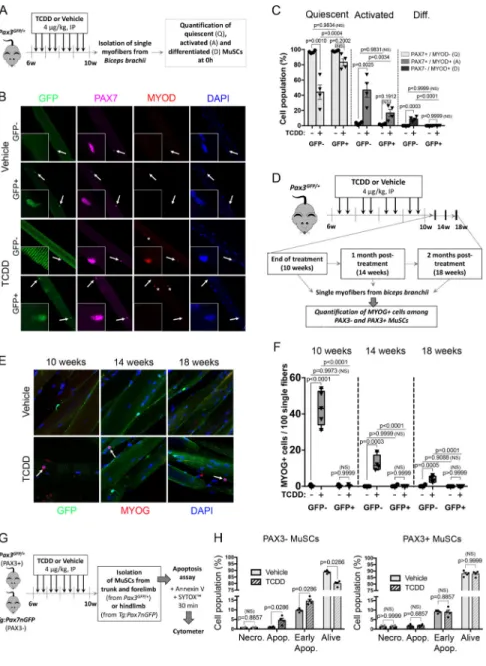
In order to further characterize the impact of TCDD exposure on MuSC subpopulations, we analyzed the activation and differentiation status of both PAX3+ and PAX3- MuSCs on freshly isolated myofibers (T0h) (Figure 3A-C). In vehicle-exposed Pax3GFP/+ mice, all MuSCs along the myofibers expressed PAX7, but showed no sign of activation/
differentiation, demonstrating that all MuSCs, independently of PAX3 expression, were quiescent (Figure 3B-C). In contrast, TCDD exposure promoted a significant activation of PAX3- MuSCs, detected by the co-expression of PAX7 and MYOD, while GFP+ (PAX3+) MuSCs remained mostly quiescent (Figure 3B-C). Interestingly, under TCDD exposure a small population of cells maintaining under the basal lamina expressed only MYOD (Figure 3B shown with an asterisk). This PAX7-MYOD+ cell population was negative for GFP expression (PAX3-subpopulation). In addition, we also observed that upon TCDD treatment, a few cells located under the basal lamina expressed MYOG and was detected in a GFP- subpopulation at the end of the treatment (10 weeks), then declines 4 weeks post-treatment (14 weeks) and becomes barely detectable at 8 weeks post-treatment (18 weeks) (Figure 3D-F). Similar results were obtained on freshly isolated MuSCs (Figure S2A-C). We conclude that TCDD exposure induces a specific activation and differentiation of PAX3- MuSCs.
As PAX3 and PAX7 are also involved in cell survival (Borycki et al., 1999; Relaix et al., 2006; Relaix et al., 2003), we analyzed apoptosis and necrosis by flow cytometry using Sytox/Annexin V staining. We isolated GFP- expressing cells from Pax3GFP/+ adult
forelimbs and Tg:Pax7nGFP (Sambasivan et al., 2009) hindlimb muscles treated with TCDD (Figures 3G-H, S2D-E). Since PAX7+ cells were isolated from hindlimb muscles, the vast majority of the analyzed MuSCs are not expressing PAX3 (PAX3-, see Figure 2B). In vehicle-treated mice, PAX3- and PAX3+ cells present a similar profile regarding the percentage of living, early apoptotic, apoptotic and necrotic cells (Figures 3H, S2E). Interestingly, TCDD exposure triggers a specific cell death of the PAX3- MuSCs in adult muscles (Figure S2E, red circle), whereas the PAX3+ MuSC subpopulation was not overtly affected (Figures 3H, S2E). Thus, TCDD exposure triggers a specific loss of PAX3- MuSCs through atypical activation and impaired survival.
TCDD induces fusion of PAX3- MuSCs to myofibers without local injury.
In order to further analyze the behavior of activated MYOD+ MuSCs upon TCDD exposure in vivo, we generated a Tg:MyoD-nLacZ transgenic mouse model using a 230kb BAC that contains all the reported regulatory elements of MyoD linked to a nLacZ reporter (Tg:BAC MyoD-nLacZ, Figure 4A). We performed systemic TCDD exposure in Tg:MyoD-nLacZ mice and analyzed β-Galactosidase (β–Gal) expression in TA and biceps (Figure 4B). The
A
uthor Man
uscr
ipt
A
uthor Man
uscr
ipt
A
uthor Man
uscr
ipt
A
uthor Man
uscr
ipt
stability of the nLacZ protein allowed us to follow MYOD-derived myogenic cells and their contribution to myofibers (resulting from myoblast cell fusion) using an anti-β-Gal antibody (Figures 4C-F). Co-immunostaining experiments using a PAX7 antibody revealed that in vehicle-treated mice the vast majority of the MuSCs in both TA and biceps did not co-express β-Gal (Figure 4C, 4E). Systemic TCDD treatment promoted activation of MuSCs by reducing the proportion of quiescent PAX7+MYOD- cells in both TA and biceps in vivo (Figure 4C-D), increasing the proportion of activated PAX7+ cells co-expressing MYOD in both TA and biceps (Figure 4C, 4E), consistent with our previous findings on freshly isolated myofibers (Figure 3B-C). This effect was more pronounced in TA, which contains a very low number of PAX3+ MuSCs compared to the biceps (Figures 4C, 4E, 2B, 2G). This muscle-specific MuSC activation linked with PAX3 expression also translated into an increased number of β-Gal+ myofibers (Figures 4C, asterisks and 4F for quantifications) in the TA compared with biceps.
To validate the differential myofiber contribution between PAX3+ and PAX3- MuSCs, we performed lineage studies by intercrossing Pax3GFP/+, Pax7CreERT2/+ and R26stop-Tomato mice, relying on the stability of the GFP to trace Pax3GFP MuSCs and the expression of Tomato upon tamoxifen treatment to follow all MuSCs (Figure 4G). Cre expression was induced using 10 days of tamoxifen diet in adult Pax3GFP/+; Pax7CreERT2/+; R26stop-Tomato mice prior to TCDD treatment (Figure 4G). In vehicle-treated mice, we observed a low and similar level of fusion of GFP+ and GFP- MuSCs over the 4 weeks periods of treatment, likely originating from a low homeostatic turn-over of MuSCs (Figure 4H-J), as previously observed (Pawlikowski et al., 2015). By contrast, upon TCDD treatment, while the GFP+ MuSCs did not show increased contribution to myofibers, GFP- MuSCs significantly increased their fusion with myofibers (Figure 4H-J). We next examined the percentage of centrally located nuclei in myofibers in both TA and biceps at the end of TCDD treatment (10 weeks) and, 4 and 8 weeks after TCDD treatment withdrawal (Figure 4K-L). We observed a drastic increase in centronucleated myofibers of mice exposed to TCDD 4 weeks after treatment withdrawal (14 weeks), with a higher percentage in TA compared to biceps (Figure 4K-L). This effect was still observed 2 months post-treatment (18 weeks), albeit at lower levels, suggesting a progressive return to normal homeostasis after TCDD withdrawal (Figure 4K-L). These results demonstrated that TCDD induces the specific activation and long-term contribution of PAX3- MuSCs into myofibers.
AHR signaling is required for MuSC activation in response to TCDD.
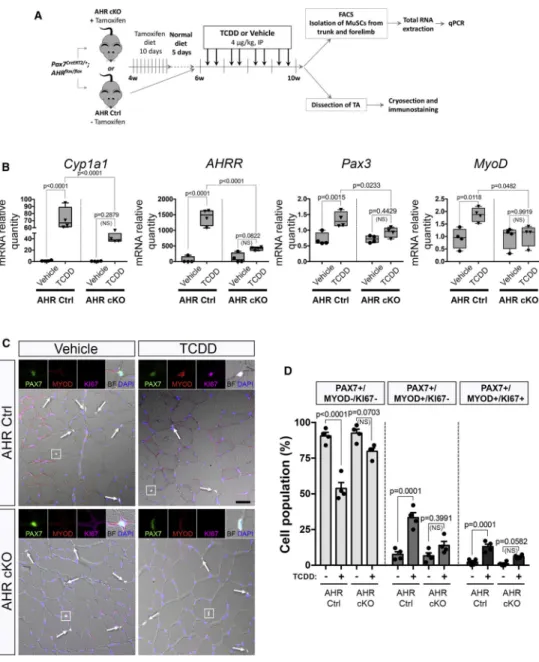
In many cell types, the effect of pollutants such as TCDD is mediated by the Aryl Hydrocarbon Receptor (AHR) pathway (Marlowe and Puga, 2005). To evaluate the involvement of AHR signaling in MuSCs from mice exposed to TCDD we generated a MuSC-specific AHR conditional knock-out mouse model (Pax7CreERT2/+; AHRfl/fl) (AHR cKO) (Figure 5A). We validated the efficiency of AHR deletion following tamoxifen-induced Cre ablation in AHR cKO MuSCs compared to AHR control MuSCs (Figure S3A-D). We also evaluated the activation of the AHR pathway in MuSCs isolated from mice exposed to TCDD by quantifying the AHR target genes, such as Cyp1a1, AHRR, Nqo1, Cyp1a2 and Cyp1b1 (Figures 5B, S3D). As anticipated, canonical AHR downstream genes were significantly increased in mice treated with TCDD compared to vehicle-treated
A
uthor Man
uscr
ipt
A
uthor Man
uscr
ipt
A
uthor Man
uscr
ipt
A
uthor Man
uscr
ipt
controls while this effect was abrogated in AHR cKO mice (Figures 5B, S3D). Interestingly, Pax3 gene expression was significantly increased under TCDD treatment. This effect was blunted in AHR cKO mice, suggesting that PAX3 expression is downstream of AHR signaling (Figure 5B). We also observed an AHR-dependent increase in MYOD expression in MuSCs isolated from mice treated with TCDD (Figure 5B), in keeping with our
histological analysis demonstrating that TCDD induces the activation of PAX3- MuSCs (Figures 3A-F, 4A-E). We next explored whether the loss of quiescence induced by TCDD treatment in MuSCs is mediated by AHR signaling. While a significant subset of MuSCs was displaying signs of atypical activation (either PAX7+MYOD+KI67- or PAX7-MYOD +KI67+) in TCDD-treated mice, we observed a complete abrogation of this activation in AHR cKO mice (Figure 5C-D, S3E-G). We conclude that TCDD promotes aberrant activation of PAX3- MuSCs via AHR signaling.
Impairing PAX3 expression leads to MuSCs sensitization to TCDD.
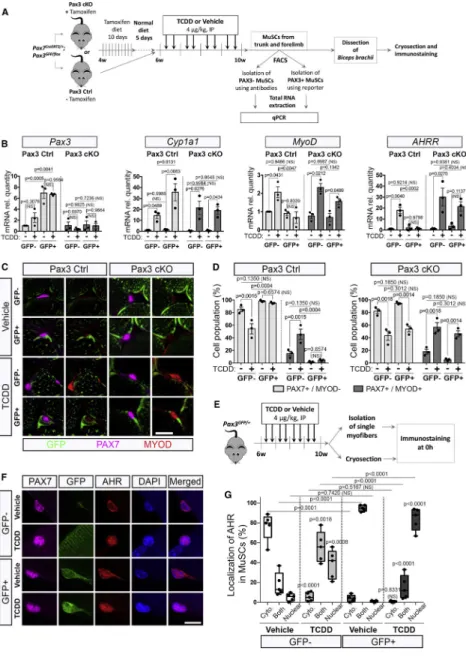
We then analyzed whether PAX3 expression is required for the protective effect from TCDD in PAX3+ MuSCs. To this end, we compared Pax3 control mice to Pax3 cKO in which PAX3-ablated cells are labeled with GFP (GFP+) (Figures 6A, S4, 2C-2E). We first checked that Pax3 was efficiently downregulated in MuSCs of Pax3 cKO mice (Figure 6B). We next analyzed the impact of TCDD treatment for the expression of canonical AHR signaling target genes, in both GFP+ and GFP- MuSC subpopulations isolated from Pax3 Ctrl or Pax3 cKO mice (Figures 6B, S4B). While Cyp1a1, Nqo1, Cyp1a2 and Cyp1b1 (Figures 6B, S4B) were highly induced upon TCDD exposure in both GFP+ and GFP- MuSC subpopulations of Pax3 Ctrl mice, AHRR displayed a differential response linked with PAX3 expression (Figure 6B). In Pax3 Ctrl mice, GFP+ MuSCs displayed enhanced activation of the AHR signaling pathway targets (Figures 6B, S4B) upon TCDD treatment compared to GFP- MuSCs. Ablation of PAX3 in GFP+ MuSCs abrogated the enhanced TCDD-induced AHR activation (Figures 6B, S4B). Upon TCDD exposure, MyoD expression was specifically induced in GFP+ MuSCs lacking PAX3 (Pax3 cKO mice) suggesting that PAX3 function is required to shield GFP+ MuSCs from the impact of TCDD (Figure 6B).
In order to establish that PAX3 function is required for PAX3+ MuSC resistance to
environmental stress, we treated Pax3 Ctrl and Pax3 cKO mice with TCDD and analyzed the behavior of GFP+ MuSCs (Figures 6C and 6D). We found that while GFP+ MuSCs remain quiescent (PAX7+MYOD-) in control mice treated with TCDD, PAX3-defective GFP+ MuSCs displayed a significant increase in activation (PAX7+MYOD+) (Figures 6C and 6D). Our result highlights a protective role of PAX3 against the activation of adult MuSCs by environmental pollutants.
We next investigated the link between AHR and PAX3 in Pax3GFP/+ mice (Figures 6E, S4C). On vehicle-treated biceps, PAX3 and AHR co-immunostaining revealed that AHR was mainly expressed in the cytoplasm of both PAX3- and PAX3+ MuSCs (Figures 6F-G, S4D). Under TCDD treatment, both subpopulations presented a nuclear localization of AHR with a higher staining intensity in the PAX3+ subpopulation (Figures 6F-G, S4D),
suggesting that activation of the AHR pathway is exacerbated after TCDD exposure in the PAX3+ subpopulation (Figures 6B, 6F-G, S4). Our data therefore demonstrate that PAX3
A
uthor Man
uscr
ipt
A
uthor Man
uscr
ipt
A
uthor Man
uscr
ipt
A
uthor Man
uscr
ipt
expression is linked with an enhanced stimulation of the AHR pathway and PAX3 function is required to protect MuSCs from the effects of TCDD exposure.
PAX3 expression controls the adaptive transition of quiescent MuSCs through the mTORC1 pathway under environmental stress.
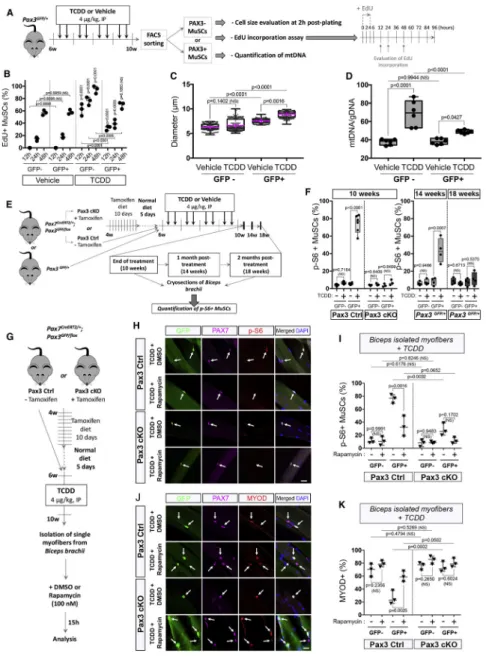
In the course of our study, we noticed that PAX3+ MuSCs treated with TCDD displayed a significantly increased cell size compared to controls (Figure S2B). To validate this observation, we quantified the size of freshly isolated PAX3+ (GFP+) and PAX3- (GFP-) MuSCs using Pax3GFP/+ mice treated with TCDD and compared to the control condition 2h post-plating. We found that PAX3+ MuSCs displayed an increased cell size compared to PAX3-MuSCs (Figures 7A-B, S2B). The cell size of PAX3+ MuSCs was further
significantly increased upon systemic TCDD treatment whereas PAX3- MuSC size remained constant (Figures 7B, S5A-D). Since we observed that TCDD exposure promotes PAX3+ cell size increase in the absence of activation or local injury disrupting the MuSC niche, we hypothesized the potential involvement of the mTORC1 pathway in the protection of PAX3+ MuSCs against environmental stress, similarly to the G0/G(alert) transition (Rodgers et al., 2014). We combined GFP and antibodies-based cell sorting to evaluate EdU incorporation after a 4h chase on freshly sorted cells. We analyzed the first division profiling of isolated PAX3+ and PAX3- MuSCs (Figures 7A-B, S5F). As previously demonstrated in activated cells (Rodgers et al., 2014), PAX3- MuSCs exposed to TCDD presented the highest EdU incorporation at 12, 24 and 48h (Figures 7B, S5F). Significant EdU incorporation was also observed in PAX3+ MuSCs following TCDD treatment compared to the control condition (Figures 7B, S5G). We then determined the ratio of mtDNA content in both MuSC
subpopulations. Compared to controls, mtDNA content strongly increased in PAX3- MuSCs under TCDD exposure, confirming their activation state whereas PAX3+ MuSCs showed lower but still significant increase in mtDNA level, suggesting the enhanced mitochondrial activity of PAX3+ MuSCs upon TCDD exposure (Figure 7D). Taken together these results suggest that PAX3+ MuSCs exposed to TCDD have different cell cycle kinetics and display features of ‘alerted’ MuSCs (Rodgers et al., 2014). We accordingly analyzed
phosphorylation of S6 ribosomal protein (p-S6), a signature of mTORC1 signaling, in PAX3+ and PAX3- MuSCs treated with TCDD in both Pax3 Ctrl and Pax3 cKO mice. In vehicle-treated MuSCs, only sporadic staining for p-S6 was observed (Figures 7E-F, S5H). Strikingly, in TCDD-treated Pax3 Ctrl mice, nearly all GFP+ MuSCs were p-S6 positive upon TCDD treatment, whereas p-S6 was not seen in GFP- MuSCs (Figures 7F, S5H). This staining was lost in Pax3 cKO mice (Figures 7F, S5H), demonstrating that TCDD exposure triggers PAX3-dependent activation of the mTORC1 pathway. We observed that the p-S6 positive staining declined by 50% in PAX3+ MuSCs one month after the end of the TCDD withdrawal and was no longer detected after two months post-treatment (Figures 7E-F). To determine whether mTORC1 signaling is mediating PAX3+ MuSCs protection against TCDD, we isolated biceps myofibers from Pax3 Ctrl and Pax3 cKO mice and used rapamycin, an mTORC1 inhibitor (Figure 7G-I). We first verified that 15h of rapamycin treatment was impairing S6 phosphorylation using GFP, PAX7 and p-S6 immunostaining (Figure 7H-I). We next assayed the myogenic status of TCDD-exposed control and Pax3 cKO MuSCs (Figure 7H-I). Importantly, we observed that PAX3+ MuSCs treated with rapamycin became sensitized to TCDD treatment and showed similar levels of MYOD
A
uthor Man
uscr
ipt
A
uthor Man
uscr
ipt
A
uthor Man
uscr
ipt
A
uthor Man
uscr
ipt
activation compared to PAX3- MuSCs (Figure 7J-K). In all experiments, PAX3 cKO MuSCs had an inactive mTORC1 pathway. Our results therefore demonstrate that PAX3 controls the adaptive response of MuSCs via the mTORC1 signaling pathway.
DISCUSSION
In contrast to PAX3- cells, PAX3+ MuSCs exposed to TCDD display cellular features previously identified in a G0 to G(alert) transition state (increase in cellular size, priming for activation, elevated mitochondrial activity). This G(alert) cell response was first reported in hindlimb muscles controlateral to the site of muscle injury (Rodgers et al., 2014). Following injury, tissue damage led to activation of circulating Hepatocyte growth factor Activator (HGFA) that catalyzes the proteolytic processing of pro-HGF into active HGF in tissues throughout the body. This signal stimulates an injury-induced transition of MuSCs into G(alert) in uninjured muscles, improving their capacity to repair damaged tissues (Rodgers et al., 2017). Our study demonstrates that TCDD reproduces the main feature of HGFA release and induces the transition of PAX3+ MuSCs into a G(alert)-like state, but without injury and by a systemic mechanism. In addition, Lee et al. also reported that HMGB1 administration enhances tissue repair via induction of the Galert response (Lee et al., 2018). Our observation leads to a conceptual questioning of the potential stress nature of the systemic signals following injury. In fact, it would be interesting to determine if other stem cell systems may show a specific response to limit the impact of environmental stress and whether PAX3 might also be regulating other forms of stress in muscle stem cells. This would be consistent with a study demonstrating that PAX3 is required for radiotolerance of MuSCs (Scaramozza et al., 2019).
Recent studies have shown that MuSC activation following dissociation is a fast (2–3h) process (van den Brink et al., 2017; Machado et al., 2017; van Velthoven et al., 2017) that also involves mTORC1 signaling (Wang et al., 2018). This is in sharp contrast to the time required for the first division (24h to 48h, see Figure 7B). Upon environmental stress, PAX3-MuSCs may have exited quiescence with a transitory increase in mTORC1 signaling, but the activation of the pathway might not be maintained when activated cells enter the myogenic program (Figure 7E-F). On the other hand, the higher resistance of PAX3+ MuSCs to an environmental stress stimulus might maintain them in this transitory mTORC1 state, associated with sustained p-S6 signal. This would be consistent with our long-term analysis demonstrating that p-S6 staining in PAX3+ MuSCs is progressively lost after TCDD withdrawal (Figure 7E-F).
We show that the impact of TCDD on PAX3- MuSCs is mediated by AHR signaling, implying a potential role of AHR in muscle stem cell physiology. Surprisingly, PAX3+ MuSCs present a higher AHR activation upon TCDD without any consequence for their number, or activation. The role of the AHR pathway has previously been evaluated in other stem cells, but bimodal responses were not reported. Exposure of mice to TCDD and prolonged activation of AHR in hematopoietic stem cells lead to an impairment in progenitor population number and quiescence (Singh et al., 2009) without stromal niche alteration. In addition, AHR was shown to modulate mitotic progression and loss of pluripotency in embryonic stem cells (Ko et al., 2016).The differential level of AHR
A
uthor Man
uscr
ipt
A
uthor Man
uscr
ipt
A
uthor Man
uscr
ipt
A
uthor Man
uscr
ipt
activation, observed in both basal and TCDD conditions, could be linked to the expression of AHRR that is significantly increased in PAX3+ MuSCs. PAX3 might therefore reduce the feedback loop regulation of the AHR pathway through the direct or indirect repression of AHRR. Our results suggest that PAX3 may thus be involved in the fine tuning of the AHR pathway output.
Heterogeneity among MuSCs has been previously shown, depending on their asymmetric self-renewal and commitment ability marked by Myf5-driven Cre activity (Kuang et al., 2007), their division rate (Chakkalakal et al., 2012) or PAX7 expression levels (Rocheteau et al., 2012). Our study reveals that the expression of the transcription factor PAX3 determines a functional heterogeneity within the MuSC pool in response to an environmental insult. We have examined the muscle-specific expression of PAX3 in MuSCs and found it conserved during aging and without significant variations between animals (data not shown), suggesting a tight control of its expression. It has been proposed that use of alternative polyA signals coupled with miRNA regulation is regulating Pax3 expression (Boutet et al., 2012). The PAX3 protein is also subjected to post-translational modifications (Boutet et al., 2007). The complex regulatory control of Pax3 expression is consistent with the importance of maintaining clonal complexity of MuSCs during aging (Tierney et al., 2018).
One can speculate that the heterogeneity of MuSCs regarding the expression of PAX3 might be linked with evolutionary pressure on PAX3 function under environmental stress. For example, maintaining the PAX3- MuSC subpopulation in hindlimb muscles, highly solicitated for locomotion and exposed to injuries, would ensure rapid regeneration of these muscles to despite the risk of compromising the self-renewal of MuSCs over time. In contrast, muscles responsible for vital functions such as respiration (trunk and diaphragm muscles) or prehension (forelimb muscles), which may be more directly in contact with pollutants, can explain the selection in these muscles of a greater PAX3+ MuSC subpopulation presenting a resistance to environmental stress.
Activation of satellite cells is the critical step in the initiation of muscle homeostasis or regeneration. It is subjected to multiple layers of tight regulation mainly mediated by various signaling pathways (Bentzinger et al., 2013) interacting with myogenic regulatory factors such as MYOD (Smith et al., 1994). After activation, MYOD is involved in proliferation of MuSCs (Megeney et al., 1996). We show that, upon TCDD exposure, PAX3- MuSCs display survival impairment, aberrant activation, proliferation and sporadic abnormal contribution to myofibers demonstrated by the presence of eMHC+ fibers. This behavior is highly unusual for an uninjured muscle without apparent damage of the stem cell niche that maintains MuSCs quiescent via Notch signaling (Bjornson et al., 2012; Mourikis et al., 2012) and local synthesis of Collagen V (Baghdadi et al., 2018). Future studies will be required to determine if TCDD exposure leads to modification of the MuSC niche or induces a cell autonomous mechanism to escape the quiescence signals from the local environment.
A
uthor Man
uscr
ipt
A
uthor Man
uscr
ipt
A
uthor Man
uscr
ipt
A
uthor Man
uscr
ipt
STAR METHODS
CONTACT FOR REAGENT AND RESOURCE SHARING
Further information and requests for resources and reagents should be directed to and will be fulfilled by the Lead Contact, Frédéric Relaix ([email protected]).
EXPERIMENTAL MODEL AND SUBJECT DETAILS
Mouse strains—Mouse lines used in this study have been described and provided by the corresponding laboratories : C57BL/6N mice (Janvier Labs®), Pax3GFP∕+ mice (Relaix et al., 2005), Pax3flox/+ (Koushik et al., 2002), Rosa26flox(stop)flox-Tomato (R26stop-Tomato) (Madisen et al., 2010), Pax7creERT2/+ mice (Murphy et al., 2011), Tg:Pax7-nGFP (Sambasivan et al., 2009) and AHRflox/flox mice (Walisser et al., 2005). Tg:MyoD-nLacZ, and
Pax3nLacZ-IRESGFP/+ mice were generated in the laboratory (see below). Animals were handled according to national and European community guidelines, and protocols were approved by the ethics committee at the French Ministry (Project No: 15–018).
Generation of Pax3nLacZ-IRES-GFP/+ mice—The Pax3 targeting construct is derived from one which was previously reported (Relaix et al, 2003). Briefly, a cassette containing a floxed Pax3 cDNA followed with an nls-LacZ-IRES-eGFP-SV40pA replaces the coding sequence of exon1. The Pax3Pax3(nLacZ-IRESeGFP) targeting vector was electroporated in CK35 ES cells. Recombinant ES cells were analysed, and two positive ES clones were injected into blastocysts to generate chimaeras. Following germline transmission and validation of the expression profile and appropriate recombination, the
Pax3Pax3(nLacZ-IRESeGFP) allele has been established and will be reported elsewhere. A male carrying the recombined allele was later crossed with a PGK-Cre female (Lallemand et al., 1998) to flox out the Pax3 cDNA and gave rise to the Pax3nLacZ-IRESeGFP/+ line.
Generation of Tg:MyoD-nLacZ mice—To generate a Tg:MyoD-nLacZ transgenic reporter line, a 227kb BAC clone from a C57BL/6J mice genomic library (Osoegawa et al., 2000) centered around the MyoD locus has been chosen (RP23–46A24 ; CHORI BACPAC resources) to carry out locus modifications using λ-red recombination (Copeland et al., 2001). Two homology arms were designed to target the start of the MyoD coding sequence in exon1, resulting in the deletion of 566bp of 5’CDS and replacement with the nls-lacZ sequence. DNA fragments were PCR-generated using the BAC DNA as template (PHUSION enzyme F-530L, Thermofischer) (5’arm pair
ATGATTCCCACTACGCATGCAAGGACAGCGC-3’,
ACTCGAGTTCCTGGGTCCAGCCTCAACCCAAGCCG-3’; 3’arm pair ACTCGAGCACTACAGTGGCGACTCAGATGC-3’,
5’-ATAACAGAGTTAGGTCTACAGGGCC-3’), then subcloned in pGEMTeasy (Promega #A3610) with a newly introduced XhoI site in-between. A
nls-LacZ-SV40pA-FRT-Kanamycin-FRT cassette was then inserted in XhoI to give the final targeting construct. The 5.7kb targeting fragment was obtained by NotI digestion followed by gel purification. The BAC RP23–46A24 DNA was purified (Nucleobond BAC100, Macherey-Nagel) and electroporated into recombineering strain SW105 (Lee et al., 2001), several transformants DNA were extracted and verified by restriction profile against the parental DNA. The
A
uthor Man
uscr
ipt
A
uthor Man
uscr
ipt
A
uthor Man
uscr
ipt
A
uthor Man
uscr
ipt
purified recombination cassette was then electroporated in one verified clone, and
recombinant resulting clones, selected on Kanamycin, were analyzed by restriction profile for proper cassette integration. One positive clone was then grown on arabinose to induce Flp recombinase expression and promote excision of the selection marker. Recombined BAC DNA was purified and diluted at 2ng/µl into microinjection buffer (10mM Tris-HCL pH 7.0.1mM EDTA, 100mM NaCl, +30mM Spermine and 70 mM Spermidine,
extemporaneously) and injected into C57Bl/6xDBA/2 pronuclei. Positive F0 clones were selected by PCR and X-Gal profile of F1 offspring.
METHOD DETAILS
Tamoxifen and TCDD treatment—To induce recombination, four week-old Pax3GFP/+; Pax7CreERT2/+; R26stop-Tomato or Pax7CreERT2/+; Pax3GFP/flox or Pax7CreERT2/+; AHRflox/flox mice were fed with a diet containing tamoxifen (Envigo) for ten consecutive days followed by 5 days of normal diet before TCDD treatment. Mice fed with normal diet were used as control. For TCDD treatment, six week-old Tg:MyoD-nLacZ or Pax3nLacZ-IRESGFP/+ or Pax3GFP/+; Pax7CreERT2/+; R26stop-Tomato or Pax7CreERT2/+ ; Pax3GFP/flox or
Pax7CreERT2/+; AHRflox/flox mutant mice and their corresponding controls without tamoxifen were intraperitoneally injected with TCDD (4μg/kg) (LGC standards), every 2 or 3 days, 2 times per week for four weeks. Control mice (vehicle) were injected at the same frequency with the equivalent volume of Nonane or (TCDD diluent) in corn oil.
Muscle enzymatic dissociation—Adult forelimb, trunk or hindlimb muscles were dissected, minced and incubated with a mix of 2.4 U/ml Dispase II (Roche) and 100 μg/ml collagenase A (Roche) in cold 4.5g/L glucose Dulbecco’s modified Eagle’s medium (DMEM, Gibco) at 37 °C for 2 h. The muscle suspension was successively filtered through 100-μm and 70-μm cell strainers (BD Biosciences) and then spun at 50g for 10 min at 4 °C to remove large tissue fragments. The supernatant was collected, filtered through a 40 μm strainer and washed twice by centrifugation at 600g for 15 min at 4 °C. The final pellet was resuspended in cold 4.5g/L glucose DMEM) supplemented with 0.2% bovine serum albumin (BSA, Sigma), and the cell suspension was used for fluorescence-activated cell sorting (FACS)-sorting, the Amnis® ImageStream® cell analysis system or the apoptosis analysis.
MuSC isolation by Flow Cytometry—MuSCs were sorted from dissociated muscles with the cell sorter BD Influx Sorp (BD Biosciences) using either the GFP (for Tg:Pax7-nGFP or Pax3GFP/+ or Pax3GFP/flox mice models) reporter or a surface labeling strategy (for Pax7creERT2/+; AHRflox∕flox and Pax7creERT2/+; Pax3GFP∕flox mice models) using anti-mouse CD45-PE-Cy7, anti-Ter119-PE-Cy7, anti-mouse CD34-BV421, anti-mouse Sca1-FITC (all from BD Biosciences) and anti-mouse integrin-α7-A700 (R&D Systems) (Stantzou et al., 2017). Gating strategy for satellite cell isolation using cell surface markers was as followed: Ter119-, CD45-, CD34+, Sca1- and gating on the cell fraction integrin-α7+. In the
Pax7creERT2/+; Pax3GFP∕flox mice the PAX3+ MuSCs were isolated based on GFP from the Ter119-, CD45-, CD34+, Sca1- and integrin-α7+ MuSCs fraction. Isolated, mononuclear cells were collected in DMEM/0.2% BSA. Sorted cells were either plated or lysed for mRNA extraction following the protocols described below.
A
uthor Man
uscr
ipt
A
uthor Man
uscr
ipt
A
uthor Man
uscr
ipt
A
uthor Man
uscr
ipt
Apoptosis assay by flow cytometry—Enzymatic dissociated muscles from Tg:Pax7-nGFP or Pax3GFP/+ mice were labeled with Pacific Blue™ Annexin V and SYTOX™ AADvanced™ dyes, according to manufacturer’s recommendations (Pacific Blue™ Annexin V/SYTOX™ AADvanced™ Apoptosis Kit, for flow cytometry, Invitrogen™). Flow cytometry was performed using The Attune® NxT Acoustic Focusing Flow Cytometer (Life Technologies). Analysis was focused on the GFP+ cell subpopulation. Gates were drawn on bivariate SYTOX/Annexin V dot plots around four distinct subpopulations: SYTOX+/Annexin V− (dead cells), SYTOX-/Annexin V+ (early apoptotic cells), SYTOX+/ Annexin V+ (late apoptotic cells) and SYTOX-/Annexin V- (living cells).
ImageStream®x system analysis of cell size—Satellite cells isolated by FACS from Tg:Pax7-nGFP or Pax3GFP/+ mice were resuspended in 1 x PBS and stained with Vybrant® DyeCycle™ Ruby cell permeable stain (Invitrogen™) for 15 min at 37°C to identified the nucleus and ensure that MuSCs were not activated by the procedure. Samples were run directly on the Amnis® ImageStream®x cytometer equipped with a hydrodynamic focusing (Amnis part of EMD Millipore, Proteigene). For each condition (vehicle and TCDD-treated PAX3+ and PAX3- MuSCs) 5000 images were acquired using the brightfield laser (for the size of MuSCs), the darkfield laser (for the Side Scatter) and the fluorescence laser (for Vybrant® DyeCycle™ Ruby and GFP). The acquired images were analyzed with IDEAS software (Amnis). First, a scatter plot of aspect ratio/area was used to gate for single cells. Second, a gradient RMS (root mean square for image sharpness) histogram was used to gate for cells in focus. Third, the intensities of GFP and Vybrant® DyeCycle™ Ruby staining was used to ensure the non-activation of MuSCs. On the remaining living, single cells in focus, image analysis was performed to determine the size of the MuSCs by generating a mask based on brightfield. This methodology was used to compare the size of PAX3- and PAX3+ MuSCs.
Satellite cell culture—Satellite cells isolated by flow cytometry were plated at 25 000 cells per cm2 on detachable 8 well-PCA treated μ-slides (Sarstedt) pre-coated with 0.2% gelatin for 30 min at 37 °C. Cells were cultured in satellite cell growth medium containing DMEM High glucose (Gibco) supplemented 20% FBS (Gibco) and primocin (100 µg/ml, Invitrogen™) at 37 °C, 5% CO2 for 2h before being fixed with 4% PFA and immunostained as described in “Immunostaining on cells, sections and myofibers”.
Muscle fixation, histological analysis and X-gal staining—For immunostaining experiments, adult tibialis anterior (TA), diaphragm, extensor digitorium longus (EDL) or biceps brachii (biceps) muscles were isolated and immediately frozen in liquid-nitrogen-cooled isopentane and sectioned transversely at 8 μm. Muscle sections were post-fixed with 4% PFA, 20 min at room temperature, washed with 1x PBS (3 times) and permeabilized for 6 minutes with cold methanol (−20°C). After 3 washes with 1x PBS, antigen retrieval was performed by incubating sections in boiling 10 mM citrate buffer pH 6 (Dako) for 3 min. After cooling down 30min at room temperature, sections were washed 3 times with 1x PBS. Sections were then blocked with 2.5% BSA (Sigma) in PBS. BSA was removed and sections were incubated 30 min with Fab antibody. After 3 washes of 1x PBS, sections were
A
uthor Man
uscr
ipt
A
uthor Man
uscr
ipt
A
uthor Man
uscr
ipt
A
uthor Man
uscr
ipt
incubated with primary and secondary antibodies as described in “Immunostaining on cells, sections and myofibers”.
For X-gal staining, isolated whole muscles from two-month Pax3nLacZ-IRES-GFP/+ mice were fixed on ice with 4% PFA for 2 h. After 3 washes with 1x PBS, the muscles were incubated in the X-Gal staining solution, using 0.4 mg/ml X-Gal (Sigma) in 2 mM MgCl2, 0.02% NP-40, 0.1 M phosphate buffer (pH 7.4), 20 mM K4Fe(CN)6 and 20 mM K3Fe(CN)6 at 37˚C for 16 h. Images were captured with a CCD camera Olympus model mounted on an binocular loupe (Leica).
Single myofiber isolation and rapamycin treatment—Single myofibers were isolated from EDL or biceps muscles following the previously described protocol (Moyle and Zammit, 2014). Briefly, both muscles were dissected and digested in a filtered solution of 0.2% collagenase (Sigma) in DMEM High Glucose /1% L-Glutamine/1% Penicillin/ Streptomycin (Gibco®) for 1h30 at 37°C. After connective tissue digestion, mechanical dissociation was performed to release individual myofibers that were then transferred to serum-coated Petri dishes for 20 min. Single myofibers were then immediately fixed in 4% PFA for 10 min (T0h). After 3 washes with 1x PBS, myofibers were stored at 4°C before immunostaining. In some experiments, freshly isolated myofibers were treated with 100 nM rapamycin (Sigma) for 15h in myofiber growth medium containing DMEM High glucose (Gibco®), 20% FBS (Gibco®) and 1% chicken embryo extract (MP-Biomedical) at 37°C, 5% CO2 and then recovered for fixation and immunostaining as described in
“Immunostaining on cells, sections and myofibers”.
Immunostaining on cells, sections and myofibers—Isolated MuSCs, muscles section or myofibers were washed three times with 1x PBS, and incubated overnight at 4°C in 2.5% BSA in 0.025% PBS-Tween20 with primary antibodies listed in Key Resources Table. Samples were washed 3 times with 0.025% PBS-Tween20 and incubated with Alexa-conjugated secondary antibodies (Life Technologies, 1/1000e) for 1 h. After washing 3 times with 1X PBS, DAPI (Sigma, 1/5000e) was added for 5 min at room temperature. Samples were washed 3 times with 1X PBS and slides were mounted with Fluoromount-G™ medium (Interchim). Confocal images were acquired with a Zeiss LSM800 confocal (Zeiss) for representative pictures and analyzed with Zen Blue 2.0 software. Counting was performed using ImageJ (version 1.47 v; National Institutes of Health, USA, https://imagej-nih-gov.gate2.inist.fr/ij/) or under the Zeiss fluorescence microscope (AxioImager D1, Zeiss). Protein extraction and immunoblots—Satellite cells were isolated by FACS from Pax7CreERT2/+; AHRfl/fl mice that were fed with tamoxifen-diet (AHR cKO) or regular diet (AHR Ctrl) for 10 days. Cell lysates were prepared with ice-cold 0.5% deoxycholate, 0.1% SDS and 1% triton in 50 mM Tris-HCl, pH7.4, 150 mM NaCl, 1 mM EDTA, 1 mM Na3VO4, and protease inhibitor cocktail (1/100e, Sigma). Lysates were then subjected to SDS-PAGE and transferred to polyvinylidene difluoride (PVDF) membranes. The
membranes were probed overnight with anti-AHR or anti-TBP primary antibody at 4°C (see Key Resources Table). Signal was detected using ECL system (Amersham Biosciences) according to the manufacturer’s instructions. Quantitative analysis was performed using ImageJ software.
A
uthor Man
uscr
ipt
A
uthor Man
uscr
ipt
A
uthor Man
uscr
ipt
A
uthor Man
uscr
ipt
RNA isolation and RT–qPCR—Total RNA was extracted from satellite cells isolated by FACS using RNAqueous™-Micro Total RNA Isolation Kit™ (Invitrogen™) and cDNA synthesis was performed using SuperScript™ VILO™ cDNA Synthesis Kit (Invitrogen™) or SuperScript™ IV VILO™ Master Mix with ezDNase™ Enzyme respectively for the experiments in Pax7CreERT2/+; AHRflox/flox and Pax7CreERT2/+ ; Pax3GFP/flox mice models according to manufacturer’s instructions. RNA quality was assessed by spectrophotometry (DeNovix DS-11 FX spectrometer). RT–PCR was performed using the Veriti® 96- Well Fast Thermal Cycler (Applied Biosystems™) and real-time qPCR was performed with the StepOnePlus real-time PCR system (Applied Biosystems™) using SYBR™ Green detection tools (Applied Biosystems™). Expression of each gene was normalized to TATA Box Protein (Tbp) and Hypoxanthine Phosphoribosyltransferase 1 (Hprt1) genes expression. Results are reported as relative gene expression (2-ΔΔCT) using vehicle treated-control mice as reference (Livak and Schmittgen, 2001). Specific forward and reverse primers used in this study are listed in Table S1.
Cell cycle kinetics—An EdU pulse (for 4h) at a final concentration of 10 µM was added to 25 000 MuSCs isolated and plated in 8 well chamber slide pre-coated with 0.2 % of PBS-gelatin. EdU incorporation was analyzed 12, 24 and 48 hours after cells plating using the Click-iT™ Plus EdU Alexa Fluor™ 647 Imaging Kit (Invitrogen™).
mtDNA quantification—Total DNA was isolated from 25 000 MuSCs immediately after FACS isolation using QIAmp DNA micro kit (Qiagen) according to the manufacturer’s instructions. Mitochondrial (mt) DNA was quantified by qRT–PCR using primers amplifying the Cytochrome B region on mtDNA (TaqMan, Mouse: Mm04225271_g1 CYTB) relative to the β-globin region on gDNA (Taqman, Mouse: Mm 01611268_g1 Hbb-b1).
QUANTIFICATION AND STATISTICAL ANALYSIS
Statistical analysis—Experiments involving mice were performed with a minimum of three to six biological replicates (as indicated in each legend of the figure) and results are presented as the mean ± S.E.M. For technical replications, six to nine cryosections were analyzed per muscle and per mice, a minimum of fifty to eighty fibers were taken for single myofibers analysis. For qPCR analysis 100 000 cells were used per conditions and per mice. All statistical analysis and graphs were performed using GraphPad Prism® Software (version 7.0). Statistical two-way ANOVA tests are detailed for each figure as below:
Figure 1C: Means ± SEM (n=5), Repeated measure (RM) two-way ANOVA. Repeated
measures: muscles per conditions. Source of variation: variable 1, treatment: p<0.0001; variable 2, type of muscle: p=0.0343; interaction p=0.0035. ANOVA was followed by Sidak’s post-test. P values between the groups (Vehicle vs. TCDD or TA vs. Biceps) in Sidak’s post-test are shown at the top of the panel (NS, not significant).
Figure 1E: Means ± SEM (n=6), RM two-way ANOVA. Repeated measure: muscles per
conditions. Source of variation: variable 1, treatment: p<0.0001; variable 2, type of muscle: p<0.0001; interaction p<0.0001. ANOVA was followed by Sidak’s post-test. P values
A
uthor Man
uscr
ipt
A
uthor Man
uscr
ipt
A
uthor Man
uscr
ipt
A
uthor Man
uscr
ipt
between the groups (Vehicle vs. TCDD or between muscles) in Sidak’s post-test are shown at the top of the panel (NS, not significant).
Figure 2G: Means ± SEM (n=6 for 10 weeks and n=4 for 18 weeks), RM two-way
ANOVA. Repeated measure: PAX3- and PAX3+ MuSCs per conditions. Source of variation: variable 1, treatment: p<0.0001 (10 weeks) p=0.0050 (18 weeks); variable 2, MuSCs subpopulation: p=0.0025 (10 weeks), p=0.0157 (18 weeks); interaction p<0.0001 (for both 10 and 18 weeks). ANOVA was followed by Sidak’s post-test. P values between the groups (Vehicle vs. TCDD) in Sidak’s post-test are shown at the top of the panel (NS, not
significant).
Figure 3C: Means ± SEM (n=4), RM two-way ANOVA. Repeated measure: PAX3- and
PAX3+ MuSCs per conditions. Source of variation: variable 1, treatment: p=0.0008 (quiescent), p=0.0016 (activated), p=0.0011 (differentiated); variable 2, MuSCs subpopulation: p=0.0079 (quiescent), p=0.0235 (activated), p=0.0011 (differentiated); interaction: p=0.0134 (quiescent), p=0.0370 (activated), p=0.0011 (differentiated). ANOVA was followed by Sidak’s post-test. P values between the groups (Vehicle vs. TCDD or between PAX3- and PAX3+ MuSC subpopulations) in Sidak’s post-test are shown at the top of the panel (NS, not significant).
Figure 3F: Means ± SEM (n=5 for 10 weeks, n=4 for both 14 and 18 weeks), RM two-way
ANOVA. Repeated measure: PAX3- and PAX3+ MuSCs per conditions. Source of variation: variable 1, treatment: p<0.0001 (10 weeks), p=0.0011 (14 weeks), p=0.0016 (18 weeks); variable 2, MuSC subpopulations: p<0.0001 (10 weeks), p=0.0011 (14 weeks), p=0.0100 (18 weeks); interaction: p<0.0001 (10 weeks), p=0.0011 (14 weeks), p=0.0016 (18 weeks). ANOVA was followed by Sidak’s post-test. P values between the groups (Vehicle vs. TCDD or between PAX3- and PAX3+ MuSC subpopulations) in Sidak’s post-test are shown at the top of the panel (NS, not significant).
Figure 4D: Means ± SEM (n=4), RM two-way ANOVA. Repeated measure: muscles per
conditions. Source of variation: variable 1, treatment: p<0.0001; variable 2, Muscle: p=0.0256; interaction: p=0.0161. ANOVA was followed by Sidak’s post-test. P values between the groups (Vehicle vs. TCDD or between muscles) in Sidak’s post-test are shown at the top of the panel (NS, not significant).
Figure 4E: Means ± SEM (n=4), RM two-way ANOVA. Repeated measure: muscles per
conditions. Source of variation: variable 1, treatment: p<0.0001; variable 2, Muscle: p=0.0256; interaction: p=0.0161. ANOVA was followed by Sidak’s post-test. P values between the groups (Vehicle vs. TCDD or between muscles) in Sidak’s post-test are shown at the top of the panel (NS, not significant).
Figure 4F: Means ± SEM (n=4), RM two-way ANOVA. Repeated measure: muscles per
conditions. Source of variation: variable 1, treatment: p=0.0002; variable 2, Muscle: p=0.0301; interaction: p=0.0124. ANOVA was followed by Sidak’s post-test. P values between the groups (Vehicle vs. TCDD or between muscles) in Sidak’s post-test are shown at the top of the panel (NS, not significant).
A
uthor Man
uscr
ipt
A
uthor Man
uscr
ipt
A
uthor Man
uscr
ipt
A
uthor Man
uscr
ipt
Figure 4I: Means ± SEM (n=4), RM two-way ANOVA. Repeated measure: MuSCs
subpopulation per conditions. Source of variation: variable 1, treatment: p=0.0021; variable 2, MuSCs subpopulation: p=0.0004; interaction: p=0.0021. ANOVA was followed by Sidak’s post-test. P values between the groups (Vehicle vs. TCDD or between PAX3- and PAX3+ MuSC subpopulations) in Sidak’s post-test are shown at the top of the panel (NS, not significant).
Figure 4J: Means ± SEM (n=4), RM two-way ANOVA. Repeated measure: MuSCs
subpopulation per conditions. Source of variation: variable 1, treatment: p=0.0247; variable 2, MuSCs subpopulation: p=0.0018; interaction: p=0.0368. ANOVA was followed by Sidak’s post-test. P values between the groups (Vehicle vs. TCDD or between PAX3- and PAX3+ MuSC subpopulations) in Sidak’s post-test are shown at the top of the panel (NS, not significant).
Figure 4L: Means ± SEM (n=6 for 10 weeks and n=4 for 14 and 18 weeks), RM two-way
ANOVA. Repeated measure: muscle per condition. Source of variation: variable 1, treatment: p<0.0001 (10 weeks), p=0.0009 (14 weeks), p=0.0005 (18 weeks); variable 2, muscle: p=0.0244 (10 weeks), p=0.0016 (14 weeks), p=0.1564 (18 weeks); interaction: p=0.0878 (10 weeks), p=0.0024 (14 weeks), p=0.0411 (18 weeks). ANOVA was followed by Sidak’s post-test. P values between the groups (Vehicle vs. TCDD or between muscles) in Sidak’s post-test are shown at the top of the panel (NS, not significant).
Figures 5B and S3D: Means ± SEM (n=4), ordinary two-way ANOVA, groups: AHR Ctrl
vehicle vs AHR Ctrl TCDD vs AHR cKO vehicle vs AHR cKO TCDD. ANOVAs results are detailed below:
Cyp1a1: Source of variation: variable 1, treatment: p<0.0001; variable 2, genotype: p=0.0033; interaction: p=0.0047.
AHRR: Source of variation: variable 1, treatment: p<0.0001; variable 2, genotype: p<0.0001; interaction: p<0.0001.
Pax3: Source of variation: variable 1, treatment: p=0.0006; variable 2, genotype: p=0.0358; interaction: p=0.0304.
MyoD: Source of variation: variable 1, treatment: p=0.0138; variable 2, genotype: p=0.1065; interaction: p=0.0288.
Nqo1: Source of variation: variable 1, treatment: p=0.0002; variable 2, genotype: p=0.0757; interaction: p=0.5932.
Cyp1a2: Source of variation: variable 1, treatment: p<0.0001; variable 2, genotype: p=0.0003; interaction: p=0.0001.
Cyp1b1: Source of variation: variable 1, treatment: p=0.0319; variable 2, genotype: p=0.1474; interaction: p=0.0496.
A
uthor Man
uscr
ipt
A
uthor Man
uscr
ipt
A
uthor Man
uscr
ipt
A
uthor Man
uscr
ipt
ANOVA was followed by Sidak’s post-test. P values between the groups (Vehicle vs. TCDD or between Ctrl vs. cKO) in Sidak’s post-test are shown at the top of the panel (NS, not significant).
Figure 5D: Means ± SEM (n=4), ordinary two-way ANOVA, groups: AHR Ctrl vehicle vs AHR Ctrl TCDD vs AHR cKO vehicle vs AHR cKO TCDD. ANOVAs results are detailed below:
PAX7+/MYOD-/Ki67-: Source of variation: variable 1, treatment: p<0.0001; variable 2, genotype: p=0.0006; interaction: p=0.0020.
PAX7+/MYOD+/Ki67-: Source of variation: variable 1, treatment: p<0.0001; variable 2, genotype: p=0.0025; interaction: p=0.0051.
PAX7+/MYOD+/Ki67+: Source of variation: variable 1, treatment: p<0.0001; variable 2, genotype: p=0.0041; interaction: p=0.0272.
ANOVAs were followed by Sidak’s post-test. P values between the groups (Vehicle vs. TCDD or between Ctrl vs. cKO) in Sidak’s post-test are shown at the top of the panel (NS, not significant).
Figure S3G: Means ± SEM (n=4), ordinary two-way ANOVA, groups: AHR Ctrl vehicle vs AHR Ctrl TCDD vs AHR cKO vehicle vs AHR cKO TCDD. ANOVAs results are detailed below:
PAX7+/MYOD-/Ki67-: Source of variation: variable 1, treatment: p<0.0001; variable 2, genotype: p<0.0001; interaction: p<0.0001.
PAX7+/MYOD+/Ki67-: Source of variation: variable 1, treatment: p<0.0001; variable 2, genotype: p<0.0001; interaction: p=0.0002.
PAX7+/MYOD+/Ki67+: Source of variation: variable 1, treatment: p=0.0003; variable 2, genotype: p=0.0003; interaction: p=0.0003.
ANOVAs were followed by Sidak’s post-test. P values between the groups (Vehicle vs. TCDD or between Ctrl vs. cKO) in Sidak’s post-test are shown at the top of the panel (NS, not significant).
Figures 6B and S4B: Means ± SEM (n=3), repeated measure (RM) two-way ANOVA,
groups: GFP- vehicle vs GFP- TCDD vs GFP+ vehicle vs GFP+ TCDD. ANOVAs were performed in each mice genotype (Pax3 Ctrl or Pax3 cKO). Repeated measure: PAX3- and PAX3+ MuSC subpopulations per conditions. ANOVAs results are detailed below:
Pax3 Ctrl, Pax3: Source of variation: variable 1, treatment: p=0.3888; variable 2, PAX3- and PAX3+ MuSC subpopulations: p=0.0021; interaction: p=0.2372.
Pax3 cKO, Pax3: Source of variation: variable 1, treatment: p=0.4859; variable 2, PAX3-and PAX3+ MuSC subpopulations: p=0.5565; interaction: p=0.6981.
A
uthor Man
uscr
ipt
A
uthor Man
uscr
ipt
A
uthor Man
uscr
ipt
A
uthor Man
uscr
ipt
Pax3 Ctrl, Cyp1a1: Source of variation: variable 1, treatment: p=0.0032; variable 2, PAX3-and PAX3+ MuSC subpopulations: p=0.0348; interaction: p=0.0451.
Pax3 cKO, Cyp1a1: Source of variation: variable 1, treatment: p=0.0052; variable 2, PAX3-and PAX3+ MuSC subpopulations: p=0.7648; interaction: p=0.7217.
Pax3 Ctrl, MyoD: Source of variation: variable 1, treatment: p=0.1127; variable 2, PAX3-and PAX3+ MuSC subpopulations: p=0.0372; interaction: p=0.0350.
Pax3 cKO, MyoD: Source of variation: variable 1, treatment: p=0.0048; variable 2, PAX3-and PAX3+ MuSC subpopulations: p=0.0264; interaction: p=0.5127.
- Pax3 Ctrl, AHRR: Source of variation: variable 1, treatment: p=0.0079; variable 2, PAX3-and PAX3+ MuSC subpopulations: p=0.0065; interaction: p=0.0065.
- Pax3 cKO, AHRR: Source of variation: variable 1, treatment: p=0.0084; variable 2, PAX3-and PAX3+ MuSC subpopulations: p=0.5147; interaction: p=0.3245.
- Pax3 Ctrl, Nqo1: Source of variation: variable 1, treatment: p=0.0003; variable 2, PAX3-and PAX3+ MuSC subpopulations: p=0.2348; interaction: p=0.0629.
- Pax3 cKO, Nqo1: Source of variation: variable 1, treatment: p=0.0134; variable 2, PAX3-and PAX3+ MuSC subpopulations: p=0.7403; interaction: p=0.8276.
- Pax3 Ctrl, Cyp1a2: Source of variation: variable 1, treatment: p=0.0009; variable 2, PAX3-and PAX3+ MuSC subpopulations: p=0.1051; interaction: p=0.1035.
- Pax3 cKO, Cyp1a2: Source of variation: variable 1, treatment: p=0.0006; variable 2, PAX3-and PAX3+ MuSC subpopulations: p=0.8030; interaction: p=0.8061.
- Pax3 Ctrl, Cyp1b1: Source of variation: variable 1, treatment: p=0.0001; variable 2, PAX3-and PAX3+ MuSC subpopulations: p=0.1902; interaction: p=0.0071.
- Pax3 cKO, Cyp1b1: Source of variation: variable 1, treatment: p=0.0108; variable 2, PAX3-and PAX3+ MuSC subpopulations: p=0.6482; interaction: p=0.0901.
ANOVA was followed by Sidak’s post-test. P values between the groups (Vehicle vs. TCDD or between PAX3- and PAX3+ MuSC subpopulations) in Sidak’s post-test are shown at the top of the panel (NS, not significant).
Figure 6D: Means ± SEM (n=3), repeated measure (RM) two-way ANOVA, groups:
GFP-vehicle vs GFP- TCDD vs GFP+ GFP-vehicle vs GFP+ TCDD. ANOVAs were performed in each mice genotype (Pax3 Ctrl or Pax3 cKO) for each myogenic status (PAX7+/MYOD- or PAX7+/MYOD+). Repeated measure: PAX3- and PAX3+ MuSC subpopulations per conditions. ANOVAs results are detailed below:
Pax3 Ctrl, PAX7+/MYOD-: Source of variation: variable 1, treatment: p=0.0020; variable 2, PAX3- and PAX3+ MuSC subpopulations: p=0.0102; interaction: p=0.0041.
A
uthor Man
uscr
ipt
A
uthor Man
uscr
ipt
A
uthor Man
uscr
ipt
A
uthor Man
uscr
ipt
Pax3 Ctrl, PAX7+/MYOD+: Source of variation: variable 1, treatment: p=0.0020; variable 2, PAX3- and PAX3+ MuSC subpopulations: p=0.0102; interaction: p=0.0041.
Pax3 cKO, PAX7+/MYOD-: Source of variation: variable 1, treatment: p=0.0002; variable 2, PAX3- and PAX3+ MuSC subpopulations: p=0.1280; interaction: p=0.7235.
Pax3 cKO, PAX7+/MYOD+: Source of variation: variable 1, treatment: p=0.0002; variable 2, PAX3- and PAX3+ MuSC subpopulations: p=0.1280; interaction: p=0.7235.
ANOVA was followed by Sidak’s post-test. P values between the groups (Vehicle vs. TCDD or between PAX3- and PAX3+ MuSC subpopulations) in Sidak’s post-test are shown at the top of the panel (NS, not significant).
Figure 6G: Means ± SEM (n=5), repeated measure (RM) two-way ANOVA, groups:
GFP-vehicle vs GFP- TCDD vs GFP+ GFP-vehicle vs GFP+ TCDD. ANOVAs were performed for each localization of AHR (cytoplasmic, both or nuclear). Repeated measure: PAX3- and PAX3+ MuSC subpopulations per conditions. ANOVAs results are detailed below:
Cytoplasmic: Source of variation: variable 1, treatment: p<0.0001; variable 2, PAX3- and PAX3+ MuSC subpopulations: p<0.0001; interaction: p<0.0001.
Both cytoplasmic and nuclear: Source of variation: variable 1, treatment: p=0.0038; variable 2, PAX3- and PAX3+ MuSC subpopulations: p=0.0077; interaction: p<0.0001.
Nuclear: Source of variation: variable 1, treatment: p<0.0001; variable 2, PAX3- and PAX3+ MuSC subpopulations: p=0.0014; interaction: p=0.0003.
ANOVA was followed by Sidak’s post-test. P values between the groups (Vehicle vs. TCDD or between PAX3- and PAX3+ MuSC subpopulations) in Sidak’s post-test are shown at the top of the panel (NS, not significant).
Figure 7B: Means ± SEM (n=3 mice and 100 cells per mice), repeated measure (RM)
two-way ANOVA, groups: GFP- vehicle vs GFP- TCDD vs GFP+ vehicle vs GFP+ TCDD. Repeated measure: PAX3- and PAX3+ MuSC subpopulations per conditions. Source of variation: variable 1, treatment: p=0.0012; variable 2, MuSC subpopulations: p<0.0001; interaction: p=0.0092. ANOVA was followed by Sidak’s post-test. P values between the groups (Vehicle vs. TCDD or between PAX3- and PAX3+ MuSC subpopulations) in Sidak’s post-test are shown at the top of the panel (NS, not significant).
Figure 7C: Means ± SEM (n=3), repeated measure (RM) two-way ANOVA, groups:
GFP-vehicle vs GFP- TCDD vs GFP+ GFP-vehicle vs GFP+ TCDD. Repeated measure: PAX3- and PAX3+ MuSC subpopulations per conditions. Source of variation: variable 1, time:
p<0.0001; variable 2, MuSC subpopulations: p<0.0001; interaction: p=0.0016. ANOVA was followed by Sidak’s post-test. For each time, P values between the groups (Vehicle vs. TCDD or between PAX3- and PAX3+ MuSC subpopulations) in Sidak’s post-test are shown at the top of the panel (NS, not significant).
A
uthor Man
uscr
ipt
A
uthor Man
uscr
ipt
A
uthor Man
uscr
ipt
A
uthor Man
uscr
ipt
Figure 7D: Means ± SEM (n=6), repeated measure (RM) two-way ANOVA, groups:
GFP-vehicle vs GFP- TCDD vs GFP+ GFP-vehicle vs GFP+ TCDD. Repeated measure: PAX3- and PAX3+ MuSC subpopulations per conditions. Source of variation: variable 1, treatment: p<0.0001; variable 2, MuSC subpopulations: p=0.0140; interaction: p=0.0045. ANOVA was followed by Sidak’s post-test. P values between the groups (Vehicle vs. TCDD or between PAX3- and PAX3+ MuSC subpopulations) in Sidak’s post-test are shown at the top of the panel (NS, not significant).
Figure 7F: Means ± SEM (n=6 for Pax3 Ctrl at 10 weeks, n=3 for Pax3 cKO at 10 weeks,
n=4 for Pax3GFP/+ at 14 and 18 weeks), repeated measure (RM) two-way ANOVA, groups: GFP-vehicle vs GFP- TCDD vs GFP+ vehicle vs GFP+ TCDD. ANOVAs were performed in each mice genotype (Pax3 Ctrl, Pax3 cKO or Pax3GFP/+) for each time (10, 14 or 18 weeks). Repeated measure: PAX3- and PAX3+ MuSC subpopulations per conditions. ANOVAs results are detailed below:
Pax3 Ctrl, 10 weeks: Source of variation: variable 1, treatment: p<0.0001; variable 2, PAX3- and PAX3+ MuSC subpopulations: p<0.0001; interaction: p<0.0001.
Pax3 cKO, 10 weeks: Source of variation: variable 1, treatment: p= 0.2548; variable 2, PAX3- and PAX3+ MuSC subpopulations: p=0.8639; interaction: p>0.9999.
Pax3GFP/+, 14 weeks: Source of variation: variable 1, treatment: p=0.0018; variable 2, PAX3- and PAX3+ MuSC subpopulations: p=0.0030; interaction: p=0.0027.
Pax3GFP/+, 18 weeks: Source of variation: variable 1, treatment: p=0.8748; variable 2, PAX3- and PAX3+ MuSC subpopulations: p=0.4126; interaction: p=0.2197.
ANOVA was followed by Sidak’s post-test. P values between the groups (Vehicle vs. TCDD or between PAX3- and PAX3+ MuSC subpopulations) in Sidak’s post-test are shown at the top of the panel (NS, not significant).
Figure 7I: Means ± SEM (n=3), repeated measure (RM) two-way ANOVA, groups: Pax3
Ctrl DMSO vs Pax3 Ctrl Rapamycin vs Pax3 cKO DMSO vs Pax3 cKO Rapamycin. Repeated measure: treatment per genotype. ANOVAs were performed in each MuSC subpopulations and results are detailed below:
GFP-: Source of variation: variable 1, treatment: p=0.8758; variable 2, genotype: p=0.3261; interaction: p=0.8001.
GFP+: Source of variation: variable 1, treatment: p=0.0130; variable 2, genotype: p=0.0015; interaction: p=0.0390.
ANOVA was followed by Sidak’s post-test. P values between the groups (Ctrl vs. cKO or between DMSO and Rapamycin) in Sidak’s post-test are shown at the top of the panel (NS, not significant).
Figure 7K: Means ± SEM (n=3), repeated measure (RM) two-way ANOVA, groups: Pax3
Ctrl DMSO vs Pax3 Ctrl Rapamycin vs Pax3 cKO DMSO vs Pax3 cKO Rapamycin.
A
uthor Man
uscr
ipt
A
uthor Man
uscr
ipt
A
uthor Man
uscr
ipt
A
uthor Man
uscr
ipt
Repeated measure: treatment per genotype. ANOVAs were performed in each MuSC subpopulations and results are detailed below:
GFP-: Source of variation: variable 1, treatment: p=0.8758; variable 2, genotype: p=0.3261; interaction: p=0.8001.
GFP+: Source of variation: variable 1, treatment: p=0.0341; variable 2, genotype: p=0.0002; interaction: p=0.0078.
ANOVA was followed by Sidak’s post-test. P values between the groups (Ctrl vs. cKO or between DMSO and Rapamycin) in Sidak’s post-test are shown at the top of the panel (NS, not significant).
ANOVA was followed by Sidak’s post-test. P values between the groups (Ctrl vs. cKO or between DMSO and Rapamycin) in Sidak’s post-test are shown at the top of the panel (NS, not significant).
Figure S2C: Means ± SEM (n=4), RM two-way ANOVA. Repeat measure: PAX3- and
PAX3+ MuSCs per conditions. Source of variation: variable 1, treatment: p<0.0001 (MYOD-/MYOG-, MYOD+/MYOG-), p=0.0031 (MYOD+/MYOG+), p=0.0001 (MYOD-/ MYOG+); variable 2, MuSCs subpopulation: p<0.0001 (MYOD-/MYOG-, MYOD+/ MYOG-), p=0.0010 (MYOD+/MYOG+), p=0.0001 (MYOD-/MYOG+); interaction: p<0.0001 (MYOD-/MYOG-, MYOD+/MYOG-), p=0.0031 (MYOD+/MYOG+), p=0.0001 (MYOD-/MYOG+). ANOVA was followed by Sidak’s post-test. P values between the groups (Vehicle vs. TCDD or between PAX3- and PAX3+ MuSC subpopulations) in Sidak’s post-test are shown at the top of the panel (NS, not significant).
Figure S3G: Means ± SEM (n=4), one-way ANOVA Krustal-Wallis test, groups: AHR Ctrl
+ vehicle vs AHR Ctrl + TCDD vs AHR cKO + vehicle vs AHR cKO + TCDD. ANOVAs were performed in each myogenic status (PAX7+/MYOD-, PAX7+/MYOD+ or PAX7-/ MYOD+) between the groups. For PAX7+/MYOD- and PAX7+/MYOD+: p<0.0001, PAX7-/MYOD+: p=0.0022. ANOVAs were followed by Dunn’s post-tests. P values between the groups in Dunn’s post-tests are shown at the top of the panel (NS, not significant).
Figure S5C: Means ± SEM (n=5000 cells per condition), ordinary two-way ANOVA,
groups: PAX3- vehicle vs PAX3- TCDD vs PAX3+ vehicle vs PAX3+ TCDD. Source of variation: variable 1, treatment: p=0.0025; variable 2, MuSC subpopulations: p<0.0001; interaction: p<0.0001. ANOVA was followed by Sidak’s post-test. P values between the groups (Vehicle vs. TCDD or between PAX3- and PAX3+ MuSC subpopulations) in Sidak’s post-test are shown at the top of the panel (NS, not significant).
Supplementary Material
Refer to Web version on PubMed Central for supplementary material.