HAL Id: cea-02491659
https://hal-cea.archives-ouvertes.fr/cea-02491659
Submitted on 26 Feb 2020HAL is a multi-disciplinary open access archive for the deposit and dissemination of sci-entific research documents, whether they are pub-lished or not. The documents may come from teaching and research institutions in France or abroad, or from public or private research centers.
L’archive ouverte pluridisciplinaire HAL, est destinée au dépôt et à la diffusion de documents scientifiques de niveau recherche, publiés ou non, émanant des établissements d’enseignement et de recherche français ou étrangers, des laboratoires publics ou privés.
Circee v1 - A versatile tool for criticality accident dose
assesment
Michael Laget
To cite this version:
Michael Laget. Circee v1 A versatile tool for criticality accident dose assesment. ICNC 2015 -International Conference on Nuclear Criticality Safety, Sep 2015, Charlotte, United States. �cea-02491659�
CIRCEE v1 – A VERSATILE TOOL FOR CRITICALITY ACCIDENT
DOSE ASSESMENT
Michael LAGET
CEA Saclay, DEN, DM2S, SERMA, CP2C F-91191 Gif-sur-Yvette, France.
ABSTRACT
CIRCEE is a calculation code developed by the French Atomic Energy Commission (CEA), allowing fast assessment of operational dose over complex geometries. It is used to assess dosimetric consequences of a criticality accident. More specifically, it can be used both during the preliminary studies phase (isodoses curves for safety report preparation or emergency preparedness, CAAS implantation and validation…) and during crisis management (effective dose estimation, emergency response).
An early development stage of CIRCEE has been presented in a talk at the 2009 NCSD edition [1]. Since then, a heavy code rewriting increased its reliability and maintainability while keeping its performance at an excellent level. Now in a stable production version, and following the grant of several international patents, it’s aiming to short term availability for the industry.
KEYWORDS Criticality accident, CAAS, Isodoses, dosimetry
1. INTRODUCTION
Following the criticality accident in Tokai Mura in 1999, the French Atomic Energy Commission (CEA) undertook to provide isodoses maps for each of its facilities in which a high criticality accident risk is identified. These maps are used to plan emergency response and evacuation paths, determine gathering and evacuation points, implant criticality accident alarm system (CAAS) probes, and finally, in the context of crisis management, to locate the accident and determine the best conditions for a swift intervention in order to either save lives or interrupt the accident.
Thus, as foreseen, automating the creation of these maps by a simplified tool would be a great improvement over the other existing options:
- manual creation (from abacus or calculations): inaccurate, time consuming and error-prone - from Monte Carlo calculation: high modelling and calculation costs (time, CPU).
As this tool aimed at being used also for the realization of studies and crisis management, it needed to be fast (dose mapping within whole facilities should be done in minutes) and reliable (most accurate dose estimation).
These were the first specifications of CIRCEE (Calculation of Isodose maps in case of a Risk of Criticality, in Evolving Environments), which relies on straight line attenuation approximation for the “transport” of neutrons and photons, enhanced by corrections resulting in doses closer to reality. For increased speed, it uses tabulated data for source terms and attenuation factors obtained from preliminary calculations.
CIRCEE is a console application running on Linux and Windows (x86 and amd64) systems, written in C++. It should be available under commercial license terms in a near future.
2. CODE DESCRIPTION 2.1. Dose Calculation Principle
The straight line attenuation results in quick estimates of doses at any distance, given any screening of the source. The way it is implemented in CIRCEE is the following:
𝑑𝑜𝑠𝑒 = 𝑆𝑜𝑢𝑟𝑐𝑒 × 1
𝑑2× ∏ 𝑎𝑡𝑡𝑒𝑛𝑢𝑎𝑡𝑖𝑜𝑛
Where:
- 𝑆𝑜𝑢𝑟𝑐𝑒 is a source term, in correct unit, for the specified source; in CIRCEE, this term is tabulated.
- 𝑑12 represents the purely geometric attenuation due to the distance 𝑑 from the source
- And 𝑎𝑡𝑡𝑒𝑛𝑢𝑎𝑡𝑖𝑜𝑛 represents the attenuation factor due to each screen between the source and the calculation point. In CIRCEE, these attenuation factors are tabulated.
As this approach is only 1-dimensional, it cannot model any diffusion other than along the straight-line; dose estimates are accurate only as long as the main part of the dose is direct, not diffused. In order to give a better dose estimate, the following corrections are taken into account:
- If a calculation point is placed between two screens, a “reflection factor” is applied, its value depending on the screen closer to the source width;
- If the incidence angle on a screen is not normal, a correction on the screen geometric width is used to take into account the diffusion inside the screen.
It must be noted that these corrections address only partially the diffusion problem of the model. 2.2. Tabulated Data
CIRCEE uses tabulated data obtained from calculation made with the one-dimensional code SN1D [2]. For a given set of sources, doses and doses equivalent [3, 4] were calculated for various screen natures and widths and for the following contributions:
- Fission neutrons, - Fission γ,
- Secondary γ (mainly from (n,γ)).
These calculations were done using the coupled neutron-γ library (175+36 groups) extracted from ENDF/B6.
Sources are either:
- Punctual: no auto-attenuation, unmoderated spectrum
- Volume: constituted of water, moderation of the spectrum varying with the volume (from 1 to 1000 L).
The number of neutrons per fission of the source can be set to the thermal fission ν of 235U or 239Pu. Screens included in the library are:
- Ordinary concrete, d=2.287
- Heavy concrete (magnetite), d=3.30 - Colemanite concrete, d=1.88
- Steel (pure iron), d=7.89 - Antimonial lead (4%), d=10.9
The considered widths range from 5 cm to 200 cm for concretes, and from 0.6 cm to 1 m for metals. The compositions are extracted from [5]. In order to account for spectrum variation after a first screen, a set of 16 variable-width 2-screens calculations have also been included in the tabulated data.
Even if this set of material and sources might be considered small, it allows one to model a large spectrum of the configurations met in a facility. Absent materials might for instance be compared to the most similar of the library, and depending on conclusions and safety concerns (under or over estimation might be more favorable):
- either assimilated to one of those,
- or a rule of proportionality can be defined, and an equivalent width estimated by comparing doses and spectra.
For instance, the attenuation factors of leaded glass and generic soil have recently been made available in CIRCEE in this way.
For efficiency, these tabulated data are stored as Lagrange polynomials. Around 150,000 calculations are used in the current version of CIRCEE.
2.3. Geometric Data Input
CIRCEE allows importing “as-built” geometric models from CAD software through the use of SALOME© [6], so that the same model used for the needs of the facility exploitation can be used in CIRCEE with minimum time investment and modifications to the model.
Model files can also be created from scratch and edited manually, an approach useful to create simple models or to correct anomalies within imported models.
The base element of CIRCEE’s geometric models is the box, syntactically described by: $𝑏𝑜𝑥 𝑛𝑎𝑚𝑒 𝑥𝑚𝑖𝑛𝑥𝑚𝑎𝑥 𝑦𝑚𝑖𝑛𝑦𝑚𝑎𝑥 𝑧𝑚𝑖𝑛𝑧𝑚𝑎𝑥 𝑚𝑎𝑡𝑒𝑟𝑖𝑎𝑙
As CIRCEE does not focus on the modelling of process equipment, but rather on structures or heavy equipment such as shielded hot cells, no basic volume element other than the box has been implemented. When an object that cannot be described by boxes only (such as a curved wall) is encountered, it must be approximated (by splitting) or neglected.
2.4. Isodoses Calculation Routine
CIRCEE allows calculation of isodoses maps in any plane perpendicular to one of the directions used to describe the geometric model (𝑥, 𝑦, or 𝑧), the “view plane”.
Space is segmented along lines running from the source projection on the view plane, and towards each remarkable element of the geometry (limits between volumes, intersection of volume with the view plane, angles). Each of these lines defines a plane perpendicular to the view plane, inside of which the dose calculation then takes place: for each remarkable angle, a dose calculation as described in §2 is performed. Finally, each dose limit specified in the input file is then searched between the limits found in the previous phase, using dichotomy to refine its position until an adjustable convergence criterion is met. This procedure is repeated until the whole perimeter of the source is explored, and the isodoses map is then drawn by joining every limit position found.
2.5. CAAS Probe Coverage Calculation Routine
At least one dose or dose rate limit is attributed to each CAAS probe; when its limits are exceeded, the probe goes off into alert state, and when at least two probes are in alert, an alarm is triggered.
CIRCEE allows validating the surface coverage of a probe or a set of probes given the corresponding dose(-rate) limits and a postulated minimal accident.
The calculation is then done exactly as with isodoses, given the fact that the probe is considered as a source, and only one dose limit is searched for each limit attributed to the probe. In order to ease the analysis, the global coverage of a set of probes can be calculated in a single shot and drawn out on a single output map.
2.6. Example Results and Performance
Here-below is illustrated an example of calculation carried out on a realistic geometry (5000 m² facility), which takes around 30 seconds on a single core of an INTEL Core i7-2600 processor, with a resolution of 0.5° and 4 dose limits.
Figure 1 b) presents the result of a CAAS coverage calculation including 2 probes having a 2 alert threshold each; the grayed area is where the specified minimal accident would trigger the alarm.
a) b)
Figure 1 – a) Sample isodoses map calculation results. b) Sample CAAS coverage calculation results
3. ELEMENTS OF VALIDATION
CIRCEE has been validated against TRIPOLI-4® [7], the CEA reference continuous energy Monte Carlo code for the transport of neutral and charged particles, on several simplified geometries, each designed to test a given aspect of CIRCEE. The library used for TRIPOLI-4 is CEAv5.1.1 [7].
The source, emitting 5 1016 fissions/s, is modelled as a 10 liters plain water sphere for CIRCEE, and for TRIPOLI-4 as a sphere containing 820 g 235U metal, homogeneously moderated by 10 liters of water.
3.1. Ordinary Concrete Attenuation Factor
The configuration depicted in the following figure has been used to test the ordinary concrete attenuation factor; the walls are of variable width.
Figure 2 – Ordinary concrete attenuation factor test configuration
The comparison results are presented in the following tables and figures
Table I. Comparison between CIRCEE and TRIPOLI-4 equivalent doses (mSv/h) for several distances to source and screen widths (Figure 2 configuration)
Distance (m)
Screen width (cm)
50 cm 100 cm 200 cm
TRIPOLI CIRCEE C/T TRIPOLI CIRCEE C/T TRIPOLI CIRCEE C/T
Neu tr o n s 4 1.31 106 1.04 106 0.79 2.97 104 2.16 104 0.73 1.86 101 1.03 101 0.55 7 3.32 105 3.38 105 1.02 6.75 103 7.05 103 1.04 3.26 100 3.35 100 1.03 10 1.43 105 1.66 105 1.16 2.77 103 3.46 103 1.25 1.21 100 1.64 100 1.36 12 9.42 104 1.15 105 1.22 1.79 103 2.40 103 1.34 7.54 10-1 1.14 100 1.51 γ 4 2.46 105 2.26 105 0.92 1.94 104 1.62 104 0.84 6.64 101 6.31 101 0.95 7 6.60 104 7.40 104 1.12 5 10 103 5.29 103 1.04 1.81 101 2.06 101 1.14 10 2.95 104 3.62 104 1.23 2.22 103 2.59 103 1.17 7.84 100 1.01 101 1.29 12 1.96 104 2.52 104 1.28 1.46 103 1.80 103 1.23 5.04 100 7.01 100 1.39 to tal 4 1.55 106 1.26 106 0.81 4.91 104 3.78 104 0.77 8.51 101 7.34 101 0.86 7 3.98 105 4.12 105 1.04 1.19 104 1.23 104 1.04 2.14 101 2.40 101 1.12 10 1.73 105 2.02 105 1.17 4.99 103 6.05 103 1.21 9.04 100 1.17 101 1.30 12 1.14 105 1.40 105 1.23 3.26 103 4.20 103 1.29 5.80 100 8.15 100 1.41
Dose estimates given by CIRCEE do not deviate from TRIPOLI-4 estimates by more than a factor of 2. The underestimation occurs only closer to the source. An increase (toward overestimation) occurring as distance increases is noted, demonstrating that the finite size of the cell is not taken into account thus nor is the indirect contribution to the dose; as the distance to the source increases, the direct contribution increases, and this underestimation factor contributes to a lesser extent.
The variation of dose ratio with screen width is moderate, showing slightly higher values for higher screen width.
3.2. Reflection Correction
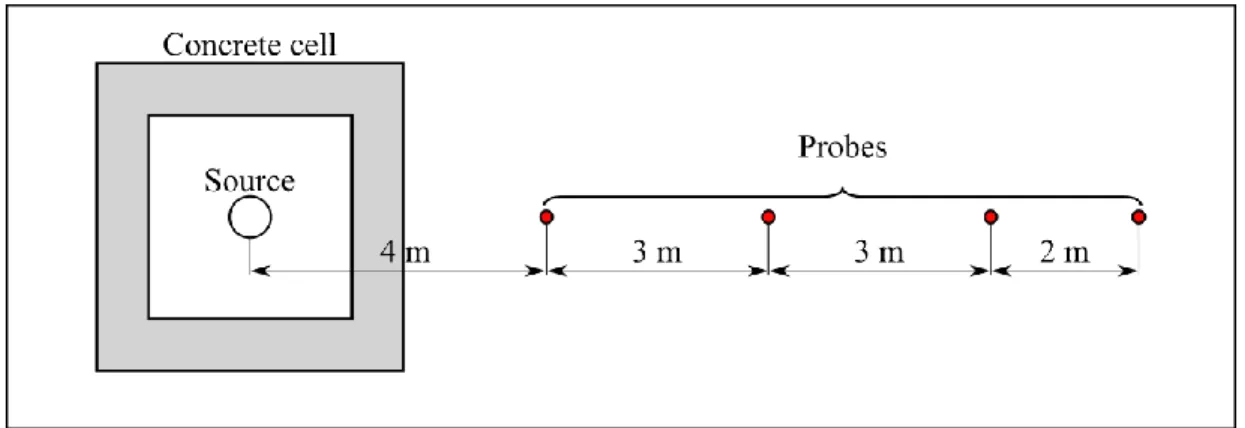
The configuration depicted in the following figure has been applied to test reflection correction used to correct dose estimates inside rooms or buildings. The walls are of variable width, but the width of the “reflecting cell” is constant (30 cm). To evaluate the extent of the correction, the calculation results are compared to those of the configuration presented in §3.1.
Figure 3 – Reflection correction test configuration
Table II. Comparison between CIRCEE and TRIPOLI-4 equivalent doses (mSv/h) for several distances to source and screen widths (Figure 3 configuration)
Distance (m)
Screen width (cm)
50 cm 100 cm 200 cm
TRIPOLI CIRCEE C/T TRIPOLI CIRCEE C/T TRIPOLI CIRCEE C/T
Neut ro ns 4 2.34 10 6 1.85 106 0.79 4.18 104 3.83 104 0.92 2.24 101 1.71 101 0.76 7 7.31 105 6.04 105 0.83 1.40 104 1.25 104 0.89 5.93 100 5.58 100 0.94 10 3.62 105 2.96 105 0.82 7.67 103 6.12 103 0.80 3.09 100 2.73 100 0.89 12 1.55 104 1.13 104 0.73 3.78 102 2.37 102 0.63 1.68 10-1 1.14 100 6.81 γ 4 3.37 105 3.11 105 0.92 2.12 104 1.99 104 0.94 6.99 101 6.45 101 0.92 7 1.05 105 1.01 105 0.97 6.13 103 6.50 103 1.06 1.99 101 2.11 101 1.06 10 5.13 104 4.97 104 0.97 2.99 103 3.18 103 1.06 8.98 100 1.03 101 1.15 12 5.66 103 5.43 103 0.96 3.58 102 3.29 102 0.92 1.14 100 7.01 100 6.16 T o ta l 4 2.68 10 6 2.16 106 0.81 6.30 104 5.81 104 0.92 9.23 101 8.15 101 0.88 7 8.35 105 7.06 105 0.84 2.01 104 1.90 104 0.95 2.58 101 2.66 101 1.03 10 4.13 105 3.46 105 0.84 1.07 104 9.30 103 0.87 1.21 101 1.30 101 1.08 12 2.11 104 1.67 104 0.79 7.35 102 5.66 102 0.77 1.31 100 8.15 100 6.24
The comparison between CIRCEE and TRIPOLI-4 follows a different trend than in the previous section. It must be noted that values for the farthest probe with the 200 cm screen are the only ones that largely overestimate the TRIPOLI-4 results. It is due to the fact that the total width of a screen cannot exceed 200 cm in CIRCEE, as it is the case for this probe (200+30 cm) – thus the attenuation due to the last concrete wall is not taken into account. It is however conservative from a safety perspective.
Every other ratio values are much closer to 1 and more uniform than in section 3.1, with a lesser increase with distance. The following table illustrates the effect of reflection as estimated by TRIPOLI-4 and CIRCEE.
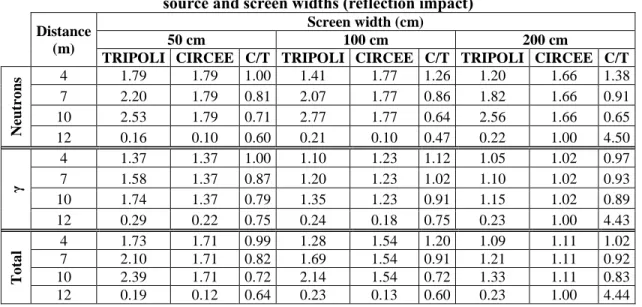
Table III. Comparison between CIRCEE and TRIPOLI-4 equivalent doses for several distances to source and screen widths (reflection impact)
Distance (m)
Screen width (cm)
50 cm 100 cm 200 cm
TRIPOLI CIRCEE C/T TRIPOLI CIRCEE C/T TRIPOLI CIRCEE C/T
Neut ro ns 4 1.79 1.79 1.00 1.41 1.77 1.26 1.20 1.66 1.38 7 2.20 1.79 0.81 2.07 1.77 0.86 1.82 1.66 0.91 10 2.53 1.79 0.71 2.77 1.77 0.64 2.56 1.66 0.65 12 0.16 0.10 0.60 0.21 0.10 0.47 0.22 1.00 4.50 γ 4 1.37 1.37 1.00 1.10 1.23 1.12 1.05 1.02 0.97 7 1.58 1.37 0.87 1.20 1.23 1.02 1.10 1.02 0.93 10 1.74 1.37 0.79 1.35 1.23 0.91 1.15 1.02 0.89 12 0.29 0.22 0.75 0.24 0.18 0.75 0.23 1.00 4.43 T o ta l 4 1.73 1.71 0.99 1.28 1.54 1.20 1.09 1.11 1.02 7 2.10 1.71 0.82 1.69 1.54 0.91 1.21 1.11 0.92 10 2.39 1.71 0.72 2.14 1.54 0.72 1.33 1.11 0.83 12 0.19 0.12 0.64 0.23 0.13 0.60 0.23 1.00 4.44
In the current configuration, the indirect dose contribution increases with distance, thus the dose estimated with CIRCEE differ more and more than the one estimated with TRIPOLI as distance increases. Except for the point closer to the screen, corresponding to the condition in which this correction has been established, CIRCEE underestimates the correction, but never more than by a factor of 2.
It should however be noted that the ratio values presented in Table II are closer to 1 than those presented in Table III and Table I: the correction underestimation compensates partially the overestimation of the non-reflected case. Thus, it can be concluded that the use of this correction results in a more precise dose estimate for calculation points placed inside buildings.
3.3. Diffusion Correction
The configuration depicted in the following figure has been used to test the diffusion correction used to correct dose estimates after crossing screens.
Figure 4 – Diffusion correction test configuration. a) Top view, b) Side view
The calculations results for both CIRCEE and TRIPOLI-4 are presented in the following table.
Table IV. Comparison between CIRCEE and TRIPOLI-4 equivalent doses (mSv/h) for several diffusion angles (Figure 4 configuration)
Angle (°)
Neutrons γ Total
TRIPOLI CIRCEE C/T TRIPOLI CIRCEE C/T TRIPOLI CIRCEE C/T
0 1.27 105 1.21 105 0.95 6.19 104 5.82 104 0.94 1.89 105 1.79 105 0.95 5 1.27 105 1.18 105 0.93 6.26 104 5.72 104 0.91 1.90 105 1.75 105 0.92 10 1.24 105 1.10 105 0.89 6.20 104 5.44 104 0.88 1.86 105 1.64 105 0.88 15 1.17 105 9.71 104 0.83 6.00 104 4.99 104 0.83 1.77 105 1.47 105 0.83 20 1.07 105 8.11 104 0.76 5.63 104 4.40 104 0.78 1.63 105 1.25 105 0.77 30 8.27 104 4.63 104 0.56 4.61 104 2.95 104 0.64 1.29 105 7.58 104 0.59 40 5.61 104 4.63 104 0.83 3.33 104 2.95 104 0.88 8.94 104 7.58 104 0.85 50 3.35 104 4.63 104 1.38 2.09 104 2.95 104 1.41 5.44 104 7.58 104 1.39 60 1.74 104 4.63 104 2.66 1.18 104 2.95 104 2.50 2.92 104 7.58 104 2.60
These calculation results show that this correction contains the ratio between CIRCEE and TRIPOLI to a 0.5-2.5 range, overestimation occurring only for angles greater than 40°; this is satisfying.
3.4. Realistic configuration
The configuration depicted in the following figure has been used to evaluate CIRCEE results in a realistic configuration; it includes a 1-meter thick concrete U-shaped hot-cell, and 30-cm thick concrete ceiling and roof.
Figure 5 – Realistic test configuration. a) Top view, b) Side view
Table V. Comparison between CIRCEE and TRIPOLI-4 equivalent doses (mSv/h) for several diffusion angles (Figure 5 configuration)
Name Neutrons γ Total
TRIPOLI CIRCEE C/T TRIPOLI CIRCEE C/T TRIPOLI CIRCEE C/T
A 1.35 103 9.43 102 0.70 1.02 103 8.69 102 0.85 2.37 103 1.81 103 0.76 B 4.75 104 4.00 104 0.84 2.23 104 2.08 104 0.93 6.98 104 6.09 104 0.87 C 6.16 104 4.84 104 0.79 2.74 104 2.52 104 0.92 8.90 104 7.36 104 0.83 D 1.32 105 5.41 100 4.1 10-5 1.76 104 2.04 101 1.2 10-3 1.49 105 2.58 101 1.7 10-4 E 1.47 101 2.25 100 0.15 2.17 101 8.49 100 0.39 3.63 101 1.07 101 0.30 F 3.41 103 2.63 103 0.77 7.86 102 1.84 103 2.34 4.20 103 4.46 103 1.06 G 1.91 103 4.06 100 2.1 10-3 9.60 102 1.53 101 1.6 10-2 2.87 103 1.94 101 6.7 10-3 H 4.23 102 2.60 100 6.1 10-3 1.64 102 9.79 100 6.0 10-2 5.87 102 1.24 101 2.1 10-2 I 1.36 102 1.55 100 1.1 10-2 2.99 101 5.85 100 2.0 10-1 1.65 102 7.40 100 4.5 10-2 J 7.73 103 1.12 104 1.45 3.94 103 5.81 103 1.48 1.17 104 1.70 104 1.46
These results clearly show, as expected with straight line attenuation, that:
- for probes with a dominant direct contribution, the CIRCEE dose estimates are of correct magnitude;
- for probes with a diffuse main contribution, the CIRCEE dose estimates largely underestimate TRIPOLI-4 results.
The problematic configurations are characterized by thick screens and convoluted geometries, such as the one in Figure 5.
In the context of consequences mitigation, the methodology to solve these underestimates is to make the dose uniform to its highest value in humanly-defined areas; here, doses for probes F, J, G, H, I and E are
considered to be equal to doses obtained for B. This results in large overestimates, but is conservative safety-wise.
3.5. Validation Conclusion – Applicability Domain
The few configurations presented above show that doses calculated with CIRCEE are consistent with expectations as long as the main contribution is direct, non-diffused. For these configurations, the ratio between CIRCEE and TRIPOLI-4 is approximately contained in the range 0.5 – 2, which is satisfying considering the simplicity of the approach.
As straight line attenuation approximation can lead to large underestimates inside lacunary geometries, a methodology has been proposed, and can be adapted to the different use cases of CIRCEE (isodoses or CAAS probes implantation) by choosing either a lower or higher smoothing value – however, it means that CIRCEE maps, like any calculation, have to be analyze by a competent engineer.
The CIRCEE limitation to a 2-m maximum screen thickness is not detrimental for the assessment of dosimetric consequences, as it only causes an overestimation of the dose. In the case of the CAAS positioning validation, configurations exhibiting widths exceeding this limit should be avoided as much as possible; if this is not possible, a careful analysis should be conducted to handle these situations. Similarly, when positioning CAAS probes, it should be kept in mind that locations at almost grazing angles from a screen between the source and the probe should be avoided, particularly for thicker screens.
4. TYPICAL USE CASES
A few selected use cases, corresponding to studies carried out up to this day with CIRCEE for CEA and AREVA facilities, are described below
4.1. Isodoses Maps for Safety Report
During the design of a facility in which fissile materials will be present in quantities sufficient to create a risk of criticality accident, potential accident locations are determined, and scenarios leading to the accidents are developed.
Given this information, one or several accident source terms are estimated, and for each of them an isodoses map is calculated from a CAD imported geometry. From these maps, evacuation paths and gathering and evacuation points are set.
Depending on the facility location and isodoses extension, it might be necessary to refine the calculation model to include buildings or ground elements, or to study consequences over an extended area featuring roads or sloping roads.
4.2. CAAS Probes Implantation
Under the same circumstances than the creation of isodoses maps for the constitution of the safety report, an alarm system must be designed and set up to evacuate operators and employees as soon as possible when a criticality accident is detected. These CAAS include several probes, which trigger the alarm when at least two of them both cross a dose threshold and a dose-rate threshold.
A parametric study is then conducted to place a minimal number of probes (typically 4), optimizing to cover as many as possible accident locations, and insofar decoupling the probes from each other to prevent failure of several probes in case of fire. For each of these configurations a CIRCEE calculation is done, and the coverage of the accident siege is checked, given margins on its localization. Finally, the sensitivity to the probes’ positioning is studied with more calculations, in order to be able to adapt to operational and architectural constraints.
4.3. Design of a Radiation Shield
The following use case illustrates the ability of CIRCEE to run fast parametric studies, which can be useful illustrated in this example.
Considering the design of a radiation shield aimed at limiting consequences of a criticality accident outside of a facility, a parametric study can be carried out, implying calculation of an isodoses map for each dimension, implantation, and composition of the screen. In each of these cases, a possibly large set of view planes might be considered, each of them corresponding to a given altitude or distance from the source, depending on the topology of the surroundings of the facility.
The added value of CIRCEE in such a case is obvious, as the total number of required calculations rises; compared to other methods, the study may be carried out much more quickly, and a greater accuracy may be reached in the studied parameters.
5. CONCLUSION
CIRCEE is a powerful, polyvalent and effective tool, but the use of calculation results requires their prior interpretation, in direct connection with the field and expertise. The development of a user interface is underway, which will allow users to view models and place sources and calculation points. CIRCEE and its interface should be available under commercial license terms in a near future.
Its use in other fields such as generic radiation shielding is feasible, although requiring library adaptations to accommodate for different spectra.
REFERENCES
1. V. Massé et al., “CIRCEE: Calculations of the Isodoses in case of risk of criticality in a changing environment”, Proc. of Nuclear Criticality Safety Division Topical Meeting on Realism, Robustness
and the Nuclear Renaissance, NCSD 2009, Richland, Washington, USA, September 13-17, 2009.
2. G. Dejonghe, L. Luneville, “Sn1D : Code de protection nucléaire à une dimension – Principes et notice d’utilisation”, CEA/DMT 93/438 SERMA/LEPP/93/1532
3. “Conversion coefficients for use in radiological protection against external radiation”, ICRP publication 74 (Annals of the ICRP, Vol. 26, N°3/4), Pergamon press (1996)
4. “Nuclear Data for Neutron and Proton Radiotherapy and for Radiation Protection”, ICRU-Report 63, International Commission on Radiation Units and Measurements (2000).
5. “P.M.D.S., Ecrans de protection contre les rayonnements ionisants (Tome 1), Ecrans neutroniques de protection et de criticité (Vol 1/2) ”, CEA n° 1863, décembre 1987
6. V. Bergeaud, V. Lefebvre, “SALOME: A software integration platform for multi-physics, pre-processing and visualization”, Proceedings of SNA + MC2010: Joint international conference on
supercomputing in nuclear applications + Monte Carlo, Tokyo, Japan, p. 1630 (2010).