Short Communication
Ulrich auf dem Keller * and Christopher M. Overall
CLIPPER: an add-on to the Trans-Proteomic
Pipeline for the automated analysis of TAILS
N-terminomics data
Abstract: Data analysis in proteomics is complex and with
the extra challenges involved in the interpretation of data from N-terminomics experiments, this can be daunting. Therefore, we have devised a rational pipeline of steps to approach N-terminomics data analysis in a statistically-based and valid manner. We have automated these steps in CLIPPER, an add-on to the Trans-Proteomic Pipeline (TPP). Applying CLIPPER to the analysis of N- terminomics data generated by terminal amine isotopic labeling of substrates (TAILS) enables high confidence peptide to protein assignment, protein N-terminal characterization and annotation, and for protease analysis readily allows protease substrate discovery with high confidence.
Keywords: degradomics; N-terminomics; protease; proteomics; terminal amine isotopic labeling of substrates (TAILS); Trans-Proteomic Pipeline (TPP).
*Corresponding author: Ulrich auf dem Keller, Department of Biology, Institute of Molecular Health Sciences , ETH Zurich, CH-8093 Zurich, Switzerland,
e-mail: [email protected]
Christopher M. Overall: Department of Biochemistry and Molecular Biology and Department of Oral Biological and Medical Sciences , Centre for Blood Research, University of British Columbia, 4.401 Life Sciences Centre, 2350 Health Sciences Mall, Vancouver, BC V6T 1Z3, Canada
Proteolysis is a major post-translational modification that affects every protein in its lifetime and thus controls many biological processes (Overall and Blobel , 2007 ; Lopez -Otin and Bond, 2008 ). In addition to triggering pivotal cas-cades, such as blood coagulation, complement and apo-ptosis, proteases activate latent enzymes, alter the affinity of bioactive ligands to their receptors, release growth factors from precursors or inhibitory binding partners and remove proteins from the cell by proteasomal deg-radation. The key to understanding protease function is the elucidation of their substrates under physiological
conditions, which has been hampered until recently by the lack of appropriate technologies (Overall and Blobel , 2007 ). To address this limitation several novel proteom-ics methods for the system-wide discovery of protease substrates in complex biological samples have been introduced (auf dem Keller and Schilling , 2010 ; Impens et al. , 2010 ; Huesgen and Overall , 2012 ) in the subfield of proteomics that has come to be known as degradomics (Lopez -Otin and Overall, 2002 ).
High throughput degradomics techniques aim for the enrichment and, ideally, relative quantification of N-terminal peptides in protease-treated and control samples. This is necessary in order to identify the neo-N termini of proteins that are generated upon cleavage by the test protease and are not instead generated by back-ground proteolytic activity in the sample in vivo or in the in vitro assay. One of these approaches termed terminal amine isotopic labeling of substrates (TAILS) was devel-oped by our laboratory (Kleifeld et al. , 2010 , 2011) and since then has been successfully applied to the discov-ery of hundreds of physiologically-relevant substrates of various members of the matrix metalloproteinase (MMP) (auf dem Keller et al. , 2010 ; Prudova et al. , 2010 ; Starr et al. , 2012 ) and meprin protease families (Becker -Pauly et al., 2011 ; Jefferson et al. , 2011 , 2012 ).
N-terminomics data analysis
strategy
Inherently, all quantitative proteomics analyses of samples after specific enrichment for N-terminal peptides differ substantially from traditional shotgun proteomics approaches, since they mostly rely upon the identification and relative quantification of a single peptide per protein derived from the N terminus. This is not fundamentally different from other subfields of proteomics, where the identification of post-translationally modified proteins, such as phosphoproteins, relies upon specific enrichment
of the post-translationally modified peptide, which in the case of phosphoproteomics often occurs from the identifi-cation of a single phosphopeptide per protein. However, single peptide to protein identification places a particular challenge on data analysis and precludes the applica-tion of many commercially available easy-to-use software packages, which are tailored for the interpretation of protein-centered results from shotgun experiments.
To address this issue we developed a bioinformat-ics analysis strategy that combines highly stringent spectrum-to-peptide assignment, confidence in quantifi-cation, isoform assignment probability, automated anno-tation and statistical measures for the interpreanno-tation of results (auf dem Keller et al. , 2010 ; Kleifeld et al. , 2011 ). The first challenge in the analysis of mass spectrometry (MS)-based proteomics data is the correct assignment of tandem mass spectra arising from fragmented peptides to the peptide precursor of origin. In N-terminomics work-flows, such as TAILS, this is often further complicated by the lack of supporting information by the identifica-tion of multiple peptides from each protein. Therefore, we employ two search engines and data-dependent sec-ondary validation using the PeptideProphet (Keller et al. , 2002 ) and iProphet (Shteynberg et al. , 2011 ) algorithms provided with the Trans-Proteomic Pipeline (TPP; Deutsch et al. , 2010 ), an open-source software suite for proteom-ics data analysis developed by the Institute for Systems Biology in Seattle. Moreover, since TAILS uses negative selection to enrich for blocked N-terminal peptides pre-pared by primary amine labeling at the protein – not peptide – level, naturally blocked mature original protein N termini, such as by acetylation or cyclization, are also enriched from the vast number of internal unblocked tryptic and C-terminal semi-tryptic peptides. Thus, the original mature N terminus as well as protease generated neo-N termini are identified in ~ 50 % of proteins, enabling protein identification from the use of two or more unique peptides (auf dem Keller et al. , 2010 ). Hence, this is a sig-nificant advantage of N-terminomics negative selection approaches, such as TAILS and Combined FRActional DIagonal Chromatography (COFRADIC) (Impens et al. , 2010 ) over positive selection procedures that rarely gather the original mature protein terminus, which is blocked by acetylation in ~ 80 % of proteins (Hollebeke et al. , 2012 ).
TAILS enables flexible labeling options, such as dimethylation, isobaric tags for relative and absolute quantitation (iTRAQ) or stable isotope labeling by amino acids in cell culture (SILAC) (Kleifeld et al. , 2011 ). Depending on the label, relative quantification of peptides is per-formed by different TPP modules: ‘ XPRESS ’ for dimeth-ylation and SILAC or ‘ Libra ’ for iTRAQ isotopic labeling. In
traditional quantitative proteomics approaches, quantita-tive data from several peptides per protein are averaged and outliers removed prior to calculating the relative amount of a protein in two or more conditions. This mostly aver-ages out errors in accurate single peptide quantification, a prerequisite for the quantitative comparison of protein N termini and neo-N termini in control and protease-treated samples analyzed by TAILS. We therefore apply intensity-dependent averaging of multiple quantification events per peptide and introduced the quantification confidence factor (QCF), a parameter for the assessment of confidence in single peptide quantification in iTRAQ-based TAILS experiments (auf dem Keller et al. , 2010 ). The decision if a neo-N-terminal peptide was derived from activity of the test protease, and thus from a substrate protein, is based on its quantitative ratio in the protease-treated and control sample that has to be evaluated within the experimental variation. This can be defined with the help of a separately derived training set of experimental protease cleavage data (auf dem Keller et al. , 2010 ) or within the same TAILS experiment by the ratio distribution of natural N termini requiring the positional annotation of N termini in mature proteins (Gioia et al. , 2009 ).
The remaining challenge is that with only single peptide identification, the assignment of neo-N termini to protein isoforms can be ambiguous. To address this issue we exploited the analysis of the same sample prior to negative selection enrichment of N-terminal peptides in combination with protein-level modeling of identification confidence provided by the ProteinProphet ® algorithm
(Nesvizhskii et al. , 2003 ) as part of the TPP. This informa-tion is integrated into the isoform assignment score (IAS), a measure for the confidence in single peptide-to-protein assignments (auf dem Keller et al. , 2010 ).
CLIPPER software
Overall, the data analysis process in proteomics is highly complex and becomes particularly challenging in the interpretation of N-terminomics datasets. Therefore, we have developed and implemented an integrative data analysis pipeline enabling the assignment of peptides to proteins with high confidence, characterization and annotation of protein N termini, and statistically-based identification of protease substrates. Data analysis down-stream of peptide identification and quantification imple-mented by the TPP or alternative proteomics data analysis pipelines is cumbersome, however, and requires mul-tiple steps that involve several in-house Perl scripts and
spreadsheet templates. Bioinformatics analysis is there-fore still a bottleneck in the implementation and appli-cation of N-terminomics technologies, such as TAILS. These steps have now been automated in the CLIPPER software, an integrated analysis tool for TAILS data that
is implemented as an add-on to the TPP and can easily be installed on top of an existing TPP-installation on Micro-soft Windows, Linux and Mac OS X platforms. Further-more, we provide a stand-alone version of CLIPPER that can be run independently of the TPP as a command-line
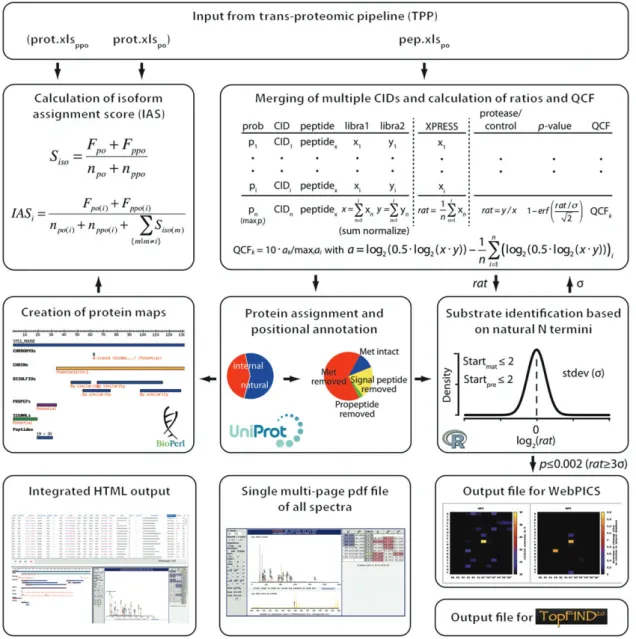
Figure 1 Overview of the CLIPPER analysis pipeline.
Input of PeptideProphet/iProphet (TPP)-filtered spectrum-to-peptide assignments of samples after TAILS-negative N-terminal enrichment (po) in the form of a tab-delimited export file from PepXML Viewer (pep.xls po ) is mandatory for CLIPPER. ProteinProphet ® -filtered lists
exported from protXML Viewer both from analysis of samples prior (prot.xls ppo ) and/or after (prot.xls po ) enrichment of N termini can also be
provided for the calculation of isoform assignment scores (IAS). In the quantification module, CLIPPER merges multiple collision-induced dissociations (CIDs) and different oxidation, amidation and charge states per peptide and calculates intensity-weighted ratios of abun-dances in protease-treated and control samples. Intensities are also used to assess the relative quality of quantification in the form of a quantification confidence factor (QCF) (auf dem Keller et al. , 2010 ). N termini are automatically annotated for their position in mature proteins, and natural N termini are extracted to determine a ratio cutoff for neo-N termini generated by the test protease. Peptides meeting these criteria are transferred to an output file for analysis with WebPICS (Schilling et al. , 2011 ). For visualization of substrate cleavage sites, CLIPPER maps identified N-terminal peptides onto protein domain structures by generating protein maps. Final results are presented in the form of a hyperlinked HTML frameset. CLIPPER can also compile a multi-page pdf file of spectra for each peptide and create output files for protease cleavage sites and protein N termini for upload to TopFIND (Lange et al. , 2012 ).
tool. This version allows annotation and statistical evalu-ation of N-terminomics data generated by alternative technologies, such as COFRADIC, and/or proteomics data analysis software packages.
Figure 1 shows the integrative modules of CLIPPER that require input of the tab-delimited spreadsheet export file (pep.xls po ) of the TPP ’ s peptide visualizer PepXML Viewer, which can be used to filter peptides by identifi-cation confidence. Filtered tab-delimited output files of the ProteinProphet ® protXML Viewer obtained by
Protein-Prophet ® analysis of samples prior (prot.xls
ppo ) and after
(prot.xls po ) enrichment for N-terminal peptides can also be provided for the calculation of IAS values.
The CLIPPER quantification module merges multiple identification events for the same peptide derived from detection by multiple collision-induced dissociations and in different oxidation, amidation and charge states. Thereby, iTRAQ-based quantification-associated reporter ion intensity values are summed up in each channel (libra n ) with the effect of rewarding high intensities in spectrum-averaged peptide quantification (Carrillo et al. , 2010 ). This approach differs from our previously suggested experiment based intensity-dependent weighted averaging (auf dem Keller et al. , 2010 ), but is machine independent and does not require an additional experiment. Summed intensities are used to calculate ratios of peptide abundances in the protease-treated and control samples (protease/control), which is now the de facto convention in all degradomics approaches to expressing neo-N-terminal peptide ratios. Furthermore, intensity measures are derived from summed intensities in both channels [0.5 · log 2 (protease·control)] that are then used to calculate relative QCF values normalized to a top score of 10 (see the formula in Figure 1). For dimethyla-tion- and SILAC-based TAILS data, pre-calculated protease/ control-ratios (XPRESS) are averaged and the standard deviation reported. For multiplex iTRAQ-based experi-ments summed intensities might be normalized to the sum of channels for direct comparison of peptide abundances in multiple conditions. After spectra merging, CLIPPER reports additional parameters of the spectrum-to-peptide assignment with the highest identification probability of all merged events.
The next step of the CLIPPER analysis pipeline involves the automated annotation of N-terminal pep-tides to determine their position in mature proteins with the help of the UniProtKB/Swiss-Prot Protein Knowl-edgebase (Magrane and Consortium , 2011 ). If a peptide can be assigned to multiple isoforms or proteins, the first priority is given to the entry with the highest IAS (if avail-able) followed by prioritization of Swiss-Prot (manually annotated and reviewed) over TrEMBL (automatically
0.7
Natural N termini
0.6
0.5
0.4
Lower cutoff: -1.7 Upper cutoff: 1.7
Generated neo-N termini Depleted natural N termini Density 0.3 0.2 0.1 0.0 -4 -2 0 2 4 Log2 (MMP2/control)
Figure 2 Protease substrate identification based on natural N termini.
Spectra obtained by TAILS analysis of samples from cell culture supernatants of Mmp2 -/- mouse embryonic fibroblasts incubated
with recombinant MMP2 (auf dem Keller et al. , 2010 ) were searched against a UnitproKB (release 2012_03, tax_id = 10090) database supplemented with common contaminants using Mascot v2.3 and X! Tandem (2010.10.01.1) (search parameters: semi-Arg-C enzyme specificity with up to two missed cleavages; cysteine carbamidomethyl and peptide lysine CLIP-TRAQ set as fixed modifications; N-terminal CLIP-TRAQ, N-terminal acetylation, and methionine oxidation set as variable modifications; peptide tolerance and MS/MS tolerance both set at 0.4 Da; and the scoring scheme set as ESI-QUAD-TOF). Data were evaluated by Peptide-Prophet and results from both search engines were combined using iProphet (TPP v4.5 RAPTURE rev 0). Spectrum-to-peptide assign-ments with an iProphet p ≥ 0.95 were exported from the PepXML Viewer and analyzed by CLIPPER, enabling merging of multiple collision-induced dissociations and calculation of an MMP2/control ratio cutoff for substrates based on natural N termini. A histogram of mean normalized log 2 (MMP2/control) ratios for natural N termini with a fitted normal distribution with a standard deviation of 0.567 is shown. This results in an upper cutoff of 3 · 0.567 = 1.7 for MMP2 generated neo-N termini and a lower cutoff of -1.7 for MMP2 depleted natural N termini.
The MMP2_2 dataset is available from the Proteomecommons.org Tranche system (hash:p4rMhdzV4oeHTk84VqY1yNda1qjKHY6oIsaA OFgQ + rGmGM2/NAOQOznpKGtzWfatBS5fPfyRbdvnlWABghwCsEm-75jIAAAAAAAASMw = = ; password: stattails) .
annotated, not reviewed) entries. From this annotated dataset natural N termini, i.e., peptides assigned to the start of a mature protein, are extracted. Natural N termini can be assumed not to be generated by the test protease (Gioia et al. , 2009 ; Kleifeld et al. , 2010 ). To determine the experimental variation in the relative quantification of N-terminal peptides in protease-treated and control samples
CLIPPER therefore uses this information to mean-normalize the protease/control ratio for each peptide and with the help of the Gaussian error function calcu-lates a p -value resembling the probability that the abun-dance of the peptide was affected by the test protease. By default, a p -value of ≤ 0.002 reflects a protease/control ratio that is at least three times higher or lower than the standard deviation of the experimental variation, pro-viding a stringent cutoff for neo-N termini generated or natural N termini depleted by the activity of the test protease. Using this approach we calculated a cutoff of log 2 (protease/control) of 1.7 for matrix metalloproteinase 2-generated neo-N termini (Figure 2 ) by re-analyzing a dataset described previously (auf dem Keller et al. , 2010 ) that was in the same range as our statistical classifier derived from experimental protease cleavage data using a test protease with canonical cleavage specificity. This newly-derived cutoff corresponds to a false discovery rate for substrates (not peptides or protein identifications,
which we set to an error rate of ≤ 5 % and ≤ 2 % , respec-tively) of 23 % at a sensitivity of 93 % , which is close to the optimum of 15 % and 86 % , respectively (auf dem Keller et al. , 2010 ). Although less stringent, ratio cutoffs for protease cleavage events based on natural N termini can be calculated from the same dataset and do not require additional experiments that would have to be performed on each mass spectrometer used for TAILS analyses. In any case, both our approaches are preferable to arbitrary ratio cutoffs such as 1.5 or 2.0, as are commonly applied in many other genomic and proteomic techniques. Neo-N termini with protease/control ratios higher than the sta-tistically defined cutoff are considered to be generated by high confidence cleavage events and are exported to a separate output file for direct analysis of cleavage speci-ficity with WebPICS (Schilling et al. , 2011 ). These are also color coded in protein maps, which are automatically generated to visualize N-terminal peptides identified in the context of protein domain structures.
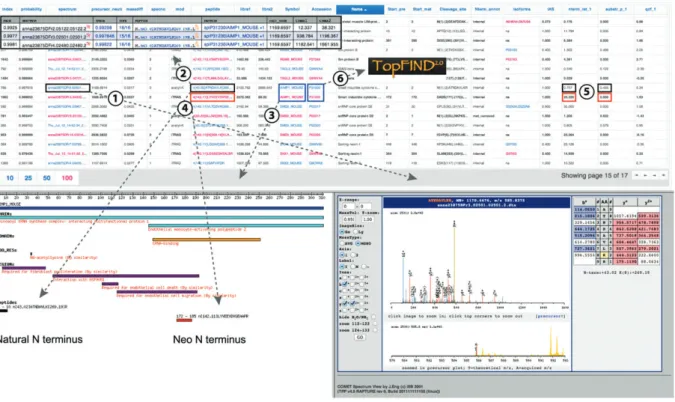
Figure 3 CLIPPER integrated HTML output.
CLIPPER generates a hyperlinked table of N-terminal peptides with associated information on identification parameters, positional annotation in assigned proteins and relative quantification in the protease-treated and control samples. For each peptide, the underlying MS2 spectrum with the highest assignment probability is indicated, which is hyperlinked to visualization by TPP ’ s COMET Spectrum View ©
(1). Additional spectra assigned to the same peptide are available through a direct link to the corresponding pep.xml entries rendered by PepXML Viewer (2). Protein symbols are linked to a protein map (3) displaying the protein domain structure and all identified N-terminal peptides assigned to this protein (4). In protein maps, N termini are color-coded based on their relative abundance in protease-treated and control samples (5) identifying them as unaffected (black), newly generated (red) or depleted (green) by the test protease. In addition to protein symbols, UniProtKB accession numbers are provided that are directly linked to the TopFIND protease knowledgebase (Lange et al. , 2012 ) (6).
All CLIPPER analysis results are finally integrated into an HTML frameset displaying a table of identified pep-tides with hyperlinks to corresponding spectra (for merged peptides the spectrum with the highest assignment prob-ability) rendered by TPP ’ s COMET Spectrum View © and a
domain map of the matching protein annotated with all assigned peptides in the dataset (Figure 3 ). Furthermore, peptide sequences are directly linked to their spectra entries in PepXML Viewer and protein accessions for the main and all alternative protein isoforms to the termini- oriented protein function inferred database (TopFIND; Lange and Overall , 2011 ; Lange et al. , 2012 ). This makes it easy for the user to check the most comprehensive protease cleavage database to determine whether a cleavage event they have identified has previously been observed. In addi-tion, CLIPPER outputs comma-separated values files of the final results as well as for each intermediate step of the analysis pipeline. It can also generate comma-separated values files of protease cleavage sites in native proteins and of protein N termini for direct upload to TopFIND and of high-confidence neo-N termini for analysis with WebPICS (Schilling et al. , 2011 ). According to the Paris guidelines for reporting protein identification data (Bradshaw et al. , 2006 ), the appropriately labeled MS/MS spectrum for the identification of each single-peptide-based protein should be provided. Since this is an inherent problem of protein identification by N-terminal peptides, CLIPPER provides a built-in module to automatically generate a multi-page portable document format (pdf) file of spectra assigned to N termini with the highest confidence rendered by COMET Spectrum View ©. New developments are under way to
facilitate the easy upload of peptide-centric TPP data to common proteomics data repositories, such as the PRIDE PRoteomics IDEntification database (Vizcaino et al. , 2010 ).
Implementation of CLIPPER
CLIPPER is implemented as a single Perl script and makes use of the TPP (Deutsch et al. , 2010 ), BioPerl
toolkit (Stajich et al. , 2002 ), R language and environ-ment for statistical computing (R Developenviron-ment Core Team , 2012 ) including the MASS package (Venables and Ripley , 2002 ), Ghostscript ( www.ghostscript.com ), wkhtmltopdf ( http://code.google.com/p/wkhtmltopdf/ ) and the fixheadertable jQuery plugin ( http://www. tablefixedheader.com/ ). For full functionality, the script requires a working installation of these components and is installed as an add-on to the TPP with full inte-gration into the web-based TPP GUI (Petunia). CLIPPER is licensed under the GNU General Public License (v 3.0) and can be downloaded free of charge from http:// clipserve.clip.ubc.ca/tails. It has documentation and detailed installation instructions for UNIX-based opera-tion systems and a self-extracting archive for Microsoft Windows 7. In addition to the CLIPPER TPP add-on, the installer archive comprises a command-line version of the software that handles output from alternative N-ter-minomics approaches and/or proteomics data analysis pipelines provided in form of a generic tab-delimited input file.
Acknowledgments: We would like to thank all of the TPP developers for the development and maintenance of this important software package. Special thanks go to Luis Mendoza, Natalie Tasman and David Shteynberg for their continuous support. This work was supported in part by a grant from the Canadian Institutes of Health Research, and a program project grant in Breast Cancer Metasta-ses from the Canadian Breast Cancer Research Alliance with funds from the Canadian Breast Cancer Foundation and the Cancer Research Society. C.M.O is supported by a Canada Research Chair in Metalloproteinase Proteom-ics and Systems Biology. U.a.d.K. acknowledges the support by a Marie Curie International Reintegration Grant (FP7-PEOPLE-2010-RG) from the European Commis-sion and the Swiss National Science Foundation (grant 31003A_140726/1).
Received August 10, 2012; accepted September 11, 2012
References
auf dem Keller, U. and Schilling, O. (2010). Proteomic techniques and activity-based probes for the system-wide study of proteolysis. Biochimie 92 , 1705 – 1714.
auf dem Keller, U., Prudova, A., Gioia, M., Butler, G.S., and Overall, C.M. (2010). A statistics-based platform for quantitative N-terminome analysis and identification of protease cleavage products. Mol. Cell. Proteomics 9 , 912 – 927.
Becker-Pauly, C., Barre, O., Schilling, O., auf dem Keller, U., Ohler, A., Broder, C., Schutte, A., Kappelhoff, R., Stocker, W., and Overall, C.M. (2011). Proteomic analyses reveal an acidic prime side specificity for the astacin metalloprotease family reflected by physiological substrates. Mol. Cell. Proteomics 10 , M111. 009233. Epub Jun
Bradshaw, R.A., Burlingame, A.L., Carr, S., and Aebersold, R. (2006). Reporting protein identification data: the next generation of guidelines. Mol. Cell. Proteomics 5 , 787 – 788.
Carrillo, B., Yanofsky, C., Laboissiere, S., Nadon, R., and Kearney, R.E. (2010). Methods for combining peptide intensities to estimate relative protein abundance. Bioinformatics 26 , 98 – 103.
Deutsch, E.W., Mendoza, L., Shteynberg, D., Farrah, T., Lam, H., Tasman, N., Sun, Z., Nilsson, E., Pratt, B., Prazen, B., et al. (2010). A guided tour of the Trans-Proteomic Pipeline. Proteomics 10 , 1150 – 1159.
Gioia, M., Foster, L.J., and Overall, C.M. (2009). Cell-based identification of natural substrates and cleavage sites for extracellular proteases by SILAC proteomics. Methods Mol. Biol. 539 , 131 – 153.
Hollebeke, J., Van Damme, P., and Gevaert, K. (2012). N-terminal acetylation and other functions of Nalpha-acetyltransferases. Biol. Chem. 393 , 291 – 298.
Huesgen, P.F. and Overall, C.M. (2012). N- and C-terminal degradomics: new approaches to reveal biological roles for plant proteases from substrate identification. Physiol. Plant. 145 , 5 – 17. Impens, F., Colaert, N., Helsens, K., Plasman, K., Van Damme,
P., Vandekerckhove, J., and Gevaert, K. (2010). MS-driven protease substrate degradomics. Proteomics 10 , 1284 – 1296. Jefferson, T., Causevic, M., auf dem Keller, U., Schilling, O.,
Isbert, S., Geyer, R., Maier, W., Tschickardt, S., Jumpertz, T., Weggen, S., et al. (2011). Metalloprotease meprin beta generates nontoxic N-terminal amyloid precursor protein fragments in vivo . J. Biol. Chem. 286 , 27741 – 27750. Jefferson, T., auf dem Keller, U., Bellac, C., Metz, V.V., Broder, C.,
Hedrich, J., Ohler, A., Maier, W., Magdolen, V., Sterchi, E. , et al. (2012). The substrate degradome of meprin metalloproteases reveals an unexpected proteolytic link between meprin β and ADAM10. Cell. Mol. Life Sci. DOI 10.1007/s00018-012-1106-2. Keller, A., Nesvizhskii, A.I., Kolker, E., and Aebersold, R. (2002).
Empirical statistical model to estimate the accuracy of peptide identifications made by MS/MS and database search. Anal. Chem. 74 , 5383 – 5392.
Kleifeld, O., Doucet, A., auf dem Keller, U., Prudova, A., Schilling, O., Kainthan, R.K., Starr, A.E., Foster, L.J., Kizhakkedathu, J.N., and Overall, C.M. (2010). Isotopic labeling of terminal amines in complex samples identifies protein N-termini and protease cleavage products. Nat. Biotechnol. 28 , 281 – 288.
Kleifeld, O., Doucet, A., Prudova, A., Auf dem Keller, U., Gioia, M., Kizhakkedathu, J.N., and Overall, C.M. (2011). Identifying and quantifying proteolytic events and the natural N terminome by terminal amine isotopic labeling of substrates. Nat. Protoc. 6 , 1578 – 1611.
Lange, P.F. and Overall, C.M. (2011). TopFIND, a knowledgebase linking protein termini with function. Nat. Methods 8 , 703 – 704.
Lange, P.F., Huesgen, P.F., and Overall, C.M. (2012). TopFIND 2.0 — Linking protein termini with proteolytic processing and modifications altering protein function. Nucleic Acids Res. 40 , D351 – 361.
Lopez-Otin, C. and Bond, J.S. (2008). Proteases: multifunctional enzymes in life and disease. J. Biol. Chem. 283 , 30433 – 30437. Lopez-Otin, C. and Overall, C.M. (2002). Protease degradomics:
a new challenge for proteomics. Nat. Rev. Mol. Cell Biol. 3 , 509 – 519.
Magrane, M. and Consortium, U. (2011). UniProt Knowledgebase: a hub of integrated protein data. Database (Oxford). 2011 , bar009.
Nesvizhskii, A.I., Keller, A., Kolker, E., and Aebersold, R. (2003). A statistical model for identifying proteins by tandem mass spectrometry. Anal. Chem. 75 , 4646 – 4658.
Overall, C.M. and Blobel, C.P. (2007). In search of partners: linking extracellular proteases to substrates. Nat. Rev. Mol. Cell Biol. 8 , 245 – 257.
Prudova, A., auf dem Keller, U., Butler, G.S., and Overall, C.M. (2010). Multiplex N-terminome analysis of MMP-2 and MMP-9 substrate degradomes by iTRAQ-TAILS quantitative proteomics. Mol. Cell. Proteomics 9 , 894 – 911.
R Development Core Team (2012). R: A Language and Environment for Statistical Computing. R Foundation for Statistical Computing, Vienna, Austria. Available at: http://www. R-project.org/, accessed September 17, 2012.
Schilling, O., auf dem Keller, U., and Overall, C.M. (2011). Factor Xa subsite mapping by proteome-derived peptide libraries improved using WebPICS, a resource for proteomic identification of cleavage sites. Biol. Chem. 392 , 1031 – 1037. Shteynberg, D., Deutsch, E.W., Lam, H., Eng, J.K., Sun, Z., Tasman, N., Mendoza, L., Moritz, R.L., Aebersold, R., and Nesvizhskii, A.I. (2011). iProphet: multi-level integrative analysis of shotgun proteomic data improves peptide and protein identification rates and error estimates. Mol. Cell. Proteomics 10 , M111 007690. Stajich, J.E., Block, D., Boulez, K., Brenner, S.E., Chervitz, S.A.,
Dagdigian, C., Fuellen, G., Gilbert, J.G., Korf, I., Lapp, H., et al. (2002). The Bioperl toolkit: Perl modules for the life sciences. Genome Res. 12 , 1611 – 1618.
Starr, A.E., Bellac, C.L., Dufour, A., Goebeler, V., and Overall, C.M. (2012). Biochemical characterization and N-terminomics analysis of leukolysin, the membrane-type 6 matrix
metalloprotease (MMP25): chemokine and vimentin cleavages enhance cell migration and macrophage phagocytic activities. J. Biol. Chem. 287 , 13382 – 13395.
Venables, W.N. and Ripley, B.D. (2002). Modern Applied Statistics with S, Fourth edn (New York: Springer).
Vizcaino, J.A., Cote, R., Reisinger, F., Barsnes, H., Foster, J.M., Rameseder, J., Hermjakob, H., and Martens, L. (2010). The Proteomics Identifications database: 2010 update. Nucleic Acids Res. 38 , D736 – 742.