UNCLASSIFIED
MASSACHUSETTS INSTITUTE OF TECHNOLOGY Research Laboratory of Electronics
and Lincoln Laboratory
1/f NOISE AND RELATED SURFACE EFFECTS IN GERMANIUM
Alan McWhorter Group 35
This report is identical with a thesis of the same title submitted in partial fulfillment of the requirements for the degree of Doctor of Science in the Department of Electrical Engineering at the Massachusetts Institute of Technology, 16 May 1955.
Research Laboratory of Electronics Technical Report No. 295
Lincoln Laboratory Technical Report No. 80
20 May 1955
MASSACHUSETTS
UNCLASSIFIED
LEXINGTONABS RACT
Recent experiments on germanium surfaces have shown that in addition to
the surface recombination centers there exists a class of surface states, or
traps, which possess a relaxation time of the order of seconds or minutes and
a density greater than
1013/cm
2By modulating the surface
conductivity with
external electric fields ("field effect" experiment) at sub-audio frequencies,
it has been found that the capture time
of these traps varies
from spot to
spot
along the surface, with a distribution function for X
which is
approxi-mately
proportional to 1/ up to
times greater
than 100 seco It is proposed
that 1/f noise in germanium filaments arises from a fluctuation in the
occu-pancy of these traps.
The filling and emptying of the traps can alter the
conductivity by producing (1) changes in the majority carrier concentration
near the surface, as required to maintain charge neutrality, and (2) an
in-jection-extraction of hole-electron pairs, due
to a complex interaction
between the surface recombination centers and the traps. Using only the
information supplied by the field effect experiment, the two processes have
been analyzed and found to give a 1/f noise of the correct order of magnitude.
To obtain this quantitative result,
it is sufficient to specify only the
dimensions of the sample and the bulk and surface potentials; neither the
origin of the 1/
distribution nor the trap energy level and density need be
known.
Because of the long capture times, it is necessary to assume that
the traps are located in or on the oxide layers separated from the germanium
by a potential barriero
The observed temperature insensitivity of the time
constants suggests that electrons communicate with the traps by tunneling
through the barrier, in which case a 1/t distribution would result from an
approximately uniform distribution of barrier heights or widths.
The latter
may occur in a
natural manner either from a homogeneous distribution of the
traps throughout the oxide layer, or, if the traps are produced by adsorbed
ions, from a small variation of the oxide
thickness
over the surface
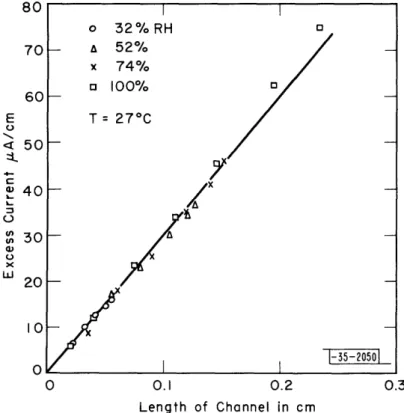
0There are two distinct types of excess reverse currents observed in p-n
junctions:
a water-induced leakage current which flows externally to the
germanium, and a
"channel" current, which occurs whenever a strongly n- or
p-type surface increases the effective rectifying
area
of the junctions
Measurements of 1/f noise in reverse-biased p-n junctions have shown that
the noise associated with the leakage current varies roughly at V
2G, where
V is the applied voltage and G is the conductance of the leakage
path, while
the noise associated with the channel seems to vary as
Ic2
VV2, where Ic is.
the channel currento The first relation suggests that the leakage path is
composed of many parallel paths, each of whose conductance fluctuates
inde-pendentlyo The channel noise may be caused by fluctuations in the rate of
This report is identical
with a thesis submitted to the Department of
Electrical
Engineering in partial fulfillment of the requirements for the
degree of Doctor of Science at The Massachusetts Institute of Technology.
i 1
r---generation of hole-electron pairs at the surface or by fluctuations in
tle
surface conductivity.
By
combining the proposed 1/f noise theory with a
somewhat imperfect model of the channel, it has been possible to analyze
both mechanisms. While neither calculation leads to exactly the empirical
Ic2V1/2 relation, the one based
on
conductivity fluctuations gives a larger
value for the noise which is of the right order
of
magnitude.
Although most of the devices exhibiting l/f noise differ from germanium
filaments in that the current passes through potential barriers, essentially
the same model may still apply. Fluctuations in the resistance can be
pro-duced by traps located in the barrier region, since a variation in the trapped
charge will cause a variation in the height of the barrier. If the trap
communicates with the bulk by electrons tunneling through the barrier, then
a l/f spectrum will be obtained if the traps are simply distributed uniformly
throughout the barrier region.
This idea has been explored by using the thin
oxide layer on alvuminum to form a potential barrier between the base metal
and a mercury drop.
It has been found that such contacts produce a large l/f
noise with the usual characteristics and that a tunneling process is suggested
by the temperature independence of the dc resisclance, but the experiments have
not been carried far enough to establish the noise model.
iv
The author wishes to thank Professor R. B. Adler
and Professor J E Thomas, Jr. for their helpful advice
and criticism throughout the present work. He is
es-pecially indebted to R. H Kingston both for many
stimulating discussions as well as for actual
collabora-tion on much of the experimental work. M. Green is also
to be thanked for several suggestions regarding
experi-mental
technique and for a number of discussions of the
physical chemistry of
germanium surfaces.
V
Abstract Acknowledgement Chanter I Chapter II. Chapter IIIo Chapter IV. Chapter Vo Chapter VIo Appendix A Appendix B Appendix C INTRODUCTION
RELAXATION TIME OF SURFACE STATES IN GERMANIUM 1/f NOISE IN GERMANIUM FILAMENTS
CHANNELS AND EXCESS REVERSE CURRENT IN p-n JUNCTIONS 1/f NOISE IN p-n JUNCTIONS
EXTENSION OF NOISE MODEL
References vii 3ii V 1 17 32
51
69
88
96
100 105 110INTRODUCTION
As is well known, all resistive devices in thermal equilibrium show a
mean-square voltage fluctuation across their terminals equal to kTRAf in
any frequency interval Af (at least up to the infrared regions)o In general,
the application of a d voltage or current will result in an additional
amount of noise. Two classes of non-equilibrium fluctuations which are
fre-quently observed under such circumstances and which have been the subject of
much experimental and theoretical study are shot noise and l/f noise.
Although we will not be concerned with shot noise here, it may be well
to mention that the
term is
now applied to a much
wider class of fluctuations
than
just the random emission of electrons from the cathode of a vacuum tube.
The analogous current fluctuation in a point-contact or p-n junction rectifier
is called shot noise, and the name is also commonly used to describe the noise
produced by random fluctuations in the number of charge carriers in a
semi-conductor.
1The power spectrum associated with shot noise is flat out to
the reciprocal of some characteristic time (eg, the transit time of the
electrons in a vacuum tube or the lifetime of the carriers in a semiconductor)
and then falls off with increasing frequency.
In contrast to this type of spectrum, many devices when biased with a
dc current show an excess noise power which roughly obeys a l/f
nlaw, where
n is approximately unity (1 to 15). Such a spectrum was first observed in
vacuum tubes, where it is known as "flicker noise"; but it also occurs, for
example, in carbon microphones and resistors, thin metallic films,
point-contact diodes and transistors, junction diodes and transistors, and even
single-crystal germanium filaments. In carbon microphones and resistors
-2-this noise is called "contact noise", because it appears to arise at the
contacts between the carbon grains, but the whole class of such fluctuations
is generally known as l/f noise" or "excess noise". Two other significant
characteristics of this type of noise are that the mean-square voltage
fluctuation increases approximately
with the square of the dc biasing
current and that
the
amplitude is not strongly temperature dependent.
Be-cause of the
current dependence, 1/f noise is usually interpreted as a
resistance fluctuation
0The frequency range over
which the approximate 1/f law holds is truly
remarkable. Although it cannot
be obeyed over an
infinite
range because
the
total power must be finite, no low-frequency or high-frequency cutoff
points have ever been observed for any of the above devices,
Rollin and
Templeton
2have measured the noise for both carbon resistors and germanium
filaments down to 25x10
-4cps and found no significant deviation from a
l/fn spectrum.
For point-contact
diodes measurements
have recently
been
pushed down to 6x10⁻⁵ cps with the same observationo
3At the other end of
the spectrum, the l/f noise appears to fall below thermal or shot noise
before
the
high-frequency cutoff point occurs
0For carbon resistors4 and
point-contact rectifiers,
5however, the 1/f noise is often still dominant
at
1
Mco In these two cases one must therefore account for
a
l/f law over
at least
10
or
11
decades of frequency.
Equally as remarkable is the temperature range over which l/f noise
is observed
0Templeton and MacDonald
6measured the noise in carbon resistors
from 290°K to 4o2
0K over a frequency range from 20 cps to 10 kco Not only
did they find that the 1/f noise still existed at these low temperatures,
but also that the magnitude did not vary by more than a factor of ten over
the entire temperature range. Russel7 had previously reported that noise measurements between 100 and 5x10⁵ cps on ZnO crystals at liquid helium
temperature showed a l/f spectrum with an amplitude insensitive to tempera-tureo Several other sources of l/f noise, including point-contact rectifiers8
and germanium filaments,9 have been measured down to liquid nitrogen
tempera-ture (770K) with similar results. In the case of germanium filaments,
Gebbie1O has recently found at low temperatures a shot noise spectrum,
apparently due to a trapping process, superimposed on the l/f spectrum. Although this means that one must be very careful in interpreting low-temperature measurements on semiconductors, Gebbie's results are still in
agreement with the general observation that l/f noise noise is not strongly temperature dependent.
The similarity of the l/f noise from the various devices mentioned above of course leads one to look for a common mechanism; but so far there has not been a really satisfactory explanation for even one of them. The basic diffi-culty is that a l/f spectrum, in contrast to a shot noise spectrum, does not appear to be characteristic of any elementary process. In fact many of the physically reasonable mechanisms for modulating the resistance give just a
shot noise spectrum. However, it has been known for some time that by
super-imposing shot noise spectra of the type r/[1 + (d) 2], with a distribution
function for the time constant u which is proportional to 1 , a l/f spectrum
can be obtainedoll Since the l/f law may be obeyed over 10 decades or more
of frequency, this approach requires that the 1/r distribution of time
constants cover a correspondingly large range. One plausible way to achieve
the desired result, which was proposed at about the same time by van der Ziell1 2
and duPr 13, will be outlined next.
_I_ _
WICII1-C
Ill-l-·l--_1YlllslliPIIIIIIIIIIL·IIILII
.- ----
--l--ll.--IULI··li·I·l·UI1IP
Suppose that the time constants arise from a process involving an
activation energy, such as the adsorption-desorption of an ion or the
diffusion of an ion, so that
Xis of the form
X= To exp (E/kT), (lol)
where E is the activation energy. A uniform distribution of energies between
E
1and E
2will then correspond to a 1/¶ distribution for r
between
sl
=exp (El/kT) and
2 =exp (E
2/kT)o Hence if the noise is produced by
a large number of independent processes, each of which gives a shot noise
spectrum of the form x/ [1 + ()2]
,
with
Xdistributed as just described,
then the total power spectrum will be
G()
2 1
22
1
(1.2)
2kT E1 (ta2 tan )
E2 E1 2i
If in the frequency range under consideration Wt1 < 1I " 02' then
G(c)
ackT
(1.3)
E
2- E
1c
Although both 1 and r2 are exponentially dependent on the temperature, the
power spectrum will only be linearly dependent on T if
E
1<< kT In (l/or
o )(1.4)
E
2>> kT In
(l/w
o)
in the frequency and temperature range under consideration
As simple as these two requirements may appear, the first one cannot
be met at very low temperatures by ionic processes. For the parameter
o in this case cannot be smaller than the reciprocal of the "jumping frequency",correspond to the time that it takes a diffusing ion to make a single jump
or the time that an adsorbed ion remains on the surface. From (14)
we find
that just to explain the room temperature measurements up to a frequency of
1 Me, we need E
0°35 ev. But the l/f spectrum has been measured up to
that same frequency at liquid nitrogen temperature and past 10 kc at liquid
helium temperature. To account for the liquid nitrogen data we would have
to have
009 ev and for the liquid helium data
EC 0007 ev. Since
the last figure is more than an order of magnitude smaller than activation
energies for highly mobile ions diffusing on the surface, and two orders of
magnitude smaller than values for bulk diffusion, we can immediately rule
out such processes. The same conclusion holds for adsorption-desorption
processes, although in this case there is no need to go through any
calcu-lation--all of the other gases liquify before helium.
Thus
far the discussion has been for 1/f noise which was built up
from a superposition of shot noise spectra. By using what appear to be
highly specialized models, Richardson
15and Bess
16have been able to get
1/f spectra directly from ionic diffusion processes. However, regardless
of the detailed workings of a particular model, it is apparent on physical
grounds that if F
1is the minimum activation energy involved in the
diffusion process and
v
is the jumping frequency, then the most rapid
fluctuations cannot have a time constant smaller than the order of
(1/1v) exp (/kT)o
Hence the l/f spectrum must begin to cut off at
fre-quencies of the order of co
=
exp (-E/kT), which leads to exactly the
same results as before
.Perhaps in some devices at higher temperatures an
ionic process may play an important role. But if one is looking for a
single model to explain all 1/f noise, then diffusion or adsorption of ions
can be eliminatedo
It should be mentioned that Macfarlane
1 7had at one time proposed a
diffusion mechanism which, with a single activation energy E, apparently
gave a 1/f-like spectrum extending indefinitely far above
=
vexp (-E/kT)o
18
This paper contained an error which was pointed out by Burgess;
the
corrected spectrum does not resemble a 1/f law over any frequency range.
1/f Noise in Germanium
One wholly electronic mechanism for l/f noise was proposed by Shockley
1 9 to explain Montgomery's data for germanium filaments 9 Montgomery had foundstrong evidence that the resistance modulation was due to a fluctuating
minority
carrier concentrationo The noise amplitude was affected by magnetic
fields in a way which corresponded to the change in the lifetime of the
minority carriers, and the noise voltages measured across two adjacent
segments of the filament were correlated with a time lag of approximately
the minority carrier transit time.
For discussion purposes let us consider the case of an n-type filament.
Shockley proposed that the fluctuation in the hole concentration might arise
from the
injection of hole-electron pairs from regions
which were less n-type
than the neighboring parts of the crystal, or which were actually p-type
inclusions.
Such injection will take place if these regions contain
recom-bination centers, for an applied field will sweep out the excess holes and
thus reduce the recombination rateo Since the generation rate remains
constant, the region acts as a natural source of hole-electron pairs
0So
far this would only give a shot noise spectrum. However, Shockley pointed
out that the ability of a recomibination center to absorb or emit hole-electron
pairs can be modulated by the emptying and filling of an adjacent trap
If
one could obtain a l/f spectrum for the trap modulation, then the regions
would produce a /f
noiseo
20It was implied that
a
uniform distribution of
energy levels for the traps gave the desired result. But as is shown
in Appendix A, this procedure will not lead to a l/f spectrum if.
the
traps act independently and if one is trying to get the distribution in
time constants from the variation in activation energy for the release of
a trapped carriero The reason is that the trapping and releasing of a
carrier is a two-parameter process, which does not give rise to just a
T/ [1
+
(T)
2] spectrum.
Since the model which will be proposed later borrows some of Shockley's
ideas, we will discuss his theory in more detail at that time. One additional
point should be mentioned now, howevero Montgomery made his original
measure-ments before Herzog and van der Ziel21 had reported experimental evidence
for shot noise in germanium filamentso The effects of shot and l/f noise are
therefore not separated in Montgomery s published results. When the
experi-ments were repeated, exercising proper precautions to insure that only /f
noise was being measured, he was unable to get consistent results from the
magnetic-field experimentso The correlation effect apparently still existed,
but the delay time could not be compared with the transit time of the minority
carriers under the revised experimental conditionso
22It seems quite clear at the present time that 1/f noise in germanium
single crystals is predominantly a surface phenomenon; in fact there is every
reason to believe that it is entirely so. The now-questionable
magnetic-field experiments, and other work of Montgomery, had suggested that the
surface was the origin of the noise, but more recent results leave little
doubt. For example, Maple, Bess and Gebbie
3have found that a 10 to 20 db
increase in l/f noise, with no accompanying increase in the filament lifetime,
may be produced by switching a filament from a dry nitrogen ambient to one of
carbon tetrachlorideo They have also obtained changes of several db in going
from dry to wet ambients° In other cases, apparent changes in the shape of
the spectrum were observed. The effect of surface treatment on noise
magnitude is even more striking in point-contact rectifiers or p-n junctions.
24
Kennedy
was able simultaneously to ruin the rectification characteristics
and greatly increase the noise in reverse-biased junctions by such techniques
as heating the diode or changing
the ambient gas. However, the unit could
always be restored to its former condition merely
by re-etching, indicating
that only surface
changes had occurred
Furthermore, he found that if he
placed a freshly
etched
and washed
junction in a vacuum while
it was still
wet, the junction was far less noisy than if it had been allowed to dry in
the
open air first
0In Chapter
V
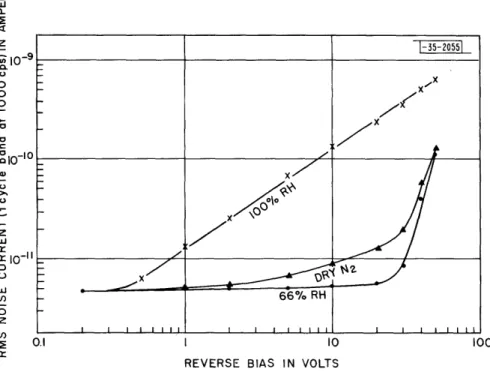
we will present some measurements for p-n
junctions which show
that only a small
change in the relative humidity can
increase the noise level by 30 db or more
0Even without this experimental evidence, one might have looked to the
surface for an expalanation of the 1/f noise, simply because it does not
seem possible to obtain the required range of correlation times from the
bulko
For ionic diffusion processes
we have already shown that activation
energies as low as
0ol ev would be
necessary to account for the
high-frequency data at liquid nitrogen temperature. This is far too small for
bulk diffusion in single crystals
0The only electronic process which has
been found to give the very long times needed for 1/f noise is trapping.
In luminescence and photoconductivity work, trapping times of hours and days
have been observed from some semiconductors However, for germanium no such times as these have ever been reported for bulk trapping, even at low tempera-tureso Times of 104 sec are many orders of magnitude greater than what
might reasonably be expected from present day germanium at room temperature. Furthermore, there has never been any indication of a distribution of time constants in bulk germanium, which would be needed if one tried to build up a 1/f spectrum from elementary shot noise spectra.
All of this is in sharp contrast to the surface. There is now experi-mental evidence not only for long-time processes at the surface, but for a
distribution of time constants as well, In the next section an outline of
the present picture of the germanium surface will be given.
Surface of Germanium
It is now well established that at the surface of germanium there are localized electronic levels with energies in the "forbidden" region between the valence and conduction bandso Charge residing in such "surface states", or in adsorbed ions (which will also be considered as surface states), is neutralized by a space charge region extending into the germanium to a depth
of
104
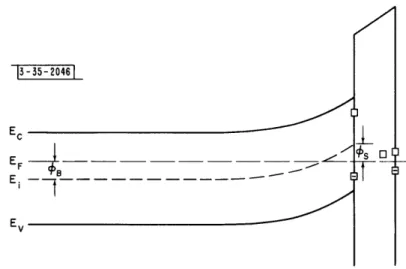
to 106 cmo The resulting double layer may produce a sizableequili-brium difference in potential between the surface of the germanium and the bulk, as illustrated in Fig, 1-1, By a suitable choice of the gaseous ambient, it is possible to make the surface either strongly n- or p-type,
irrespective of the bulk conductivity type. The space-charge region is
conveniently described in terms of the parameters cB and s which are,
respectively, the bulk and surface values of (EF - Ei) As usual is the
Fermi level and Ei is the energy corresponding to the Fermi level for
intrinsic material (approximately the center of the gap). These quantities
13
EC
EF Ei
Ev
Fig. 1-1. Energy level diagram at germanium surface.
are shown in Fig. 1-1. There is normally a thin oxide layer on the surface
of germanium, which has been indicated in the energy diagram by a potential barrier. The scale is greatly exaggerated, however, since the film is usually 20 to 50 A thick.
The existence of surface states and space charge regions at the free
surface of a semiconductor was proposed some time ago by Bardeen2 5 to explain
certain anomalies in metal-semiconductor rectification. More direct evidence for surface states was provided shortly afterward by an experiment of Shockley
26
and Pearson, in which they attempted to modulate the conductivity of a thin
evaporated film of germanium by applying an external electric field normal to
the surface. Since the change in the conductivity was only about 10 per cent
of what had been expected from the magnitude of the induced charge and the free carrier mobility, it was necessary to assume that there were localized levels at the surface which could absorb and thereby immobilize the majority
established by the work of Brattain and Bardeen 7 on the variation of contact
potential with gaseous ambient and light. These experiments, in conjunction
with measurements of the surface recombination velocity, led Brattain and
Bardeen to propose that there were two sets of surface states at the
germanium-germanium oxide interface, one near the conduction band and the
other near the valence band.
Recent experiments on the modulation of surface conductivity of single
crystal germanium by external fields,2 8 3 2 together with measurements of surface
conductance on junction transistor structures,
33 36have now provided a much
more detailed picture of the surface
0These experiments indicate that there
are two distinct classes of surface states in germaniumo The first type is
chiefly responsible for the high rate of recombination of holes and electrons
at the surface, and probably consists of two or more levels in the manner
suggested by Brattain and Bardeen. The other type of states have relaxation
times of the order of seconds and minutes and, as we will show in the next
chapter, possess a distribution of time constants. They are distinguished
from the recombination states by these long times and by the strong dependenceof their density and energy on the gaseous ambient. Because of the long time
constants of these states, it would be almost impossible for them to be
located at the germanium-germanium oxide interface. A much more plausible
assumption is that they are either localized levels in the oxide layer or
ions adsorbed onto the outer surface of the oxide. These slow states appear
to be primarily responsible for the experimentally observed clamping of OS at a position which is a critical function of the surface history andenviron-ment,
but which is practically independent of the bulk resistivity or the
----s_l-fs^-.·----x___._l---
-12-presence of external or internal fields. Their density must be greater than
10
13/cm
2to account for such action
25The density of the recombination states, on the other hand, seems to be
much less than the original estimate of 104/cm
2made by Brattain and Bardeen.
25Evidence has .been found
36for one set of states located about
0O15
ev below
the center
of
the energy gap with a density
of
around 10
11/cm
2, and
it
appears
that there are states above the center of the gap with a density of the same order of magnitudeo31 The physical origin of the recombination states is not known, and as a result it is not clear whether their density and energy can be affected by the gaseous ambient.
Very little is known about the oxide layer which forms on an etched germanium surface. The stoichiometric composition has not been determined,
nor is it known whether the film is amorphous or polycrystalline° Using
electron diffraction techniques, R
D
Heidenreich, as quoted by Brattain
and Bardeen,27 found a film thickness of less than 10
immediately after a
CP-4 etch, and a thickness between 20 and 50 A after the surface had aged.By
measuring the amount of oxide which is dissolved off in water, Green
3 7 has arrived at similar estimates. Fortunately it will not be necessary toprobe too deeply into these matters here; the existence of the film and a
rough idea of its thickness will be sufficient for our purposes.
Proposed Model for lf Noise in Germanium Filaments
This thesis will be concerned primarily with some of the effects pro-duced by the slow surface states. In particular it will be proposed that
l/f
noise is caused by a fluctuation in the charge of these states. Although
the detailed quantitative arguments will be presented in Chapter II,
we will
now describe qualitatively how the l/f noise could arise.
--actually produce conductivity fluctuations in the germanium in two distinct
ways. In order to see this, let us focus our attention on a small region of
space surrounding one trap and ask how the concentration of holes and electrons in that region changes with time. Since thediot noise produced by the motion of the individual carriers is not being considered here, the rapid fluctuations in concentration due to carriers simply wandering through the region may be smoothed out by suitable short-term averaging. What we are interested in is the long-term, quasi-equilibrium change in concentration which occurs when one of these wandering carriers becomes trapped and remains in the region for a long time in the form of a localized, immobile charge. If a majority
carrier is trapped, it is quite apparent that the (short-term) average number of free majority carriers in the region is reduced by almost one to preserve charge neutrality (a fraction of the charge is neutralized by a small average increase in free minority carrier concentration). If a minority carrier is trapped, it might be thought at first that the average number of free minority carriers in the region would be reduced by almost one. This is not the case, however. The trapped minority carrier is simply a localized charge, and like any other charge will be neutralized mainly by majority carriers. The number of minority carriers will decrease only slightly, while the average number of majority carriers will increase by nearly one. Therefore, whether the
trapped carrier is a hole or electron, the conductivity of the region will change by an amount corresponding to the gain or loss of approximately one majority carrier, and the change will persist for the duration of the trapping.
This is the first type of conductivity modulation that will be considered. For a further discussion of trapping, the reader is referred to papers by Fan3 8 and by Haynes and Hornbeck.3 9
Unfortunately, the change in majority carrier concentration cannot
account for the correlation effects observed by Montgomery; 9 the conductivity of each small region of the surface would fluctuate independently of the
other regions. However, there is a second effect which can come about
through the behavior of the minority carriers. The preceding discussion
indicated that their concentration will change slightly when a hole or
electron was trapped. If no voltage is applied to the sample, the magnitude of the change will be such as to maintain the thermal equilibrium p-n
product. But with a field present, the minority carriers will be swept down the sample, and as a result their concentration in the vicinity of the trap will be returned to substantially the (thermal) equilibrium value. Therefore, the average p-n product will be changed. Hence, if recombination centers exist within the affected region, the recombination rate will be altered, while the generation rate will remain constant. The region can
then act as a net source or sink for hole-electron pairs as long as the
trap remains chargedo This injection or extraction process will produce a change in the conductivity of the sample which is correlated over approxi-mately a life-path for the minotrty carriers° Thus the interaction between traps and surface recombination states can give another type of conductivity fluctuation which would account for Montgomery's results. As will be shown in Chapter III, the two processes are of competing orders of magnitude. Except for the correlation experiment, there would not be any reason to emphasize one over the other.
While the injection extraction process described above is similar in some ways to Shockley's model, and was indeed suggested by his theory, it differs in two important respects. First of all, there are no further
recombination states and slow states or traps, for which there is now direct
experimental evidence. Shockley s model, on the other hand, required the
additional existence of certain crystalline imperfections. Although such imperfections were undoubtedly present in germanium samples several years ago, it is unlikely that they exist today. In fact this is probably the reason
why present germanium filaments appear to be less noisy than is indicated by
Montgomery's original measurements, It could well be that Shockley's mechanism, or something similar to it, was then operative (though not with his method for obtaining the long time constants) and produced an additional amount of noise.
The second difference is somewhat complicated and will be taken up in
more detail in Chapter V Briefly it is this, In Shockley's model the noise
was obtained by a modulation of the generation rate of recombination centers
in a fixed region, If the minority carrier concentration were reduced to
zero, then the maximum amount of noise would be produced, In the above theory
just the opposite would happen, The noise is obtained in this case by a.
fluctuation in the pn product, which produces a corresponding fluctuation in the recombination rated but the generation rate is assumed to remain
fixed, Hence if the pn product were reduced to zero along the surface, an
average current would be obtained; but there would be no fluctuations in this
current other than shot noise, The experiments discussed in Ciater VT seem
to favor such a situation,
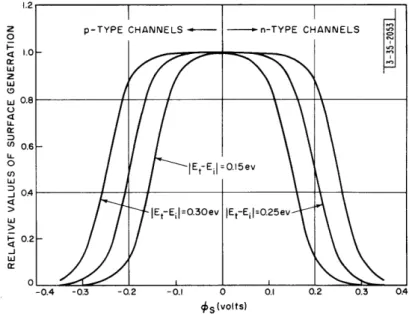
Actually the generation rate will change if <bs > Et - E. , where
Et is the energy level of the recombination centers. Since Et E. appears
to be from 0,15 to
0O2
ev, this condition would only be met for a rather
strongly n- or p-type surface, For such surfaces, the slow traps can produce
-16-a third type of noise by modul-16-ating the gener-16-ation r-16-ate of the recombin-16-ation
centers, as proposed by Shockley. These matters will be discussed later,
In Chapter III it will be shown that with a single trapping time T for
free carriers, both the modulation of the majority carrier concentration and
the injection-extraction mechanism lead to a shot noise spectrum of the form
r/L1 + (cot)
2J]
To obtain a 1/f spectrum we need a 1/r distribution for
these time constants.
The experiments to be described in the next chapter
have given evidence for just this distribution.
RELAXATION TIME OF SURFACE STATES IN GERMANIUM
The original experiments of Shockley and Pearson
2 6on the modulation of
surface conductivity of germanium by external electric fields are difficult
to interpret since they were performed on polycrystalline evaporated films.
As mentioned in Chapter I, this "field effect" experiment has recently been
studied in more detail on single crystal germanium by several investigators.
28-32
This work has shown that when a voltage is suddenly applied to a
parallel-plate condenser formed by a metal electrode and a thin slab of germanium, the
conductance of the germanium is modified in a rather complex manner. First, a
change corresponding to an induced charge of mobile majority carriers occurs
within the RC charging time of the circuit. Then as the majority carriers,
minority carriers, and surface recombination centers come to mutual equilibrium,
the conductance increases or decreases (with a time constant of the order of
the minority-carrier lifetime) to a new quasi-stable value. Finally, the
con-ductance slowly decays back to practically its original equilibrium value,
with a half-life for the decay ranging from a few milliseconds to several
seconds depending on the surface treatment and the gaseous ambient. It is
this last decay, and similar ones observed from inversion layers on
tran-sistors,
34 -36that require the existence of a second class of surface states.
The initial change in conductance and the transition to the quasi-stable
state have been studied by Low,
2 9while Brown and Montgomery
31' 32have used
the quasi-stable value of the conductance as a means for determining the
density of the surface recombination centerso We will not discuss this work
further, since the primary interest here is in establishing a connection
-18-between the slow states and l/f noise. For this purpose an experimental investigation of the slow decay was carried out in cooperation with R. H.
Kingston.30 In the next section we will present some of the results of that
study.
Experimental Study of the Relaxation Time
The samples used for the experiments were in the form of slabs, about
0.5 x 0.25 x
0.01
inches, cut from germanium which was nearly intrinsic at
room temperature. Ohmic contacts were attached along the ends of the sample
and a plane metal electrode was placed approximately
0.01
inches from the
surface under study. The whole assembly was placed in a glass chamber which
could be supplied with various gases and water vapor. The conductance
measuring circuit was similar to that used by Low, except that it incorporated dc coupling and amplification for observation of the long-time relaxation
effects.
Initial experiments were performed using a square-wave voltage on the
electrode to determine the transient
response.
In addition
to the unusually
long times already discussed, it was observed that the decay was always non-exponential. One might suspect a non-linear phenomenon. However, with the exception of a near-intrinsic surface, the response was found not only to be symmetric with opposite field polarities but also to vary linearly with applied field. The non-linearity in the near-intrinsic case is to be expected since here the surface conductance is near its minimum value and will increase for a small induced charge of either sign.
On the basis of these observations it seemed apparent that the decay
could be explained in terms of a
set of
traps having a distribution of time
constants. While it is possible to analyze the relaxation transient as a sum
·C-of simple exponentials, a more accurate method is to determine the amplitude
of the conductance variation produced by applied sinusoidal electrode voltages.
The relative response of the conductance as a function of the frequency of the
driving signal will give the same information as an analysis of the transient.
Data of this form were obtained by applying to the electrode a
constant-amplitude sine wave, approximately 400 volts peak-to-peak, in the frequency
range from 10
-2to 103 cps. The system was found to be linear over this
range of frequencies and also over a 10 to 1 change in amplitude.
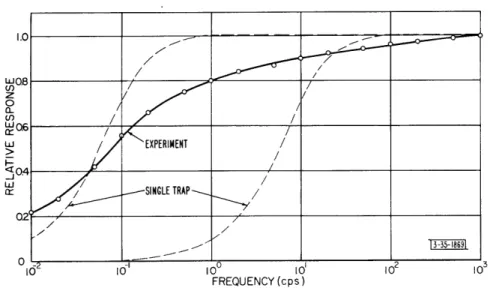
The results for a typical run are shown in Fig. 2-1, in this case for
a freshly-etched surface exposed to dry nitrogen, with the response normalized
to unity at 1000 cps. To minimize minority-carrier injection effects, which
can give a spurious high-frequency response, the back surface of the slab was
sandblasted, thus reducing the lifetime to the order of 5 microseconds for
the dimensions used. The dashed lines in the figure represent the response
to be expected if all of the traps had the same time constant, corresponding
to a simple exponential decay in the transient case. As expected from the
transient behavior, the frequency response does not fit the curve for a
single trapping time, but instead falls very gradually over many decades of
frequency, still continuing in this case at 10
-2cps. Similar frequency
curves were taken after various surface treatments. It was known from the
transient behavior that the relaxation time was a critical function of
gaseous ambient and surface history. Exposing a freshly etched sample to
oxygen or air for several hours, for example, would always increase the decay
time quite markedly. Also, for both a freshly-etched surface and a
well-oxidized surface, wet nitrogen produces a more rapid relaxation than dry
nitrogen. The effect of the water vapor is actually strong enough to
-20
-FREQUENCY (cps)
Relative frequency response of surface conductance taken in dry nitrogen before oxidation.
FREQUENCY (cps)
Fig. 2-2. Relative frequency response of surface conductance for several surface treatments.
Fig. 2-1.
I
0
o , a >1 I: -·counteract the effect of the oxidation: the decay for an oxidized surface in wet nitrogen is faster than for a freshly-etched surface in dry nitrogen. Typical frequency response curves for these cases are shown in Fig. 2-2. The "before oxidation" curves could not be obtained until approximately one-half hour after etching, since the surface was relatively unstable during the
initial period and the steady drift in conductance made low-frequency measure-ments impossible. By observation of the transient response, however, it was found that during this period the time constant increased from a small value, of the order of several milliseconds, to a value in the 0.1 second range when the surface became stable enough to measure. The terms "before oxidation" and "after oxidation" should only be taken to mean before and after exposure to oxygen. At the present time the chemical behavior of a surface after etching and exposure to oxygen is not well understood. However, a general change in surface properties with time has also been observed in measurements
of contact potential27 and surface conductance;3 4 and, as mentioned in
Chapter I, the surface film does appear to thicken.
A few measurements made in a vacuum of .Oo1 mm Hg indicated that the
decay rate did not differ markedly from that in dry nitrogen, but the results are only qualitative. A better understanding of the chemistry of the surface is necessary before any quantitative data would be meaningful.
Even more interesting, especially from the standpoint of the noise theory to be presented later, is the fact that measurements made in nitrogen at temperatures close to that of liquid nitrogen actually showed a faster decay than at room temperature. This last result must be considered somewhat tentative because the role of bulk trapping3 8 ' 3 9 in these experiments is not completely known, Since illumination had no strong effect on the behavior,
.·YI1)I_-IIPX_-_II_---_-it is believed that the observations are valid. In any case, as observed
both in this work and by Kingston
34on n-p-n junction structures, there is
no appreciable change in the relaxation time for a wet surface between room
temperature and 25°Co
Analysis
The
slow time constants observed in these experiments are a measure of
the
rate at which
electrons are transferred between the bulk and the states
in,
or on,
the oxide layer. For the sake of discussion, consider the decay
of excess electrons from the bulk into the surface states (the reverse rate
may be shown to be equivalent by detailed balancing arguments)o The limiting
process for this decay could be either the transition rate of an electron to
existing states, as in a normal trapping process, or the rate of creation of
new levels. We must consider the latter as a possibility, since new states
may be created either by the physical adsorption of additional molecules or
by a chemical reaction between species present on the surface.
However, adsorption as the rate-limiting process can be ruled out at
once because the time constants are not strongly pressure dependent
It
should be mentioned that the decay in photoconductivity of ZnO after the
removal of the light is remarkably similar in appearance to the decays
observed here, and that for the ZnO this transient has been explained in
terms of an adsorption-desorption process.
4But since the decay in ZnO
is definitely non-linear (the rate varies with the light intensity), it is
not related to the strictly linear process found here
0The temperature independence of the decay, on the other hand, makes it
almost impossible for a chemical reaction to be the determining factor
0Certainly any reaction involving water can be eliminated, even without the
liquid nitrogen data, since there is no marked change as the temperature is lowered far past the freezing point.
Thus an electronic transition to existing levels seems to be the only reasonable explanation for the long time constants. We will not have to assume anything more about the physical processes involved. The rest of the analysis for the field-effect experiment, and the calculation for the 1/f noise, can be made without recourse to a more specific model. At the end of the next chapter, however, we will show that a tunneling process for the electron
transfer can easily account for both the relative temperature independence and the required distribution of time constants.
The following discussion will be confined to frequencies which are low compared with the reciprocal of the lifetime, so that we may always assume that the majority carriers, minority carriers, and surface recombination
centers are in mutual equilibrium. The recombination states can then be
ignored in trying to explain the frequency response curve for the conductance variation. In the frequency range under consideration they simply absorb a fixed percentage of the added free carriers, an effect equivalent to changing
the scale factor for the conductance variation0
We will first consider the case where all of the traps have the same
characteristics. The form of the frequency response can of course be obtained
directly from the transient behavior, but the object of the analysis will be to get an explicit relation for the time constants in terms of the other parameters of the system.
In addition to the usual notation, the following symbols will frequently be used:
-·---
-24-nsP = concentration (no./cm3) of electrons and holes, respectively, at
~sJps
the surfaceNt = concentration (no./cm2) of traps
nt,pt = concentration (no./cm ) of full and empty traps, respectively.
Et = effective energy level of the traps
cn = probability per unit time that an electron is captured by an
empty trap
cp = probability per unit time that a hole is captured by a full trap
Then the net rate in increase of electrons in the traps will be
_ -EI, _Et- v
dt = ( Pjc-.NcCc, -
(psrlcp
PP
4, 'vC-pe ') ,(2.1)
where the usual step of going through a detailed balancing argument has been
omitted. For a justification of (21), the reader is referred to the treatment
of recombination statistics by Shockley and Read0o l Denoting the equilibrium
values by nso, Pso, etc., and the deviations from equilibrium by ns, Sps'
etc., we obtain for the linearized form of (2.1)
dcnt - ptc n in -r 0c sp
p
[Cnr(risorns - Cp(Pst Ps,,)] ntEk_-~- N7 E - E' (2.2)
+
Ce-
KT-( E-- Et) + Po NV CpP_ e K - - / (.where in notation similar to reference (41)
Ec- X
n$ = Nr e
E-E (2.3)
The terms involving S(E Et) comes in for traps located outside of the
c
germanium-germanium oxide interface since the presence of an applied field
can then change the value of (Ec - Et)o
We will often need the relation between En and the total increase in
electrons/cm2 in the conduction band, which we may denote by SN, together
with an analogous relation between ps and the increase of holes/cm2 in the
valence band, denoted by sP. For this purpose it is convenient to define two quantities, No and P, by
Et4/o
=
<:
/,so
(2.h)
P/.
-
PS /ps
(2.4)
For the linear case we have been dealing with, it is shown in Appendix B that
(2.5a)
where Eso is the equilibrium field at the surface with positive direction outward, and p and no are the equilibrium bulk concentration of holes and electrons, respectively. If there is no surface space charge and Eso = 0, then (2.5a) takes the form
No 2 -- L
tli·-tP.~ fZ.2b)
where
-Lp
(2.6)
We will refer to LD as the Debye length, although it differs by a factor
[(no+ po)/2ni]l/2 from the definition used by Shockley.42 If the germanium
is nearly intrinsic, as was the case for the field effect measurements, then
for either an n- or p-type surface
where
is (th5eDebye lg c ue (rfrooSm.)
L
P(2.7)
where LDs is the Debye length computed from the surface concentrations.
-26-We will first use these results to show that the terms involving
8(E
c - Et) in (2.2) may be neglected to a first approximation. For considerthe ratio of the first and fourth terms on the right hand side of (2.2):
Po
,n 0 r h
~rns
airr N'e ___ - , kT.
Al/
e
~-~----t.. A/c
e . TE : (2.8)Let E be the field in the oxide and w be the thickness of the oxide layer. Then from (2h4) and (2.7), assuming the dielectric constant of the oxide is about the same as that of the bulk germanium,
_IS_ /s o K E/V.[o P ) ./ _ o (2.9)
for nearly intrinsic germanium. Since 0 f+Po) the gaseous abients
for nearly intrinsic germanium. Since d s 500 i for the gaseous ambients
used and w 50 i, the ratio is greater than 10. Similarly, the second term
in (2.2) is more than ten times greater than the fifth.
With sinusoidal (ejet) excitation and the above simplifications,
equation (2.2) becomes
Sa Ed- C JP
-K
-)Cp
&F' LC,,q(rtq)
i£t
n
( 2.10)
where as usual the factor eje t has been omitted from all terms, If the
capacitance between the electrode and the germanium is C f/cm 2 and the applied
voltage is V, then the charge induced in the germanium is
,Q
_-(P-
gA-
£n = C£/. (2.11)From the assumption that the majority and minority carriers are in equilibrium at the frequencies of interest,
(2.12)
Substituting (2.10) and (2.12) into (2.11) and using the definition of No and P from (2.4), we obtain
Ci (W P.) En ptO C" +- 4 Cps . (2.13)
or solving for ns/nso
, _ _ Cv
tn)
Cp(po+ Cotpt,
j (2.14)3-I-.,
(j thatlD+X
,i,~An, 4- Cp (p,,,+ ,) C" 4P (2. 1a)If we define
Ir
= ,
z
~~~~~~,
(2.15)
(No
P.)FCn
) n) + cp (+p, )+C
47*rFeO'r
then we may rewrite (2o14) in the form
' C
cv
/ F f jwT (2.16)so A/, Po / ,
where
o o ) C ,,7c(ns + Cpp50s Ps,)] (2.17)
F=
(Ja4)C (50 "si )* $(p-P%),t cn9 CpS/'1o co- + *
To compute the actual value of the change conductance, one must know the extent to which the mobilities of the free carriers near the surface
are reduced by the presence of a potential well, which exists whenever
. : s' If we first assume that the well is shallow enough so that the
mobilities are not appreciably altered, the change in surface conductivity, in mhos per square,is
SSG
4?/
V
EP =
Fe -L' Ps (2.18a)1AA'. P. Po/P
-28-For values of ( - s) greater than a few kT/q, this approximation is
not very good. Schrieffer4 3 has recently computed the change in surface
con-ductivity that would be produced in the field effect experiment if the charge
in
the surface states remained fixed, which would correspond in our case to
frequencies such that X >> 1/t. Following his notation, we may define a "field-effect mobility" by
,AFe - s6/&Q {G/CF v (2.19)
which takes into account the change both in the number of carriers and in the
surface mobility. Then at lower frequencies, where nt # O,
SG
cF
4- iCS
J(2.18b)
Schrieffer has given a curve of FE
vs
s for intrinsic germanium, but in
this chapter we will not need the numerical values. The ratio of G at very low frequencies to that at very high frequencies is just F Experimentally, this ratio is always found to be very small, so F«4
1. But from (2.17) this means thatICr((ro 1+- n C p(,oP P, (Nlo + Po) << C, no, e 4- Cp pro oj,. (2.20a)
Using the definitions of nsl and Psl from (2o3), this may be rewritten as
?¢
I,(2.20b)
which for nearly intrinsic germanium becomes
xntO>>
(nr
0+p S)Loc
(2.21)
from (2°7). Loosely speaking, we may say that (2.21) requires that the
number of both full and empty traps be large compared with the number of
free carriers within a Debye length of the surface.
Inequality (2.20) could have been obtained more directly since
P / (N + P ) is just the ratio of nt to (N - P) after equilibrium has
the transient response of the conductance to an applied field shows that practically all of the added carriers eventually become trapped,
Ent/(EN - P) >> 1 at equilibrium. To see what density of traps this requires, consider the case of a well-oxidized surface exposed to water vapor. Under these circumstances it has been found3 4 that nso is as large as 101 7/cm3. Since the frequency response still approaches zero at very low frequencies, condition (2.21) holds, giving
-
.
-
°>> IO'l/cm
.
(2.22)
Therefore, for this particular case Nt must be at least 101 3/cm2. It is not
unlikely that the water vapor produces a trap density as large as 1015/cm2,
or about one trap per surface atom. Even with dry ambients it is necessary to assume that Nt > 101 3/cm2 to account for the clamping of o0s2 5 ' 3 4
Returning now to equation (2.18), we obtain with F < 1
gG
Cs
/
AE
(2.23)where r can also be simplified to
4- (2.24)
PeF po C Pso 0ro CP
Equation (2.24) gives the time constant that would be observed in the transient response; or to put it more precisely, if an excess bulk charge
SQB = q(sP - N) is added to the sample, then the rate at which
SQB
decays into the traps when F < 1 isd Qs 6s
(2.25) It is important to note that the expression for tr no longer contains any term involving the depth of the traps. Essentially, is the capture time for free
carriers near the surface; the time that the carrier remains in the trap does not enter into (2.24).
-30-The conductance variation given by (2.23) is for the case where all of
the traps have the same characteristics. It has already been shown in connection with Fig. 2-1 that it takes a distribution of time constants to explain the
observed frequency response. Now in any very small region an electron has only one effective capture probability given by an average over all of the traps in that region. Hence, if we are to get a distribution of time constants, we must assume that there is a reasonably coarse-grainea variation in the capture times of the traps from spot to spot along the surface. Regions of the order of a Debye length square (roughly 10-5x 10⁻⁵cm) are sufficiently grainy for this purpose since the conductance of a region that size can fluctuate
inde-pendently of the rest of the surface.42 Therefore, assuming that T is
essentially constant over such an area, we may divide up the surface into regions a Debye length square, compute the conductivity variation from each one by (2,23), and then superimpose the results with an appropriate
distribu-tion funcdistribu-tion for Ad to get the total conductivity variation of the sample.
The use of the statistical treatment in obtaining (2.23) is still valid since
in any area of 10-10 cm there will be at least 103 traps, and perhaps as many
as 10
We will now show that a 1/r distribution for the time constants is what
is needed to explain the majority of the experimental curves. Suppose that
such a distribution holds between a lower limit l and an upper limit 2.
Then using (2.23) the relative frequency response or the system function will be
II'
(2026)
(2.26)
/ f- j, 7_
S(
)
: . /, (z /,). (2°27)As illustrated in Fig. 2-2, a logarithmic dependence on
o
is the behavior
usually observed. In the next chapter an approximate method for obtaining
the noise spectrum from the system function will be given. There it will be
shown that
the curve
of Fig. 2-2 taken in dry N
2before oxidation corresponds
to a 1/fl
2 5power spectrum, while the others give the more common
l/f
l 'Ospectrum.
The rest of the discussion of the field effect experiment and its
rela-tion to the 1/f noise will be postponed until after the proposed noise model
has been analyzed.
CHAPTER III
1/f NOISE IN GERMANIUM FILAMENTS
As we have shown in the last chapter, if the field effect experiment is analyzed on the premise that the rate limiting process is the electronic
transition to the traps9 then in order to obtain the observed frequency
response curves one is forced to make two assumptions. The first is that
the density of the traps is greater than about 1013/cm2o (Actually this is
already known from other experimentso) Then the conductivity change due to
a single trap or a group of similar traps becomes proportional to
jcz/(l + jar), where T is the average time that a carrier near the surface remains free. The second assumption is that this capture time r varies from spot to spot along the surface and that the distribution of -r is approximately proportional to 1/T up to very long times, at least greater than 100 sec.
These two assumptions are all that is necessary to obtain a 1/f spectrum from the model presented in Chapter Io In fact this is all that is needed to make a quantitative prediction for the magnitude of the noise which is in agreement with the experimental values. Just as in the analysis of the field effect experiment, it will not be necessary to assume a specific energy level or density for the trapso
Equilibrium Conductivity Modulation
In order to keep the ideas as simple as possible to begin with, we will first neglect the interaction between the slow traps and the recombination centerso As we have previously mentioned, this interaction can produce an injection or extraction of hole-electron pairs when an electric field is
applied. Later this more complicated effect will be considered; for the
-32-present, however, we wish to calculate only the noise to be expected from the fluctuation in free carrier concentration produced by the filling and emptying of the slow traps.
If possible, one always tries to analyze such complex fluctuations as a sum of a large number of elementary processes which are independent of one another (or more precisely, uncorrelated), for then the total power spectrum can be obtained by simply adding up the spectra from the elementary processes.
This approach fortunately can be followed in the present case, but the way in which to analyze the fluctuations is perhaps not immediately apparent.
We have seen from (2.21) that the number of traps must be large compared with the number of free carriers within roughly a Debye length of the surface. Hence, the filling and emptying of any one trap will certainly not be inde-pendent of the filling and emptying of every other trap. For if only a fraction of them become filled, nearly all of the free electrons are removed
from the surface. Therefore, the chance that one of the remaining traps can
also capture an electron is reduced almost to zero; whereas for the traps to be independent, the capture probability must remain constant.
On the other hand, one cannot treat each charge carrier as a particle which behaves independently of all of the other carriers and try to follow it through its various states; e.g., first free and drifting down the sample,
then trapped, then free again, etc For even forgetting the fact that
quantum mechanics would usually forbid distinguishing one carrier from another, there is an objection from the statistical point of view simply because charged particles interact with one another. The probability that a particular electron is in some given region of space depends on how many other electrons are there. If a majority carrier drifts out of the sample
1-·I_-
-34-(or out of any other region for that matter), then within a dielectric relaxation time on the average it is replaced by another majority carrier.
A procedure which does prove to work, however, is to divide up the surface into small regions about a Debye length square, just as in the field effect analysis, and then compute the conductivity fluctuation from each region separately. Since the conductivity fluctuations will be substantially independent for areas of this size, the total noise can be obtained by adding up the contribution from each region, with an appropriate averaging being taken over the different time constants.
It is shown in Appendix C that if S is the area of the elementary regions,
then the power spectrum for the fluctuation of Snt = S(SP - N) is
G(G
=
(N 4- P)
4 r -
(3.1)
I +(Wo -T)2
where N and P are defined by (2°5) and r by (2,24). This is exactly the
result that would be obtained from the shot-noise fluctuation in the concen-tration of a group of independent particles, where the average concenconcen-tration
was S(No0 P) and each particle had the same lifetime .
In Appendix B it is shown that to a linear approximation one additional in the traps changes the number of electrons in the conduction band by
(3.2a) l, 4-P
and the number of holes by
d~~~S iPda
N +-R~~~-
(3.2b)
where the integration is over the surface. Suppose first that (~B-S) is
small enough to allow the use of bulk mobilities for carriers near the surface. Then if a dc voltage V is applied to the sample of length L, each additional
electron produces a current qnVo/L2 and each additional hole a current