E L S E V I E R Magnetic Resonance Materials in Physics, Biology and Medicine 11 (2000) 114- 121
M A G M A
Magnetic Rt.,sommce Materiats in Ph~L'+ics, B.h'fleg3' and Medicine www.elsevier.com/locate/magmaMuscle glycogen recovery after exercise measured by 13C-magnetic
resonance spectroscopy in humans: effect of nutritional solutions
S. R o t m a n a, j. S l o t b o o m b, R. Kreis b,,, C. Boesch b, E. J6quier c
~+ Department o f LiJb Sciences, Nestle; Research Center, 1000 Lausanne 26, Switzerlandb Department c~/' Clinical Research, Magnetic Resommce Center 1, Universi O, and hlselspital, 3010 Bern, Switzerland c hlstitute o f Physiology, University of' Lausanne, 1005 Lausamle, Switzerland
Received 17 March 2000; received in revised form 3 July 2000: accepted 10 July 2000
Abstract
The rate of glycogen resynthesis in human skeletal muscle after glycogen-depleting exercise is known to depend on carbohydrate intake and is reported to reach a plateau after an adequate amount of carbohydrate (CHO) consumption. Efforts to maximize the rate of glycogen storage by changing the type and form of CHO, as well as by adding proteins or lipids have yielded inconsistent results. The objective of this study was to assess whether isocaloric addition of proteins and arginine to a CHO diet in the first 4 h after an endurance exercise would increase the rate of glycogen synthesis. The CHO solution, given twice at a 2 h interval according to earlier optimized protocols, contained 1.7 g CHO. kg b''dy "~"-~hL The effects of this solution were compared to those of an isocaloric solution containing 1.2 g C H O / k g b''uy ,,,,,igm plt, s 0.5 g protein/kg b''a~ ,,~,ght (including 5 g arginine). Glycogen was measured in quadriceps muscle in viva with natural abundance ~3C-magnetic resonance spectroscopy before exercise and twice after exercise, before and at the end of a 4-h period following the intake of one of the solutions. Eight subjects took part in a randomized cross-over trial separated by at least t week. Glycogen synthesis was found to be significantly increased with both regimes compared to a zero-caloric placebo diet, but no significant difference in glycogen resynthesis was found between the CHO-only diet and the one supplemented by proteins and arginine. It is estimated that significance would have been reached for an increase of 34%, while the effectively measured synthesis rates only differed by 5%. © 2000 Elsevier Science B.V. All rights reserved.
Kzvword~: Exercise; Glycogen: Carbohydrate; Protein; Arginine: Insulin: Magnetic resonance spectroscopy
1. Introduction
A f t e r p r o l o n g e d e n d u r a n c e exercise, recovery o f m u s - cle g l y c o g e n is slow unless c a r b o h y d r a t e s o l u t i o n s or m e a l s a r e p r o v i d e d to the s u b j e c t [ I - 3 ] . W h e n an a d e q u a t e a m o u n t o f c a r b o h y d r a t e is c o n s u m e d i m m e d i - ately a f t e r exercise a n d at 2 h i n t e r v a l s t h e r e a f t e r , the rate o f m u s c l e g l y c o g e n s t o r a g e is r a p i d l y i n c r e a s e d a n d m a i n t a i n e d at an e l e v a t e d level for up to 6 h after exercise [3-6]. H o w e v e r , efforts to m a x i m i z e the rate o f g l y c o g e n s t o r a g e b y i n c r e a s i n g the a m o u n t a n d fre- q u e n c y o f c a r b o h y d r a t e i n t a k e o r by c h a n g i n g the t y p e
* Corresponding author. Present address: Department of Clinical Research. Unit for MR Spectroscopy and Methodology. MR Center !, lnselspital and University, CH-3010 Bern, Switzerhmd. Tel.: + 41- 31-6328174; fax: +41-31-382-486.
E-mail ad&'ess: [email protected] (R. Kreis).
a n d f o r m o f the c a r b o h y d r a t e s used yielded i n c o n s i s t e n t results [3,5-7]. B u r k e et al. [8] s h o w e d that significantly g r e a t e r m u s c l e g l y c o g e n s t o r a g e was a s s o c i a t e d with i n g e s t i o n o f f o o d s w i t h high r a t h e r t h a n low glycemic index. M o r e o v e r , Z a w a d z k i et al. [9] o b s e r v e d a 40'7,, g r e a t e r rate o f m u s c l e g l y c o g e n synthesis after i n g e s t i o n o f a n u t r i t i o n a l m i x t u r e c o n t a i n i n g c a r b o h y d r a t e - F p r o t e i n t h a n with c a r b o h y d r a t e a l o n e , however, the two n u t r i t i o n a l s o l u t i o n s were n o t iso-energetic. T a r n o p o l - ski et al. [10] c o m p a r e d the r a t e o f glycogen synthesis after e n d u r a n c e exercise w h e n the energy c o n t e n t o f the p o s t - e x e r c i s e s u p p l e m e n t s ( c a r b o h y d r a t e c o m p a r e d with c a r b o h y d r a t e + p r o t e i n + fat) was held c o n s t a n t . T h e y did n o t o b s e r v e a significantly d i f f e r e n t effect o f the two test m e a l s on the rate o f m u s c l e g l y c o g e n synthesis, b u t the a m o u n t o f C H O (0.75 g / k g b o d y wt) was p r o b a b l y t o o low to m a x i m i z e g l y c o g e n synthesis a n d , a d d i t i o n - ally, the fat c o n t e n t m a y h a v e d e l a y e d the digestion. 1352-8661 00 $ - see front matter C 2II Elsevier Science B.V. All rights reserved.
S. Rotman et at. 'Magnetic Resommce MateriaLs" in Phy.yics, Biolog.v and Medicine t t (2000) I t4--121 115
Our study aimed at maximizing the rate of muscle glycogen resynthesis following glycogen depletion by exercise, comparing the effects of the intake of two iso-energetic solutions. The first (C), containing a mix- ture of CHO of high glycemic index, was known to optimize glycogen synthesis. The second (CPA), con- taining an iso-energetic mixture of C H O of ,h']gh glycemic index mixed with whey protein and arginine, was designed for its efficient insulin release properties. In two studies [3,5], it had been suggested that there is a threshold of C H O intake (about 1.2 g CHO/kg body wt) above which the rate of glycogen synthesis is maxi- mally stimulated. Accordingly, the C H O content of solution C (1.7 g/kg body wt) compared with that of solution CPA (1.2 g/kg body wt) was expected not to lead to a different (ate of muscle glycogen synthesis. It was hypothesized that, if a greater rate of glycogen synthesis was observed with the CPA solution, it could be attributed to its protein and arginine content. The rationale for this is that both protein and arginine intakes, have specific stimulating effects on insulin se- cretion [11-13], and insulin is known to be a strong activator of muscle glycogen synthesis [14,15]. Insulin increases the rate of muscle glucose transport and acti- vates glycogen synthase, the rate-limiting enzyme it: the glycogen synthesis pathway.
Dietary protein and arginine may also enhance glyco- gen synthesis by 'sparing' ingested carbohydrates for storage rather than for immediate oxidation to meet body energy requirements. Arginine could also be a potential mediator of glucose transport in skeletal mus- cles via the nitric oxide (NO) pathway [16] and induce a vasodilatation that is mediated, in part, by endoge- nously released insulin [17]. These combined mecha- nisms could increase muscle glucose availability and contribute to stimulate glycogen synthesis.
The first aim of this study was to test whether the addition of protein and arginine to a C H O solution significantly enhances the plasma insulin concentration compared to a solution containing C H O only, Based on positive results, the main study was designed as a cross-over study to compare muscle glycogen synthesis upon ingestion of either a C H O or an isocaloric C H O + protein + arginine solution. The rate of muscle glycogen synthesis was measured using in vivo natural abundance ~3C-magnetic resonance spectroscopy (~3C- MRS). ~3C-MRS techniques have made it possible to measure glycogen concentrations non-invasively in hu- man muscle [18-23]. It is known that the ~3C nuclei of glycogen are almost t00% visible with MRS (ReL [24] and references therein), hence ~3C-MR spectra allow a non-invasive measurement of glycogen content in a specific muscle. The possibility to measure muscle metabolites repeatedly and in relatively short intervals by 13C-MRS allows the analysis of glycogen metabolism frequently before and after an exercise ses-
sion, and during the recovery of glycogen stores. The potential of the specific ~-~C-MRS techniques used to define nutritional effects on glycogen recovery rates was established in a subgroup of the investigated subjects using a zero-calorie placebo diet in comparison to the targeted C and CPA solutions.
2. Materials and methods
2.1. Preliminary study 2.1.1. Subjects
Eight healthy male subjects, aged 2 5 - 4 0 years, body mass index < 25 kg/m 2, took part in this study.
2.1.2. Experimental protocol
The subjects drank three nutritional solutions after an overnight fast, each solution being ingested at least 6 days apart in a random sequence. Glucose and insulin plasma levels were measured 30 rain before the inges- tion, at time 0 and then every 30 rain during 4 h after the ingestion. Each test drink contained 50 g C H O in the tbrm of fermented cereals. It consisted of a mixture of sucrose (94%), maltose (3%), glucose (2%) and fruc- tose (1%). The first solution (C~) contained 50 g of this C H O mixture only. The second solution (CP~) was made up of 50 g of the C H O mixture plus 25 g of whey protein. The third solution (CPA~) contained 50 g of the C H O mixture, 15 g whey protein plus 10 g L- arginine.
Blood samples were collected in cooled E D T A sam- ple tubes, centrifuged at 3000 rpm at - 4 ° C for 15 min and the plasma was fl-ozen at - 2 0 ° C until analysis. Glucose was determined by the hexokinase reaction [25] and insulin by the method of Herbert et al. [26].
2.2. Main study 2.2.1. Subjects
Eight healthy male subjects (25-35 years old) who were moderately trained in different sporting activities were investigated. Average height and weight (mean _+ 1 SD) were 176.8 _+5.7 cm and 69.2_+ 5.3 kg, respec- tively. The average maximum 02 consumption (VO2 ... ) of these subjects was 50.3 + 8.7 ml kg ~ min The protocol of the experiment and possible risks were fully explained to each subject before they signed an informed consent document. The protocol had been reviewed and approved by the Nestl6 Research Center's Ethical committee.
2.2.2. Experimental protocol
At least one week before the trial the VO2 ... of each subject was determined with a gas analyzer (MMC Horizon, G a m b r o Ltd, Htinenberg, Switzerland) on an
II6 S. Rotman et al./ Magnetic Resonance Materials #l Physics, Biology and ),ledicbw 11 (2000) 114-12I
electrically braked cycle ergometer (Ergo-metrics 900, Rtiegge Medical Ltd, Baden, Switzerland) by means of a continuous incremental exercise test. H e a r t rate was monitored (Polar sportesterTM PE 3000, Polar Electro Ltd, Finland). The subjects had to maintain between 8 0 - 9 5 revolution/min (rpm). A respiratory exchange ratio (R)_> 1.15 [27] and a VO2 plateau over the last two samples (less than 2 ml k g - ~ m i n - ~ rise in VO2) [28] were the criteria used to ascertain VO2 m~" In some cases,, the subject was not able to maintain the pre- scribed pedal revolution rate. The stability criterion was replaced by the condition that the pedal rate dropped below 60 rpm.
The subjects were requested to avoid intense physical exercise and to consume a high carbohydrate diet (at least 250 g C H O ) the day preceding the tests. The subjects reported to the laboratory in the morning after an overnight fast, the tests were carried out at least 1 week apart. The order of treatment administration was randomized,
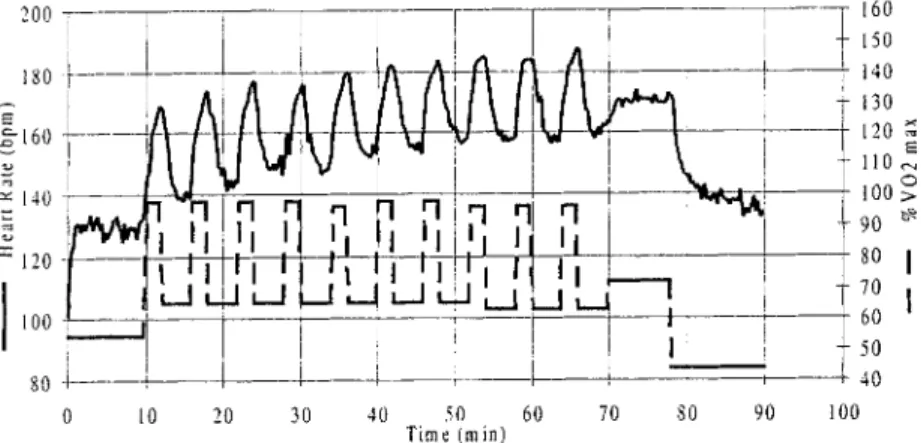
The experiment started with the determination of the glycogen content of the quadriceps muscle by ~~C- MRS. All subjects performed bicycle ergometer exercise according to established protocols [2,7,29] to deplete their muscle glycogen stores. A 90 min exercise con- sisted of a 10-min warm-up at 55% VO, ... followed by ten alternating work periods of 2 min at high intensity (95-100% VO2 ... ) and 4 min at low intensity (55-65'7,, VOw_ ... ), followed by 8 min at 75% VO2 ... and 12 min at 4 0 - 4 5 % VO. , ... as part of an active recovery [29] (Fig. 1). The subjects were free to drink water ad libitum. After the exercise, the glycogen con- tent of the quadriceps muscle was again determined by t~C-MRS to measure the extent of glycogen depletion.
2.2.3. Nutritional sohttions
The composition of the nutritional solutions in the present study and their timing were based on the results of previous studies [2,3,5,6]. In each of the two studies,
the subjects had to ingest one portion of the following nutritional iso-caloric solutions after the exercise, fol- lowed by a second portion after a 2 h interval. Subjects were randomly assigned to drink C or C P A in their first trial and obtained the other one in the second trial.
2.2.3. I. Drink C. C a r b o h y d r a t e drink, containing 600 ml water and carbohydrates ( C H O , 1.7 g/kg body wt), composed o f 50% o f a glucose polymer solution (Glu- cidex 21, Roquette Fr6re Ltd, Lille, France) and 50% of a mixture of glucose (2%), fructose (1%), sucrose (94%) and maltose (3%).
2.2.3.2. Drink C P A . C a r b o h y d r a t e composed o f sugars with the same proportions as above associated with whey protein and arginine, containing 600 ml water, C H O (1.2 g/kg body wt) and a mixture of whey protein (Lacprodan 80, M D Foods Ingredients amba, Den- mark) including 5 g o f L-arginine (Fluka Chemie Ltd, Buchs, Switzerland) (0.5 g/kg body wt).
2.2.3.3. Drink P. F o u r of the eight subjects performed a
third trial, where they ingested a solution without calo- ries, (placebo consisting of 600 ml water, with Can- dereV M (Aspartam, Searle Ltd, Aubonne, Switzerland)).
2.2.4. 1 3 C - M R S
Glycogen levels in the quadriceps muscle were moni- tored by natural abundance '-~C-MRS. Measurements were performed on a standard 1.5 T S I G N A scanner (General Electric. Milwaukee, WI), equipped with a SMIS 3010 IH decoupler console (s.m.i.s. Ltd, Surrey, UK). A double-tuned flexible surface coil (Medical Advance, Mihvaukee, Wl, '3C square surface coil of
11.3 x 11.3 cm, ~H Helmholtz-type coil) was used for the detection of IH decoupled ~3C spectra. A simple pulse and acquire scheme was applied on the carbon channel using a 2.5 ms sech/tanh adiabatic half passage excitation pulse [30] (i.e. nominally a 90 ° pulse). The 200 180 ~ 1 6 0 140 a: 120 100 80
i
r 1!
I
r-
I
i
/. ^i
-q q
n n qin
q q i
!l
]I
!,
]l
!IF!, Ii '_ll
Jl il
I Iil
I
i I~ l, !
J~ I ~ ~._1~ I ~'1 L_.jl it_.~ I iO 20 30 40 50 60 70 80 90 Time (rain) ---~ 160 150 i 1140 ~- 130 120 E 110 i 100 >oi
90 ~ 8O I ~ 70 I j 6O ~ 41) lO0Fig. 1. Schematic representation of the glycogen-depleting exercise. Ten minutes warm-up at 55~,, VO e m,,~, ten alternating work periods of 2 min tit high intensity 95-100% VO: ... followed by 4 min at low intensity 55-65% VO2 ... 8 min at 75% VO 2 ... and 12 min at 40-45% VO 2 ... as part of an active recovery. Targeted course of VO2 and typical corresponding heart rates are displayed.
S. Rotman et al. ,; Magnetic Resonance Materials in Physics, Biology and Medicine 11 (2000) 114-121 117 ~" 8.0" "5 E
g
7.0 • ,j) o o~
6 . 0 U) e~ 5.0 4.0 5 E 80 C 4 0 TM 2 0 TMA
olo
11o
21o
31o
41o
time (h)
B
o!o
CP~
1'.0
2!0
3'0
2.0
t i m e ( h )
Fig. 2. Mean plasma glucose (A) and plasma insulin (B) concentra- tions of all eight subjects before and following ingestion of three test solutions taken at time 0. ( C I = C H O - o n l y , C P ] = C H O + p r o t e i n , CPA, = C H O + protein + arginine, as described in Section 2, part A).
excitation null at the singular point of the excitation profile of the adiabatic pulse [31] was placed 530 Hz upfield from the glycogen-C1 resonance which resulted in a considerable reduction of the large methylene resonances o f fat. At the same time this pulse produced near maximum excitation at both, the resonance posi- tion of glycogen-C1 and that of the guanidino-C of creatine. The protons were continuous wave decoupled (CW decoupling at 5.4 ppm) during acquisition and irradiated at a lower level (14%) during the rest of the time to build up the Nuclear Overhauser Enhancement (NOE-Effect). The average absorbed radiofrequency power (RF-power) was locally below 5.7 W/kg (duty cycle 63%) and, therefore, within FDA recommenda- tions of 8 W/kg for a spatial peak in any g of tissue [32]. Spectra were obtained at a sampling rate of 5 kHz with a repetition time T R of 320 ms, averaging 2000 responses. The short relaxation time of glycogen would allow a T R below 320 ms, resulting in an improved sensitivity. However, other parameters benefit from longer TR's, such as saturation of the creatine signal, reduction of the absorbed R F power, baseline distor- tion of the large fat signals, and technical limitations imposed by the MR-system. The spectra were processed using IDL T M and quantified in frequency domain using
a recently developed fitting algorithm that allows for frequency selective fitting and implementation of prior knowledge. The glycogen C 1-resonance was fitted after L o r e n t z - G a u s s transformation (4 Hz Lorentz, 18 Hz Gauss) in two steps by a single Voigt line as described in details in Ref. [33]. This approach has proven to be robust in spite of the relatively low signal-to-noise ratio. The prior knowledge used does not include multi- ple components of the signal [34].
One trial consisted of three phases: the first before exercise, the second after exercise, and the third to- wards the end of a 4-h period following the intake of one of the isocaloric solutions or placebo given after the exercise period. During each phase, six data points corresponding to 2000 scans each were obtained. Each phase lasted about 90 rain which included: positioning of the volunteer in the magnet, axial and sagittal mag- netic resonance imaging (MRI) sequence to check posi- tioning, adjustments of ~3C-MRS acquisition and ~H-decoupling, and finally acquisition of six x 2000 scans (6 x 10.5 min). The '3C surface coil was placed on the antero-lateral part of the right thigh and the subject was attached to the table to prevent movements.
The concentration of glycogen was determined rela- tive to the area of the simultaneously recorded creatine resonance at 157 ppm, and expressed in institutional units (IU). The use of creatine as an internal standard is justified by the fact that creatine concentrations show little variation as determined in human muscle biopsies [21] and by ' H - M R S of human muscle [35]. The visibil- ity and lineshape of some of the proton MR signals of creatine (i.e. creatine plus phosphocreatine) may change during intense short time exercise [36]. However, such variations have never been observed for the '3C-MR signals used as internal reference in the present study.
2.2.5. Statistical amdysis
Significance levels for differences between the test meals were calculated by t-tests (paired for C vs CPA, two-sample with equal variance for P vs C and P vs CPA). Values are expressed as means _+ SD or SEM as indicated.
3. Results
3. i. Preliminary study
Plasma glucose reached its peak concentration 30 min after ingestion of C~, CP~ and CPA~ (Fig. 2A). A two way A N O V A (treatment x time) with repeated measures revealed a higher plasma glucose concentra- tion with C~ than with CP~ (p = 0.0001) or with CPA~ (p = 0.003). The areas under the curve of insulinemia alter ingestion of CP, and CPA~ (Fig. 2B) were greater than that of Cz ( P = 0 . 0 1 5 and 0.006 respectively).
l lg S. Rotman et a [ . / ~dagnetic Resonance Materials in Phvs'ics Biology and Medicine 11 (2000) 114-121 There was a trend for higher insulin levels for CPA~
versus CP~ (P = 0.09). For the 1 h period starting with the peak insulin level (30-90 rain after ingestion) this difference in insulinemia was statistically significant (P =
0.03).
3.2. Main study
On a lull-width, undecoupled t3C-MR spectrum of the human quadricei~s muscle, the signals of creatine and glycogen are difficult to discern beside the large signals from subcutaneous fat (Fig. 3A). The signal-to- noise ratio is improved with continuous wave decou- pling of the hydrogen nuclei bound to the carbon
A Creatine,~ G l y c o g e ~
200 //150 100"-, 50 ppm
150 1 O0 pp m
Fig. 3. Row A: non-decoupled full width spectrum. The signals of crcatine and gtycogcn are almost invisible beside the large sigrmls from subcutaneous fat. Row B: Magnification of the 80.--170 ppm region of a IH-decoupled and NOE-enhanced spectrum. TR 320 ms. 4000 scans, after Lorentz Gauss transformation and zero and [irst o r d e r ( - 210 °) phase-correction. The decoupled singlet of the glyco- gen-C1 resonance at 100.5 ppm and the singlet from the guanidino-C of creatine at 157 ppm are visibtc.
Creathle
Glycogen
' ~ ~ " 30 rain /
150 100 ppm
Fig. 4. ~3C-MR spectra with creatine and glycogen peaks in a single subject as a fnnction time. (TR 320 ms, Lorentz-Gauss transforma- tion and zero and first order phase-correction, see Section 2) Creatine is used as internal reference, because it remains stable in exercise and recovery. The glycogen signal is decreased after exercise and increases with time after ingestion of one of the carbohydrate drinks.
glyc/crea 3 t , ~ 2 i ~ t 0 2 1 0 ' 3 t 1 0 ' 0 placebo CHO-only u CHO +protein + arginine 2 4 6 [h]
Fig. 5. Illustration of muscle glycogen levels in institutional units (IU) for one volunteer. After acquisition of six separate spectra, muscle glycogen was partially depleted by exercise and post-depletion levels were measured by six spectra after a gap of 2 h. Repletion was observed after a second gap of 2 h when another six spectra were acquired. For a placebo drink, only a minor repletion is observed, while CHO-only and CHO + protein + argininc lead to an obvious increase of muscle glycogen.
atoms, resulting in decoupling trod NOE build up. Using these techniques, the resonances of the guani- dino-C of creatine (157 ppm) and C1 of glycogen (100.5 ppm) become visible in a spectrum with an enlarged scale (Fig. 3B).
Two thousand acquisitions per spectrum were chosen in this dynamic study (Fig. 4) as a compromise between duration of the data acquisition and improved signal- to-noise ratio. Fig. 4 shows a series of t3C-MR spectra with emphasis on the resonances of creatine and glyco- gen before and after exercise and after ingestion of one of the carbohydrate drinks. The glycogen resonance is decreased after exercise and increases with time after ingestion of one of the carbohydrate drinks.
Fig. 5 demonstrates the time course of the glycogen/ creatine ratio for one subject in all three diets. The upmost row illustrates the slow recovery of muscle glycogen after a zero-caloric placebo drink after exer- cise. Pre- and post-depletion glycogen levels were mea- sured in institutional units (IU). In the case of placebo, the rate of glycogen recovery (corresponding to the slope of the line, and indicated numerically in milli-in- stitutional units per minute, mlU/min) is not signifi- cantly different from zero. During each MR session, six spectra with 2000 averages each were acquired and are shown in the figure. For placebo, the scattering of the data within a session, i.e. six subsequent data points, is mainly the result of the limited signal-to-noise in the
S. Rotman et al. Magnetic Resonance Materials in Ph),sics, Biology aml Medichle 11 (2000) 114-121 119
individual spectra as seen in Fig. 4. As illustrated in the lower two traces of Fig. 5, the intake of both isocaloric drinks lead to distinct, but similar recoveries of muscle glycogen in this volunteer.
Table 1 contains the results from the statistical analy- sis of pre- and post-depletion glycogen levels and the rates of glycogen synthesis following ingestion of the isocaloric and the placebo drinks. With the exception of pre-depletion levels during CPA diet, which were found to be significantly higher than during the placebo trial, pre- and post-depletion glycogen levels were indistin- guishable for all tests. The starting glycogen levels for the different trials were comparable therefore. Recovery of glycogen synthesis was found to be significantly different for placebo compared to carbohydrates only (P = 0.014) and placebo compared to CPA (P = 0.037). Paired t-tests between the two conditions with nutrient solutions (C and CPA) did not reveal significant differ- ences between the rates of glycogen synthesis following the intake of the solutions. Fig. 6 shows individual glycogen recovery rates for the three different diets, including the average and SEM within one dict.
Adding a uniform theoretical effect tc,'m to the mea- sured glycogen synthesis rates m the CPA trial, it was
found by variation of this hypothetical treatment effect and subsequent /-tests that an increase of 34% in the glycogen synthesis rate compared to the CHO-only diet would have been detected at the P = 0.05 significance level.
4. Discussion
The best nutritional solution to optimize muscle glycogen repletion after prolonged and strenuous exer- cise is not yet known since reported results [3,5-10] are inconsistent. Our results show that addition of whey protein and arginine to a C H O solution stimulates insulin secretion more than the stimulation due to the increase in plasma glucose. The main aim of the present study was to test whether, under isocaloric conditions, partial replacement of C H O by whey protein and arginine could improve the rate of glycogen storage following exercise-induced depletion, but no such in- crease was found in this study.
The carbohydrate solution (C) that was administered to the subject was based on several obserwttions. (A) Ivy et al. [2] observed a greater rate of glycogen synthe-
Table 1
Pre- and post-depletion muscle glycogen levels and rate of glycogen synthesis during the recovery phase
Nutritional solutions" n F're-dcpletion ([U) Post-depletion (IU) Rate of glycogen synthesis (milli IU rain)
P 4 2.03 +_ (}.24 0.g8 ± 0.17 0.64 +_ 0.40 C ~ 2.40_+0.24 0.97_+0.12 2.33_+0.34 CPA S 2.77 +_ 0.15 1.02 _+ 0.16 2.44 _+ 0.48 [ ; ( P vs C) 4 0.296 0,655 0.014 p (1 } vs. CPA) 4 0.020 0.592 0.037 p (C xs. ( ' P A ) 8 0.233 0,814 0.756
~' P: placebo. C: carbohydrate, CPA: c a r b o h y d r a t e + p r o t e i n + a r g m i n e . Values are means + SEM. Signiticance levels are calculated by t-test (paired t\)r C vs. CPA, two-sample with equal variance for P vs. C and P vs. CPA),
Glycogen [milli i.U/min] 6 . 0 - 5 . 0 ]
40:
[
! ! 3.0 L 2.0 +FI
i
1.0 ~- 00 ~-] F - ' I ~ p = 0.037 p = 0 . 0 1 4iI
P C p >> 0.05I
CPAF
Fig. 6. Individually determined rates of glycogen synthesis [millilU mini for placebo (P. ;t = 4 ) . CHO-only (C, n = 8), and C H O + protein + arginine (CPA. n = 8). Solid lines represent average _+ SEM within one type of diet. The average slope of glycogen repletion is signilicantly lower during placebo intake than ,aith C- or CPA-diet. Average slopes of glycogen synthesis during C- and CPA-diet are not significantly different.
120 S. Rotman el al. / Magnetic Resonance Materials in Physics, Biology and Medicine I I (2000) 114-12I sis when the carbohydrate supplement was ingested
immediately after exercise compared with a 2-h delay of supplement ingestion. (B) Blom et al. [5] reported that a constant rate of muscle glycogen storage could be maintained post-exercise if a carbohydrate supplement was provided at 2-h intervals. (C) They also reported [5] that increasing carbohydrate intake from 0.7 to 1.4 g/kg body wt every 2 h did not result in an increased muscle glycogen storage rate. (D) Ivy et al. [3] reported that 1.5 g glucose/kg body wt provided immediately and 2 h after exercise, significantly enhanced muscle glycogen restoration above the basal rate. However, they re- ported no additional benefit of doubling the amount of glucose supplement from 1.5 to 3.0 g/kg body wt with regard to glycogen recovery during 4 h after exercise. Zawadzki et al. [9]" showed that adding 40.7 g whey protein to a solution containing 112 g carbohydrate (which corresponded to 1.5 g CHO/kg body wt), in- duced a further increase of the rate of muscle glycogen synthesis compared with 112 g carbohydrates alone. One of the underlying mechanisms that could explain such a result is via an increased insulin secretion due to the protein content of the solution. Our preparatory study confirmed that the plasma insulin concentration was indeed significantly higher after the ingestion of a solution of carbohydrate associated with protein and arginine compared to the ingestion of carbohydrate alone. However, the two drinks tested in Zawadzki's study were not isocaloric. Therefore it is unclear whether the added protein had a specific effect on glycogen synthesis.
According to Refs. [3,5] the higher CHO content of C (1.7 g/kg body wt) used in the present study com- pared to that of CPA (1.2 g/kg body wt) should not lead to a different rate of muscle glycogen synthesis. The study was designed to assess whether under isocaloric conditions, a supplement of protein and arginine could maximize the recovery rate of glycogen synthesis because the addition of protein and arginine is known to stimulate insulin secretion. While the effect of carbohydrate consumption upon glycogen recovery rates could be verified very clearly in this study, our results did not show any potentiating effect of the CHO-protein-arginine solution compared to the isocatoric CHO solution (p = 0.76). Error estimates in- dicate that an increase in glycogen synthesis rate of 34% (i.e. less than the 40"/,, increase reported by Zawadzki et al. [9]) would have lead to a significant effect in the current experimental set-up. Given the present results, it is therefore likely that above a certain amount of carbohydrate intake (1-1.5 g/kg, every 2 h), the rate of muscle glycogen synthesis cannot substantially increase further with isocaloric nutrition - - at least not by adding protein and/or arginine.
The individual results for the glycogen resynthesis rate (see Fig. 6) show a fairly large spread. This is in
part due to experimental error (limited signal to noise) and inaccuracies introduced by the spectra fitting pro- cedure (main problem: the automatically defined base- line). In addition, also interindividual differences lead to apparent scatter, which is eliminated by the paired t-test for diet comparison (C vs. CPA). One subject showed substantial glycogen resynthesis in spite of the placebo diet. This trial was repeated, but the original result was confirmed. The statistically significant differ- ence in pre-exercise glycogen levels between P and CPA trials is not expected to have had any influence on the measured recovery rates and is thought to have been caused by individual differences and incomplete compli- ance with suggested diet and physical activity the day before the trials.
Acknowledgements
This work was supported by Nestec Ltd, Vevey Switzerland, and the Swiss National Foundation (31-42
162.94).
References
[I] Bergstrom J, Hermanscn L, Hultman E, Saltin B. Diet, muscle glycogen and physical performance, Acta Physiol Stand
1967;71:i40-50.
[2] Ivy JL, Katz AL, Cutler CL, Sherman WM. Coyle EF. Muscle glycogen synthesis after exercise: effect of time of carbohydrate ingestion. J Appl Physiot 1988:64:1480-5.
[3] Ivy JL, Lee MC, Brozinick JT, Jr., Reed MJ. Muscle glycogen storage after different amounts of carbohydrate ingestion. J AppI Physiol t988;65:2018 23.
[4] Bergstrom J, Hultman E. Muscle glycogen synthesis alter exer- cise: an enhancing factor localized to the muscle cells in man_ Nature 1966:210:309- I0.
[5] Blom PC, Hostmark AT, Vaage O, Kardel KR. Maehlum S, Effect of different post-exercise sugar diets on the rate of muscle glycogen synthesis. Med Sci Sports Exerc 1987:19:491-6. [6] Reed M J, Brozinick JT, Jr., Lee MC, Ivy JL. Muscle glycogen
storage postexercise: effect of mode of carbohydrate administra- tion. J Appl PhysioI 1989;66:720-6.
[7] Keizer HA, Kuipers H. van Kranenburg G, Geurten P. Influence of liquid and solid meals on muscle glycogen resynthesis, plasma fuel hormone response, and maximal physical working capacity. Int J Sports Med 1987:8:99-104.
[8] Burke LM, Collier GR, Hargreaves M. Muscle glycogen storage after prolonged exercise: effect of the glycemic index of carbohy- drate feedings. J Appl Physiol 1993:75:t019-23.
[9J Zawadzki KM. Yaspelkis BB, II1, Ivy JL. Carbohydrate-protein complex increases the rate of muscle glycogen storage after exercise. J Appl Physiol 1992:72:1854-9.
[10] Tarnopolsky MA, Bosman M, Macdonald JR, Vandeputte D, Martin J. Roy BD, Postexercise protein-carbohydrate and carbo- hydrate supplements increase muscle glycogen in men and women. J Appl Physiol 1997:83:1877-83.
[1 t] Floyd JC. Jr., Fajans SS, Conn JW, Knopf RF, Rull J. Insulin secretion in response to protein ingestion. J Clin Invest 1966:45:1479- 86.
S. Rotman et al. Magnetic Resonance Materials in Physics, Biolo,gy amt Me~ficine 11 (2000) 114-121 121
[12] Floyd JC, Jr., Fajans SS, Conn JW, Knopf RF, RulI J, Stimula- tion of insulin secretion by amino acids. J Clin Invest 1966;45:1487-502.
[13] Floyd JC, Jr., Fajans SS, Pek S, Thiffault CA, Knopf RF, Conn JW. Synergistic effect of essential amino acids and glucose upon insulin secretion in man. Diabetes 1970;19:109-15.
{141 Danforth WH, Harvey P. Glycogen synthetase and controI of glycogen synthesis in muscle. Biochem Biophys Res Commun 1964;16:466-71.
[15] Cohen P, Nimmo HG, Proud CG. How does insulin stimulate glycogen synthesis? Biochem Soc Symp 1978;43:69 95. [16] Balon TW, Nadler JL. Evidence that nitric oxide increases
glucose transport in skeletal muscle. J Appl Physiol 1997;82:359-63.
[17] Giugliano D, Marfella R, Verrazzo G, Acampora R, Coppola L, Cozzolino D, D'Onofrio F. The vascular effects of L-arginine in humans. The role of endogenous insulin. J Clin Invest
1997;99:433-8.
[181 Avison M J, Rothman DL, Nadel E, Shulman RG. Detection of human muscle glycogen by natural abundance 13C NMR, Proc Natl Acad Sci USA 1988;85:1634-6.
[19] Jue T, Rothman DL, Tavitian BA, Shuhnan RG. Natural-abun- dance C-13 NMR study of glycogen repletion in human liver and muscle. Proc Natl Acad Sci USA 1989;86(5):1439-42.
[20] Beckmann N, Seelig J, Wick H, Analysis of glycogen storage disease by in vivo 13C NMR: Comparison of normal volunteers with a patient. Magn Reson Med 1990"16:150 -60.
[21] Jehenson P, Duboc D, Bloch G, Fardeau M, Syrota A. Diagno- sis of muscular glycogenosis by in vivo natural abundance 13C N M R spectroscopy. Neuromuscnl Disord 1991 ; 1:99 I 0 l, [22] Taylor R, Price TB. Katz LD, Shulman RG, Shulman GI.
Direct measurement of change in muscle glycogen concentration after a mixed meal in normal subjects. Am J Physiol 1993;265:E224 -9.
[23] van dcn Bcrgh A J, tloutman S, Hcerschap A, Rehrcr N J, van den Boogert H J, Ocscburg B, Hopman MT. Muscle glycogen recovery after exercise during glucose and fructose intake moni- tored by I3C-NMR. J Appl Physiol 1996:81:1495-500.
[24] Taylor R, Price TB, Rothman DL, Shulman RG, Shulman GI. Validation of 13C NMR measurement of human skeletal muscle glycogen by direct biochemical assay of needle biopsy samples. Magn Reson Med 1992;27:13-20.
[25] Slein MW. In: Bergmeyer HW, editor. Methods of Enzymatic Analysis. Weinheim: Verlag Chemie/Academic Press, 1965:117. [26] Herbert V, Lau KS, Gottlieb CW, Bleicher SJ. Coated charcoal
immunoassay of insulin. J Clin Endocrinol Metab 1965;25:1375- 84.
[27] Issekutz B J, Rodahl K. Respiratory quotient during exercise. J Appl Physiol 1961; t 6:606 - 10.
[28] HoMey ET, Bassett DR, Jr., Welch HG. Criteria for maximal oxygen uptake: review and commentary. Med Sci Sports Exerc 1995;27:1292-301.
[29] Choi D, Cole K J, Goodpaster BH, Fink WJ, Costill DL. Effect of passive and active recovery on the resynthesis of muscle glycogen. Med Sci Sports Exerc 1994;26:992-6.
[30] Silver MS, Joseph RI, Hoult DI. Highly selective Pi/2 and Pi pulse generation. J Magn Reson 1984;59:347-51.
[31] Van Cauteren M, Miot F, Segebarth CM, Eisendrath H, Os- teaux M, Willem R. Excitation characteristics of adiabatic half- passage RF pulses used in surface coil MR spectroscopy. Application to 13C detection of glycogen in the rat liver. Phys Med Biol 1992;37:1055-64.
[32] Shellock FG, Schaefer D J, Kanal E. Physiologic responses to an MR imaging procedure performed at a specific absorption rate of 6.0 W/kg. Radiology 1994;192:865--8.
[33] Slotboom J, Boesch C, Kreis R. Versatile frequency domain fitting using time domain models and prior knowledge. Magn Reson Med 1998;39:899-911.
[34] Overloop K, Van Hecke P, Vanstapel F, Chen H, van Huffel S, Knijn A, van Ormondt D. Evaluation o1" signal processing methods for the quantification of a mutti-expm:entiul signal: the glycogen 13C-I NMR signal. NMR Biomed 1996:9:315-21. [35] Kreis R, Koster M. Kamber M, Hoppelcr H. Boesch C. Peak
assignment in localized I H iVlR spectra based on oral creatine supplementation. Magn Reson Med 1997;37:159-63.
[36] Kreis R, Jung B. Slotboom J, Felblinger J, Boesch C. Effect of exercise on the crcatine resonances in I H-MR spectra of human skeletal muscle. J Magn Reson 1999;137:350-7.