HAL Id: hal-02311560
https://hal.uca.fr/hal-02311560
Submitted on 11 Oct 2019
HAL is a multi-disciplinary open access
archive for the deposit and dissemination of
sci-entific research documents, whether they are
pub-lished or not. The documents may come from
teaching and research institutions in France or
abroad, or from public or private research centers.
L’archive ouverte pluridisciplinaire HAL, est
destinée au dépôt et à la diffusion de documents
scientifiques de niveau recherche, publiés ou non,
émanant des établissements d’enseignement et de
recherche français ou étrangers, des laboratoires
publics ou privés.
Past (1950–2017) and future (–2100) temperature and
precipitation trends in Egypt
Amira Mostafa, Ali Wheida, Mostafa El Nazer, Mona Adel, Lamia Leithy,
Guillaume Siour, Adriana Coman, Agnès Borbon, Abel Wahab Magdy,
Mohamed Omar, et al.
To cite this version:
Amira Mostafa, Ali Wheida, Mostafa El Nazer, Mona Adel, Lamia Leithy, et al.. Past (1950–2017)
and future (–2100) temperature and precipitation trends in Egypt. Weather and Climate Extremes,
Elsevier, In press, �10.1016/j.wace.2019.100225�. �hal-02311560�
Weather and Climate Extremes xxx (xxxx) xxx
2212-0947/© 2019 Published by Elsevier B.V. This is an open access article under the CC BY-NC-ND license (http://creativecommons.org/licenses/by-nc-nd/4.0/).
Past (1950–2017) and future ( 2100) temperature and precipitation trends
in Egypt
Amira N. Mostafa
a,f, Ali Wheida
b, Mostafa El Nazer
b, Mona Adel
c, Lamia El Leithy
c,
Guillaume Siour
d, Adriana Coman
d, Agnes Borbon
e, Abel Wahab Magdy
f, Mohamed Omar
a,
Amal Saad-Hussein
c, Stephane C. Alfaro
d,*aEgyptian Meteorological Authority, Cairo, Egypt
bTheoretic Physics Department, National Research Centre, Cairo, Egypt
cEnvironmental & Occupational Medicine Department, National Research Centre, Egypt
dLaboratoire Inter-universitaire des Syst�emes Atmosph�eriques, UMR CNRS 7583, Universit�e de Paris-Est Cr�eteil et Universit�e de Paris, IPSL, France eLaboratoire de M�et�eorologie Physique, Universit�e Clermont Auvergne, Aubi�ere, France
fAstronomy and Meteorology Department, Faculty of Science, Cairo University, Cairo, Egypt
A R T I C L E I N F O
Keywords:
Egypt
Daily temperature trends Extreme daily temperatures Precipitation trends
A B S T R A C T
Egypt, located in the Middle East and North Africa region, is considered to be a potential hot-spot of climate change where the warming and increase of the frequency of extreme temperatures could occur faster than at global scale. Precipitation is also expected to decrease in the region. In this work, our aim is to quantify the past and future temperature and precipitation trends at 8 locations selected for being representative of the variety of Egyptian climates. For the past period (1950–2017), we show that the decadal temperature trends derived from the analysis of the assimilated ERA-Interim (ERA-Int) and downscaled CORDEX (Historical and Evaluation) data are consistent. Relative to 1960, the daily maximal and minimal temperatures have increased by 1.3 � 0.1 and 1.3 � 0.3 �C, respectively, at the 8 selected locations. However, at the shorter yearly time scale, sub-regional
differences of climate variability can be evidenced: this variability is less at the coastal and Nile Delta sites than at the drier inland locations. For the future, we use an ensemble of 6 CORDEX Africa models. Under the RCP45 scenario, the temperatures are predicted to increase at a rate ranging from 0.28 � 0.04 �C/decade
(Alexandria) to 0.38 � 0.09 �C/decade (Hurghada and Aswan) between 2010 and 2040, and to abate afterwards
(0.12 � 0.08 �C/decade). Under the RCP85 scenario, the rates of temperature increase before 2040 are similar to
those under RCP45 (from 0.24 � 0.14 to 0.40 � 0.12 �C/decade) but considerably larger afterwards (from
0.48 � 0.18 �C to 0.72 � 0.11 �C/decade between 2050 and 2100). As compared to the 2006–2015 reference
period, the extreme temperatures analysis performed with the CLIMDEX software shows that the hot days and nights will become more frequent at all sites, but that the increase will occur at larger rates at the Red Sea (Hurghada) and upper Egypt (Aswan) sites than at the other ones. These inter-site differences are more pro-nounced with RCP45 than with RCP85. Considering the latter scenario, in the last decade of this century about 80% of the days in a year would be hotter than the 90th percentile of the 2006–2015 reference period. Regarding the annual precipitation, the analysis of ERA-Interim data of the 1980–2017 period does not reveal any signif-icant trend, but in both RCP45 and RCP85 a signifsignif-icant decrease (from 0.48 to 0.9 mm/y, and from 0.95 to
1.40 mm/y, respectively) is predicted to occur from 2010 to 2100 in the north of Egypt where rain is currently the most abundant.
1. Introduction
The scientific community concurs that the warming of the global climate already observed in the past century is due to the accumulation
of greenhouse gases in the atmosphere and that this will continue over the 21st century (IPCC, 2007, 2013). As compared to the 1986–2005 reference period, the global temperature rise could lie between 0.3 and 4.8 �C in 2081–2100. However, the Intergovernmental Panel on Climate
* Corresponding author.
E-mail address: alfaro@lisa.u-pec.fr (S.C. Alfaro).
Contents lists available at ScienceDirect
Weather and Climate Extremes
journal homepage: http://www.elsevier.com/locate/wacehttps://doi.org/10.1016/j.wace.2019.100225
Change (IPCC) also indicates in its Fifth Assessment Report (AR5) that significant regional departures from the global-scale pattern are to be expected for temperature as well as for precipitation (Christensen et al., 2013). In particular, the Mediterranean and Middle-East regions are considered as potential hot-spots of climate change. Indeed, the obser-vations show that between 1950 and 2000, these regions have already warmed significantly faster in June to August than the global average temperature as simulated by models participating in the Coupled Model Intercomparison Project Phase 3 and 5 (CMIP3 and CMIP5, respectively) (van Oldenborgh et al., 2009). Therefore, the projected temperature increase is likely to go on being significantly larger than the global one. In this region, precipitation is also likely to decrease with dramatic consequences for the local population and ecosystems (Christensen et al., 2007; Giorgi and Lionello, 2008; Lelieveld et al., 2016; Buc-chignani et al., 2018).
With a territory covering 1 million km2 and its rapidly growing
population expected to reach more than 150 million by 2050 (UN, 2017), Egypt is the country of the Middle East region most likely to be severely affected by the consequences of this evolution. Indeed, modi-fications of the regional climate would have direct and indirect negative effects on sectors as diverse as human health, agriculture, economy, or water resource management.
In order to decide which strategy would be the most appropriate to
mitigate these adverse impacts and adapt to them, it is of crucial importance to document the evolution of the Egyptian climate in the recent decades and predict this evolution until the end of this century. Note that the spatial scale of this assessment must be fine enough to account for the diversity of the Egyptian regional climate. Generally, the decadal trends of daily 1) minimal and maximal temperatures and 2) precipitation are used as primary indicators of the climate evolution. However, because of their dramatic consequences, the much shorter- term extreme events have also received recently much attention from the scientific community. For instance, coordinated efforts were made under the lead of the World Meteorological Organization (WMO) Expert Team on Climate Change Detection and Indices (ETCCDI) to 1) propose standardized climate extreme indices facilitating inter-regional com-parisons, and 2) develop and distribute the software necessary to check the quality of the data and calculate these indices. As a result, 27 tem-perature and precipitation indices were defined (Zhang et al., 2011) and the CLIMDEX software allowing their calculation was developed in the frame of a joint WMO/Australian Research Council (ARC) project.
Unfortunately, the daily observational data necessary for the computation of the extreme indices and their evolution over the long term are still missing for entire regions of the globe. In Egypt, the Egyptian Meteorological Authority (EMA) checked the quality of 7 years (2004–2010) of hourly measurements performed at 8 of its stations and
Fig. 1. Locations of the 8 sites selected for this work: 1) Alexandria, 2) Mansoura, 3) El Arish, 4) Cairo, 5) El Farafra, 6) Asyut, 7) Hurghada, and 8) Aswan. The
orange symbols indicate the sites for which high-quality meteorological surface observations (Korany et al., 2016) are available from 2004 to 2010 for evaluating the other meteorological datasets used in this study (map from GoogleEarth).
made the data available to the scientific community (Korany et al., 2016), but these time series are too short to be relevant for climate studies. Therefore, substitute datasets need to be used instead of actual observations. Basically, two possibilities exist to reconstruct the past: 1) assimilating the multiple observational data acquired by surface and air- or space-borne sensors, and 2) using regional climate models (RCMs) for downscaling the relatively coarse-resolution outputs of the Global Climate Models (GCMs). Therefore, the questions arise regarding 1) the possible lack of consistency of these substitute datasets and 2) the im-plications this might have in terms of reliability of the reconstruction of the past climate trends.
In this work, our first objective is to address the first point for 8 Egyptian locations (Fig. 1) selected for being representative of the di-versity of the Egyptian climate. Note that the most densely populated areas of the country (Greater Cairo, Alexandria, the Nile Delta, and the Nile Valley) are all represented in this selection.
For each of the 8 locations, the daily temperature maxima and minima and the precipitation in the 1980–2017 period were extracted from the ERA-interim reanalysis archive (Berrisford et al., 2011; Dee et al., 2011) of the European Center for Medium-range Weather Fore-casting (ECMWF). The ‘historical’ (1950–2005) and ‘evaluation’ (1989–2009) downscaled times series (see more details in the material and methods section below) were also obtained from the Coordinated Regional Climate Downscaling Experiment (CORDEX) website. This al-lows comparison of the downscaled and reanalyzed data in their inter-secting periods. Note that 4 of the 8 sites (from north to south: El Arish, Cairo, Asyut, and Aswan) were already present in the Korany et al. (2016) archive. This means that for these sites, the direct comparison of the ERA-interim and CORDEX minimal and maximal temperatures with surface observations is also possible between 2004 and 2010.
The second objective of this study is to test the impact of the datasets’ potential discrepancies regarding the quantification of the temperature and precipitation trends. For the temperature trends, we propose a new method consisting in 1) selecting an arbitrary decade (1990–1999) of reference, and 2) analyzing the temporal evolution in the period 1980–2017 of the statistical distribution of the temperature anomalies. For the precipitation and the temperature extremes, we use those of the CLIMDEX indices that are most relevant for our region of study.
Finally, we complete our analysis of the sub-regional climate trends and extremes by extending it to the ‘historical’ (1950–1979) and future (2018–2099) periods. For the latter assessment of the future long-term evolution, we use the average of an ensemble of 6 CORDEX pro-jections forced by two Representative Concentration Pathways (RCP45
and RCP85).
2. Material and methods
2.1. The study region and the site selection
With almost 100 million inhabitants, Egypt is the most populous country of the MENA (Middle East and North Africa) region and the third one in Africa. Approximately 95 percent of the Egyptians live on less than 5 percent of the whole territory either in megacities (Greater Cairo), large cities (e.g., Alexandria, Mansoura), or the rural areas located along the River Nile and in its delta. Thus, the densely populated part of the country extends over more than 1000 km between the 22�
N and 31.5�N latitudes. This extension implies that the Egyptians live in a
variety of climates ranging from the comparatively mild and rainy coast of the Mediterranean Sea to the extremely dry and hot climate of the south. In order to cover this diversity in our study, we have selected (Fig. 1) 3 locations in the Nile Delta or its immediate vicinity (Alexan-dria, Mansoura, and Cairo), 1 in North Sinai (El Arish), 2 along the Nile (Asyut and Aswan), 1 station in an oasis of the Western Desert (El Far-afra), and 1 on the Red Sea coast (Hurghada). The coordinates of these stations are reported in Table 1.
2.2. Available data
2.2.1. Direct surface observations
Meteorological observations have been performed routinely for de-cades by the EMA in its network of surface stations. As these data were not distributed to the large public and therefore rarely used, an effort was made recently to check the quality of the hourly meteorological measurements performed from 1/1/2004 to 31/12/2010 at 8 of the EMA stations (Korany et al., 2016). These high-quality data were then deposited in a public repository (https://www.pangaea.de/) from which they can be downloaded at no cost. The datasets contain the hourly values of the air temperature from which Tmax and Tmin can be extracted, but not the precipitation. In this study, we have not retained the stations located in areas with very low population density and only selected the 4 (El Arish, Cairo, Asyut, Aswan) that were positioned along a more or less north-south axis extending from the northernmost to the southernmost parts of the country. In Fig. 1, these stations are distin-guished from the others by orange symbols. Note that if the 7-year time-series are too short to be of any interest for climatological studies, they are nonetheless precious for evaluating the quality of the substitute datasets used in this work.
2.2.2. Assimilated ERA-interim data
Unlike other methods used for deriving geophysical parameters from observations, a reanalysis is physically coherent in the sense that its outputs must respect the law of physics (similar to weather and climate models) and at the same time is meant to be consistent with the obser-vations. Note that this consistency is not assured for variables that are not assimilated but modeled, such as temperature and precipitation extremes (Sillmann et al., 2013).
A reanalysis uses a forecast model to assimilate and compare ob-servations of various types and from multiple sources, thus becoming able to extrapolate information from locally observed parameters to unobserved parameters at nearby locations (Dee et al., 2011). The ERA-Interim archive currently contains 6-hourly gridded estimates of three-dimensional (3D) meteorological variables, and 3-hourly esti-mates of a large number of surface parameters and other two-dimensional (2D) fields, for all dates from 1 January 1979 onward. For a detailed description of this archive, we refer the reader to Berris-ford et al. (2011). The grid spacing is uniform (0.70�) along a meridian
and over Egypt the spacing is about 0.75�along the west-east direction.
The daily precipitation and Tmax and Tmin at 2 m necessary for this study were extracted using the ECMWF web user interface (http://apps. Table 1
Latitudes and longitude of the 8 locations selected for this study.
Station No. Station Name Lat (�N) Long. (�E) Location
1 Alexandria 31.18 29.94 Mediterranean 2 Mansoura 31.40 31.00 Nile Delta 3 El Arish 31.08 33.82 North Sinai 4 Greater Cairo 30.13 31.40 Nile River 5 El Farafra 26.52 27.54 Western Desert
6 Asyut 27.11 31.11 Nile River
7 Hurghada 27.15 33.72 Red Sea
8 Aswan 23.97 32.78 Nile River
Table 2
The 6 different combinations of GCM and RCM used in this study for predicting the climate evolution between 2006 and 2100 under the RCP45 and RCP85 scenarios.
RCM
CCLM4.8 RCA4 CanRCM4
GCM CanESM2 Can 1 Can 2
IPSL-CM5A-MR IPSL
ecmwf.int/datasets/data/interim-full-daily/levtype¼sfc/) for the 8 sites and from 1980 to 2017.
2.2.3. Downscaled CORDEX data
Climate simulations are often needed at a finer spatial resolution than that of the Global Climate Models (GCM). The main goal of the International Coordinated Regional Climate Downscaling Experiment (CORDEX) Initiative, sponsored by the World Climate Research Program (WCRP), is to fill this gap in a selection of pre-defined domains. Prac-tically, the CORDEX data are obtained by downscaling with a Regional Climate Model (RCM) the outputs of a GCM embedding the simulation domain and used as a driving model. In this study, we use simulations performed in the frame of CORDEX-Africa with different combinations of GCMs and RCMs. Several meteorological data including pre-cipitations and daily max and min temperatures are available in four different runs: Historical for the 1950–2005 period, an evaluation run forced by the ERA-Interim reanalysis data from 1989 to 2009, and the RCP45 and RCP85 scenarios for the 2006–2100 period. For the evalu-ation runs, we used 3 different RCMs (CCLM4.8, CanRCM4, RCA4) and for the future period 6 different combinations of these RCMs with 3 GCMs (CanESM2, IPSL-CM5A-MR, and MPI-ESM-LR r1) as detailed in Table 2. For simplicity, these model combinations will hereinafter be referred to as Can 1, Can 2, IPSL, MPI 1, MPI 2, and MPI 3.
All the models were run over an African domain covering the Egyptian territory with a horizontal resolution of 0.44� except Can 2
(0.22�). The results of the simulations were downloaded from the
website of the Earth System Grid Federation (https://esg-dn1.nsc.liu. se/projects/cordex/).
2.3. Evaluation of temperature trends
Whether maximal or minimal, the daily temperatures recorded at a given location are characterized by a marked seasonal component, which can be approximated by a sinusoidal function. Therefore, the temperature (Tmax, in the example below) measured during a selected
reference period can be expressed simply as:
Tmax ¼Tmean þAsin(2πt/Tþφ) þ ed (1)
In this equation, Tmean is the mean maximal temperature of the
reference period, t is the time (in days), A represents the amplitude of the seasonal component, T and φ are its period (close to 365 days) and phase at origin, respectively, and ed is the daily residual (also referred to
as the ‘anomaly’ in the following). For reasons detailed further below, a different reference period of 10 years will be used for the analysis of the ‘past’ and the ‘future’ time-series (1/1/1990-31/12/1999 and 1/1/ 2006-31/12/2015, respectively). The values of Tmean, A, and φ, which
vary with the geographical position of the studied site, are determined by application of an iterative least square routine. Note that this pro-cedure assumes that ed is normally distributed in the reference period,
which we will check individually for each site. Then, we will extend the application of Equation (1) to the whole ‘past’ or ‘future’ period in order to compare the daily observations with those of the reference decade. The daily residual ed contains interesting information on the temporal
components of Tmax not accounted for by the sum of the first two terms
of Equation (1). In particular the climatological evolution of Tmax,
hereinafter referred to as the ‘decadal temperature trend’ or more simply ‘temperature trend’ can be directly determined from the temporal evo-lution of the 10 year moving average of ed. This moving average will be
noted e10y in the following and calculated using a ten-year window
centered of each day of the available period. By definition e10y is nil at
the center (1/1/1995 or 1/1/2011) of the reference period. In addition, the temporal evolution of the 10y moving average of the standard de-viation (SD) of the ed values around the mean also provides an
inter-esting hindsight on the climatological evolution of the local variability of the climate system. When a finer temporal resolution is necessary, for instance for comparing the inter-annual variabilities of the temperature records of the different stations, the moving average of ed will be
calculated over a duration of 1 year only, instead of 10. In this case, it will be noted e1y.
2.4. Extreme indices (CLIMDEX)
An extreme is defined as a statistically rare event. For lack of long- enough observational records, it is most of the time impossible to determine the return period of the decadal or centennial extremes. Thus, the analysis of the time-series rather tries to quantify the frequency of the more moderate events that occur several times in a year. In this work, we will use for this a selection (see below) of the 27 ETCCDI indices most relevant for Egypt. For more details on the definition of these indices, we refer the reader to Donat et al. (2013) but, basically, the method used for calculating them from a dataset of daily records previously checked for quality is as follows: 1) a sufficiently long (10 years in our case) period of reference is selected, 2) the statistical dis-tribution of the daily values in this period is used to calculate a pre-determined (usually 10 percent) percentile of threshold exceedance, and 3) all the daily values outside these limits are flagged as extremes. Note that according to this definition, the extremes are identified by comparison with an average local situation, and what appears as a hot- or cold-extreme at a given location can appear as normal at another. Therefore, in the following, we will compare the temporal evolutions of the climate extremes at the 8 sites of this study rather than the absolute values of these extremes. The ‘Climdex’ software necessary for
Fig. 2. Evaluation of the assimilation (ERA-Int, left panel) and downscaling (CORDEX-Eval, right panel) products against the direct measurements of the daily
maximal and minimal temperatures performed at the Cairo meteorological station. Seven (ERA-Int) or six (CORDEX-Eval) years of daily data are used for the comparisons (see text for more details).
application of the quality check and calculation of the indices was downloaded from the ETCCDI website (http://etccdi.pacificclimate. org/software.shtml).
2.4.1. Temperature indices
In the past decades, severe heat waves, such as those of the summers of 2010 and 2015 to consider only the more recent, have stroke Egypt. During these periods, the population suffered from the elevated tem-peratures that remained, several days in a row, high not only during the day but also during the night. The indices most relevant to quantify these situations are the proportions of days in the year with night and day temperatures above the 90th percentile (TN90P and TX90P, respec-tively), or below the 10th percentile (TN10P and TX10P) of the refer-ence decade. The number of consecutive days above the 90th percentile in a year (the so-called ‘warm spell duration indicator, or wsdi) and its equivalent for the cold days below the 10th percentile (‘cold spell duration index’, or csdi) are also useful for characterizing the length of these episodes of hot or cold extremes. Finally, the evolution of the number of days in a year with a temperature above 25 �C (su25) is also
interesting to consider. As outputs of the CLIMDEX software, one can find the trends of these indices calculated over the whole period of study. These trends are characterized by the means of their slope asso-ciated with a confidence interval (CI) and a p-value. In this study, only the results with a p-value less than 5% will be considered as significant and retained.
2.4.2. Precipitation
Except along the Mediterranean coast, rain is very rare in Egypt. The damage it causes usually results from flash floods consecutive to intense rainfalls lasting from a few hours to a few days. Therefore, beside the cumulated yearly amount of precipitation (PRCPTOT, in mm), the index appearing as the most relevant to characterize the Egyptian climate is the maximum amount of rain in 5 consecutive days (RX5day, in mm). RX5day is initially calculated for each month of the study period and the annual RX5day, which we use in this study, is determined as the maximum of these monthly values. As with the temperature indices, the multi-year trend is characterized by a slope, confidence interval, and p- value.
3. Results and discussion 3.1. Temperature trends
3.1.1. Consistency of the temperature datasets
As already indicated above, the direct meteorological measurements that can be used as references to test the quality of the ERA-Interim data are available at a limited number (4) of stations and in a period of 7 years (2004–2010) only. The first 6 of those years can be used to eval-uate the CORDEX-Eval dataset that ends in 2009. With CORDEX-Hist, the overlapping period (1 year) is unfortunately too short for a mean-ingful evaluation of these products against the observations.
The case of Cairo is illustrated in Fig. 2 and the results obtained for the four stations are reported in Table 3. With a slope (a) close to 1 and a coefficient of determination (R2) ranging from 0.85 to 0.97, the daily
Tmax and Tmin of ERA-Interim are almost perfectly linearly correlated to the observations. This justifies the frequent assumption that their quality is almost equivalent to that of direct observations. However, as can be seen in Fig. 2 for Cairo and is indicated by the non-nil vertical intercept (b) for the other stations, ERA-Interim seems to suffer from a systematic bias that can be either positive or negative but does not exceed 3.5 �C in the worst case (that of Tmin at the Cairo station). For
the regional downscaling constrained by ERA-Interim (CORDEX-Eval), the linear correlation is still strong (0.79 < R2 <0.91) and the slope close to unity (0.83 < a<1.22) but there is a relatively large ( 5 to 7 �C) systematic underestimation of Tmin in Cairo, Asyut, and Aswan
as denoted by the negative value of b for these stations.
In order to test the impact of these discrepancies of the temperature datasets on the evaluation of the climatological trends derived from their analysis, we have chosen in the next sub-section Cairo as a case study.
3.1.2. Comparison of the temperature trends obtained from the different datasets
Because the 1990–1999 period is common to the ERA-Interim, CORDEX-Eval, and CORDEX-Historical datasets, this decade was cho-sen as a reference period for the quantification of the past Tmax and Tmin trends. The mean of the maximal (or minimal) daily temperatures (Tmean), amplitude of the seasonal variations (A), period (T), and phase at origin (φ) of Equation (1) were determined for the 3 datasets. Un-surprisingly, T was found to lie always between 365.0 and 366.0 days and its value is not indicated in Table 4 that reports the other results of the adjustment. As compared to ERA-Int Tmax, in both its evaluation and historical versions, CORDEX overestimates Tmean and A by about 3 and 1.8 �C, respectively. Conversely, in the case of Tmin, CORDEX-Eval
and CORDEX-Hist underestimate Tmean by as much as 4.3 and 5.0 �C,
respectively.
For the sake of illustration, Fig. 3 shows the results of the adjustment of Equation (1) to the ERA-Interim Tmax data (left panel) and the sta-tistical distribution (right panel) of the daily residual ed, for the
1990–1999 decade of reference. It can be observed that this distribution is Gaussian and, as expected, centered on 0 �C. The standard deviation
Table 3
Slope (a), vertical intercept (b), and coefficient of determination (R2) obtained when comparing the assimilated (ERA-Int) or downscaled (CORDEX Eval) daily
maximum (TMax) and minimum (Tmin) values of the temperature with the direct surface observations.
ERA-Int (2004–2010) CORDEX-EVAL (2004–2009)
Arish Cairo Asyut Aswan Arish Cairo Asyut Aswan
TMax a 1.10 1.06 0.97 0.92 1.13 1.22 1.08 1.04 b 2.2 2.3 0.1 2.6 0.8 3.7 0.8 0.3 R2 0.85 0.97 0.92 0.91 0.80 0.91 0.89 0.89 TMin a 0.88 0.98 0.94 0.87 0.83 0.92 1.04 0.94 b 2.9 3.5 2.3 2.4 0.9 6.3 5.3 6.4 R2 0.89 0.95 0.94 0.93 0.79 0.81 0.87 0.86 Table 4
Results of the adjustment of Equation (1) to the daily maximum temperatures obtained by data assimilation (ERA-Int) or model downscaling (CORDEX-Eval and CORDEX-Hist, here noted for shortness Eval. and Hist., respectively). The case considered is that of Cairo.
Tmax Tmin
ERA-Int Eval. Hist. ERA-Int Eval. Hist. Tmean 27.8 31.1 30.8 15.2 10.9 10.2
A 9.2 11.1 10.9 7.1 6.4 6.5
(SD) is 3.1 �C.
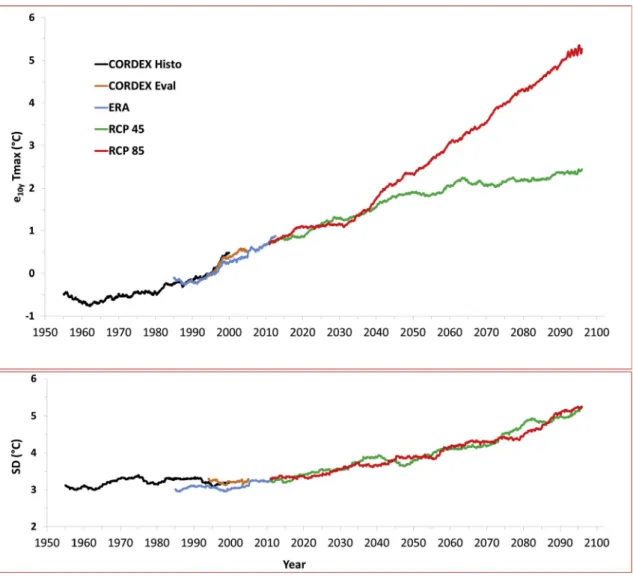
When applied to the ERA-interim and CORDEX-Eval and CORDEX- Hist data, the temporal evolutions of the 10-year moving average (e10y) are quite similar (Fig. 4), which emphasizes the consistency of the
climatological trends derived from the 3 datasets. Because the 1990–1999 reference period is outside the CORDEX-RCP45 (and RCP85) temporal domain, a small discontinuity can be observed at the beginning (1/1/2011) of the ‘future’ time series (Fig. 4.a.) but the method yields future Tmax trends that are consistent with those of the past period. With Tmin (results not shown), the discontinuity is more pronounced (about 1�). To avoid these offset problems, the ‘past’ and ‘future’
temperature trends will hereinafter be examined separately, and the reference period chosen for the quantification of the ‘future’ trends will be the first decade of the RCPs datasets, namely 2006–2015. Note-worthy, the decadal increase of Tmax and Tmin anomalies (e10y)
be-tween the 1960s and the end of the current century is also accompanied by an increase of the standard deviation (SD) of the statistical distri-bution of ed around the mean. The ensemble simulations under the two
RCP scenarios diverge after approximately 2040. According to RCP85, Tmax will increase at the average rate of 0.51 � 0.14 �C per decade
(hereinafter noted �C/10y) until the end of the century whereas with
RCP45 this rate will tend to abate. In 2095, Tmax is predicted to lie between 2.5 �C (RCP45) and 5.5 �C (RCP85) above its value of the
1990–1999 period. However, the two scenarios concur (Fig. 4b) that SD is expected to increase similarly from the current (2018) 3.3 �C to 5.2 �C
in 2095 (Tmax), or from 2.9 �C to 4.6 �C (Tmin). This general increase of
SD suggests that in Cairo the heat waves might become more severe in the future not only because of the decadal increase of the temperatures but also because of the intensified variability of the climate system around the mean. More precisely, as compared to the 37.0 � 2.5 �C of
1990–1999, the Cairo summer Tmax are expected to lie between 39.5 � 5.2 �C (RCP45) and 42.5 � 5.2 �C (RCP85) in 2095.
3.1.3. Geographical variability of the temperature trends
In order to visualize possible commonalities in the inter-annual variability of Tmax and Tmin at the 8 sites of our study, we have plotted the e1y values derived from the analysis of the ERA-interim
datasets as a function of time (Fig. 5). Despite the considerable dis-tance separating them, it can be seen that the year to year pattern is the same at all stations. For instance, strong positive Tmax and Tmin anomalies characteristics of extremely hot years are observed simulta-neously at the 8 sites in 1991, 1998, 2010, and 2015/2016. Similarly, the negative anomalies of the 1982/1983, 1991/1992, and 2011/2012 winters are also observed at all stations.
These commonalities indicate that the inter-annual variability of the Egyptian climate is in large part driven by forcings that act at a spatial scale larger than that of the Egyptian territory. At a decadal temporal scale, the slopes of the plots calculated over the 37-year period (Table 5)
are found to be undoubtedly (p-value <0.01) positive at all stations, thus confirming a global tendency towards warming. These slopes vary from 0.25 to 0.52 �C/10y for Tmax and from 0.25 to 0.50 �C/10y for Tmin. At
least over this limited period of the recent past, they do not seem to be considerably different from one place to the other. Their average values of 0.38 and 0.39 �C/10y for Tmax and Tmin, respectively, correspond to
an average increase of 1.4 � 0.4 �C of these daily minimum and
maximum temperatures in the period running from 1980 to 2017. However, despite these commonalities a closer examination of Fig. 5 reveals that the cold and hot yearly anomalies tend to be more pro-nounced at some sites such as Aswan than at the others. This suggests that the magnitude of the short-term response to the large-scale climate forcings could differ from one place to the other.
In order to quantify these differences, let us compare the SD averages calculated over the 1980–2017 period for the 8 locations of this study (Table 5). Clear inter-sites differences become apparent. For instance, the SD values of the 3 stations (El Farafra, Asyut, and Aswan) located in the very dry and hot regions of the Western Desert and Upper Egypt are the largest for Tmax (3.4, 3.4, and 3.5 �C, respectively) and also for Tmin
(2.9, 2.3, and 2.6 �C, respectively). The variability denoted by these
large SD is more important than at Hurghada (SD ¼ 3.0 �C for Tmax, and
2.0 �C for Tmin) whose latitude is similar to that of El Farafra and Asyut,
but whose climate variations are most probably dampened by the proximity of the Red Sea. In terms of inter-annual variability, Hurghada compares to Cairo. Finally, of the 3 stations of North Egypt, the one with the smallest SD values is the coastal city of Alexandria, followed by Mansoura, which is located inside the humid Nile Delta, and then by the drier city of El Arish. This west-east SD gradient can easily be explained by the well-known capacity of large liquid water bodies to moderate the amplitude of the local climate variations.
In summary, it has been established that the Egyptian climate is currently warming at a rate of about 0.4 � 0.1 �C/10y but the detailed
analysis of the past 37 years of ERA-Interim data has not allowed differentiating with certainty the climatological (decadal) temperature trends of the 8 selected locations. However, differences in the ampli-tudes of the local temperature response to large-scale forcings affecting Egypt have been evidenced at the yearly time scale. When cumulated over the long term, these differences of local climate sensitivity could induce a significant sub-regional differentiation of the effects of global warming. In order to address this point of crucial importance for the design and adoption of remediation measures, we have used the CORDEX-Historical data to extend our period of study towards the past, and the ensemble of 6 CORDEX projections under the 2 RCP scenarios to extend it towards the future. Fig. 6 displays the results for Tmax. The results of a more detailed quantification of the evolution of Tmax and Tmin between 1960 and 2095 are reported in Table 6. They show that between 1960 and 2010, Tmax has been increasing at an average rate of 0.27 � 0.03 �C/10y, and that the temperature in 2010 was 1.3 � 0.1 �C
Fig. 3. 1) Temporal evolution of the ERA-Interim daily maximum temperature (Tmax) between 1/1/1990 and 31/12/1999 in Cairo (left panel). The continuous line
represents the sinusoidal best-fit to these data and 2) statistical distribution of the daily deviations (ed) from this sinusoidal pattern (right panel). The black
above that of 1960 at all stations. For Tmin, the rate of increase is slightly more variable but on the whole, Tmin has also increased by 1.3 � 0.3 �C in this period. This shows again that, in the recent past, no
significant sub-regional differences in the response of the Egyptian climate to the global forcings can be evidenced. Conversely, according to the ensemble simulations, Tmax and Tmin will continue to increase under the two RCP scenarios but at rates differing from one station to the other. For instance, between 2010 and 2040, RCP45 predicts for Alex-andria and Mansoura a Tmax rate of increase of 0.28 and 0.31�/10y,
respectively, which is significantly less than the 0.39 �C/10y of
Hur-ghada and Aswan. With RCP85, the rates are similar to those of RCP45 before 2040 and the contrast between the stations is maintained. As already discussed for Cairo, the main difference between the two RCPs concerns the evolution pattern after approximately the middle of the century: with RCP45, the increase tends to abate whereas it is un-changed or even slightly accelerated with RCP85. In the latter case, the maximum temperatures in 2090–2100 would be more than 4.5 �C above
those of the 2006–2015 reference decade in El Farafra, Asyut, Hurghada, and Aswan. In this dramatic case, the summer Tmax values would lie between 45.7 (Hurghada) and 48.4 �C (Aswan).
Interestingly, the minimal temperatures would have increased faster (by more than 5 �C) at the same locations. In comparison, with their
temperature rise of 3.4–4.1 �C, the 4 stations of northern Egypt
(Alex-andria, Mansoura, El Arish, and Cairo) appear as relatively less sensitive to the effects of global warming than the rest of Egypt.
3.2. Extreme temperatures
In the recent past, the whole Egyptian territory has been affected by a series of heat waves among which those of 2010 or 2015 are estimated to have caused more than one hundred deaths. In 2010, the yearly aver-aged Tmax anomalies (e1y) varied from 1.4 (Alexandria) to 2.6 �C
(Hurghada), and those of Tmin between 1.2 (Alexandria) and 1.8 �C (El
Arish). The CLIMDEX indices relevant for our region of study (su25, wsdi, csdi, TX90P, TN90P, TX10P, and TN10P) allow quantifying the temporal evolution of the frequency of these extremes over the past (1980–2017) and future (2006–2100) periods. For this analysis, the CLIMDEX software has been applied to the ensemble mean with the 2006–2015 decade selected as the reference. The TX90P, TN90P, TX10P, and TN10P results for Cairo are displayed in Fig. 7. The fre-quencies of the hot days (TX90P) and nights (TN90P) have clearly already increased between 1980 and 2017, whereas those of the cold days (TX10P) and nights (TN10P) have decreased. The tendency will continue in the future at a rate depending on the scenario but in the last decade of the current century, the frequency of extremely hot days and nights will have been multiplied by a factor comprised between 3 and 5 (TX90P ¼ 35 � 4% and TN90P ¼ 49 � 4%) according to RCP45 and be-tween 7 and 10 (TX90P ¼ 76 � 5% and TN90P ¼ 95 � 3%) according to RCP85. As already shown above in the study of the temperature trends, the night temperatures are expected to increase even faster than the day ones.
Fig. 4. Evolution between 1950 and 2100 of the 1) 10-year moving average of the Tmax anomalies (upper panel) and 2) standard deviation of these anomalies
The slopes and confidence intervals of the trends of the selected indices are reported for all the stations in Table 7. Note that the data missing in the table are those for which the p-value was above 5%, and thus could not be considered as being statistically significant. These missing data concern mostly the future evolution of the cold spell duration index, an index that will become less relevant as the cold days will tend to become very rare in the future. In the table, the slopes in bold characters are those larger than the average�1SD threshold. It can be seen that the majority of these large slopes correspond to Alexandria in the recent past but to Hurghada and Aswan in the near and farther future. In particular, the frequencies of hot days (TX90P) and nights (TN90P) are expected to increase more rapidly in the last two cities than in the rest of Egyptian, which is consistent with the fact that the decadal rates of warming were shown to be among the largest at these two locations.
Regarding the recent and the future evolutions of the extreme indices, the contrast between the 8 locations of this study can be quantified more precisely by the means of the relative standard devia-tion (rsd ¼ SD/average, in %) of the slopes. For all the indices, rsd is smaller (8 � 5%) with the RCP85 scenario than with RCP45 (18 � 11%) or with the ERA-Interim data (62 � 26%). This suggests that -regarding the increasing trend of the hot extremes - the geographical contrast currently observed between the different regions of Egypt will persist if the warming is relatively limited (RCP45) but that it will tend to be smoothed out if the warming gets out of control (RCP85). This would be dramatic for the Egyptian population as it would mean that no region would be spared the consequences of an evolution of the extreme indices about 3 times faster under RCP85 than under RCP45.
3.3. Precipitation
Unlike those of temperatures, the precipitation records of the 8 sites are not available from 1950, but only from 1980 to 2100 when combining the ERA-Interim and ensemble CORDEX-RCP time series. Using the ERA-Interim data, it can easily be calculated that between 1980 and 2017 the average of the yearly precipitation varied from less than 1 mm (in El Farafra and Asyut) to 192 mm in Alexandria (Table 8). In Alexandria, Mansoura, and El Arish, RX5days represents 21, 24, and 26% of the annual precipitation, respectively. This proportion reaches 51% in Cairo, 80% in Hurghada, and 100% at the other locations, which emphasizes that except in the north of the country the bulk of the annual precipitation occurs during single rain episodes lasting less than 5 days. Over the limited period of the ERA-Interim data, the CLIMDEX analysis does not reveal any significant trend of PRCPTOT or RX5days. This is not the case over the longer duration of the CORDEX-RCP time series from the analysis of which a significant decrease of PRCPTOT is expected (Table 8) in the relatively rainy north (Alexandria, Mansoura, El Arish). This predicted decrease is from 1.5 to 2 times faster under RCP85 than under RCP45 and essentially due fewer rainy days rather than to a decrease of the average intensity of the precipitation that should not vary significantly (these results of the CLIMDEX analysis are not detailed here). In the dryer locations of Cairo and Hurghada, PRCPTOT is also expected to be lower in the future but only under RCP85.
4. Conclusion
For analyzing the evolution of climate at a regional or sub-regional scale, one needs long-term temperature and precipitation observa-tional records that are hard to obtain or even missing for entire parts of the world such as the Middle East/North Africa region (MENA). For the Egyptian territory, we showed that there is an apparent bias in the CORDEX dataset (i.e. large underestimation of Tmin in some cities). This means that a bias correction is necessary if the CORDEX models are to be used for impact studies (e.g. health or crop modeling). If such a
Fig. 5. Inter-annual variability of the Tmax and Tmin anomalies at the 8
sta-tions of this study.
Table 5
Results of the analysis of the ERA-Interim data of the 1980–2017 period. The slopes of the Tmax and Tmin trends and their interval of confidence are expressed in �C per
decade (�C/10y). SD (in �C) is the standard deviation of the temperature anomalies (with respect to the 1990–1999 reference decade) averaged over the whole period.
Station Alex. Mans. El Ar. Cairo El Far. Asyut Hurgh. Aswan
Tmax Slope 0.42 0.25 0.52 0.35 0.32 0.34 0.46 0.34 (þ/ ) 0.04 0.07 0.07 0.07 0.06 0.07 0.08 0.09 p-value <0.01 <0.01 <0.01 <0.01 <0.01 <0.01 <0.01 <0.01 SD 1.37 2.39 3.33 3.08 3.37 3.44 2.96 3.46 (þ/ ) 0.14 0.23 0.30 0.29 0.35 0.35 0.25 0.36 Tmin Slope 0.43 0.34 0.49 0.46 0.25 0.44 0.22 0.50 (þ/ ) 0.04 0.06 0.05 0.06 0.06 0.06 0.07 0.07 p-value <0.01 <0.01 <0.01 <0.01 <0.01 <0.01 <0.01 <0.01 SD 1.17 1.92 1.99 1.99 2.93 2.30 1.99 2.63 (þ/ ) 0.12 0.12 0.20 0.19 0.24 0.23 0.22 0.30
correction were not applied, the underestimation would affect the future projections and the actual future warming might be much larger than suggested by the models. Despite these biases problems, we also showed that the decadal temperature trends in the reanalysis (ERA-Interim) and the downscaled CORDEX data constrained by ERA-Interim were similar and could thus be used as substitutes for the missing actual observations of the recent past. Between 1960 and 2010, Tmax and Tmin have increased at comparable rates (0.27 � 0.03 and 0.30 � 0.07 �C/10y,
respectively) at the 8 stations of this study. Between 1980 and 2017, this decadal rate had increased (0.40 � 0.1 �C/10y) thus denoting an
accel-eration of the warming but no clear difference between the eight sites could be evidenced. However, when analyzing the variability of the temperature anomalies at the shorter inter-annual temporal scale, the climates of the sites located in the arid environments (El Farafra; Asyut; Aswan) appeared as being more sensitive to the variations of the global climate forcings than those of the sites located in the coastal (Alexan-dria; Hurghada) or relatively humid (Mansoura) environments. When integrated over the long-term, these differences of sensitivities explain that the ensemble CORDEX simulations performed under both the RCP45 and RCP85 scenarios predict a faster decadal warming at the continental sites than at the coastal ones. For instance, in 2090 Tmax will be between 2.0 � 0.6 �C (RCP45) and 5.6 � 0.5 �C (RCP85) above its
2006–2015 values in Aswan, which corresponds to summer Tmax values of 45.1 and 48.7 �C, respectively. In comparison, the Tmax increase
would be 1.5 � 0.2 �C (RCP45) and 3.5 � 1.0 �C (RCP85) in Alexandria
with a summer Tmax range of 27.7/29.7 �C. These values correspond to
average rates of increase ranging from 0.16 to 0.22 �C/10y (RCP45) or
from 0.55 to 0.62 �C/10y (RCP85). Under the RCP4.5 scenario, this
range of variation compares to the pace of evolution of the global mean surface temperature, which according to the AR5 of the IPCC (2014) is likely to be 0.19 � 0.08 �C/10y from 1986 to 2005 to 2090–2100.
However, with the less optimistic RCP85 scenario, the warming would occur much faster at all Egyptian sites than at global scale (0.37 � 0.11 �C/10y according to the IPCC).
The analysis of the time series of CLIMDEX indices of temperature extremes indicates that the number of hot days and nights in a year will increase faster in Upper Egypt (Aswan) and along the Red Sea (Hur-ghada) than in the rest of the country. As with the decadal temperature trends, these infra-regional differences are more marked under the RCP45 scenario than under the RCP85 one. In the latter case, the fre-quency of extremely hot days in a year would reach about 80% at all sites in the last decade of this century, a value considerably above the 30–50% of the RCP45 scenario and the 10% of the 2006–2015 reference period.
For precipitation, the analysis of the ERA-Interim data did not indi-cate a significant trend over the last 37 years. Conversely, the ensemble simulations under the two RCP scenarios predict a general decrease of the annual precipitations in the north. This decrease is also expected to be faster in Alexandria ( 0.93 to 1.40 mm/y for RCP45 and RCP85, respectively) than in Mansoura ( 0.53 and 1.03mm/y) and El Arish ( 0.48 and 0.95 mm/y). In Cairo and Hurghada, the current annual precipitations are much lower than at the northern sites and a significant
Fig. 6. Past (upper panel) and future (lower panels) temporal evolution of the Tmax anomalies at the 8 sites of this study. The decade of reference is 1990–1999 for
Table 6
Average rate of evolution (slope, in �C/decade) and standard deviations (in parenthesis) of the maximal and minimal daily temperatures in the past (1960–2010),
current/near-future (2010–2040), and far-future (2050–2095) periods. For the past period, the difference of temperature between years 2010 and 1960 is indicated (in
�C). For the near and far future, the temperatures predicted by the ensemble simulations under the two RCP scenarios for the last decade of this century (2095) are
compared to those of 2010 (ΔT2095/2010) and 1960 (ΔT2095/1960).
Period Alex. Mans. El Ar. Cairo El Far. Asyut Hurg. Aswan
Tmax HIST. 1960–2010 slope 0.28 0.25 0.31 0.27 0.28 0.23 0.29 0.26 ΔT2010/1960 1.3 1.2 1.5 1.3 1.3 1.1 1.4 1.1 RCP45 2010–2040 Slope 0.28 (0.04) 0.31 (0.04) 0.31 (0.04) 0.33 (0.04) 0.34 (0.06) 0.36 (0.06) 0.39 (0.05) 0.38 (0.09) ΔT2040/2010 0.8 (0.1) 0.8 (0.1) 0.8 (0.1) 0.9 (0.1) 1.0 (0.2) 1.0 (0.2) 1.0 (0.2) 1.0 (0.2) 2050–2095 Slope 0.11 (0.07) 0.11 (0.1) 0.11 (0.07) 0.12 (0.08) 0.12 (0.08) 0.12 (0.09) 0.14 (0.06) 0.14 (0.08) ΔT2095/2010 1.4 (0.2) 1.5 (0.2) 1.5 (0.2) 1.7 (0.3) 1.7 (0.3) 1.8 (0.3) 1.9 (0.3) 1.9 (0.5) ΔT2095/1960 2.7 (0.2) 2.7 (0.2) 3.0 (0.2) 3.0 (0.3) 3.0 (0.3) 2.9 (0.3) 3.3 (0.3) 3.0 (0.5) RCP85 2010–2040 Slope 0.24 (0.14) 0.28 (0.18) 0.29 (0.17) 0.30 (0.15) 0.32 (0.15) 0.33 (0.16) 0.40 (0.13) 0.40 (0.12) ΔT2040/2010 0.9 (0.2) 1.0 (0.3) 1.0 (0.3) 1.1 (0.2) 1.2 (0.3) 1.2 (0.3) 1.3 (0.2) 1.3 (0.2) 2050–2095 slope 0.48 (0.18) 0.58 (0.02) 0.57 (0.02) 0.56 (0.21) 0.65 (0.04) 0.66 (0.06) 0.65 (0.08) 0.70 (0.09) ΔT2095/2010 3.4 (0.9) 4.0 (0.3) 4.1 (0.4) 4.1 (1.2) 4.7 (0.4) 4.9 (0.5) 4.8 (0.5) 5.3 (0.5) ΔT2095/1960 4.7 (0.9) 5.2 (0.3) 5.6 (0.4) 5.4 (1.2) 6.0 (0.4) 6.0 (0.5) 6.2 (0.5) 6.4 (0.5) Tmin HIST. 1960–2010 slope 0.31 0.26 0.33 0.34 0.32 0.34 0.15 0.33 ΔT2010/1960 1.3 1.2 1.6 1.6 1.3 1.6 0.6 1.5 RCP45 2010–2040 slope 0.32 (0.03) 0.34 (0.02) 0.32 (0.04) 0.37 (0.07) 0.40 (0.14) 0.41 (0.13) 0.42 (0.09) 0.41 (0.16) ΔT2040/2010 0.8 (0.1) 0.8 (0.1) 0.8 (0.1) 0.9 (0.2) 1.1 (0.4) 1.1 (0.4) 1.1 (0.3) 1.1 (0.4) 2050–2095 slope 0.13 (0.07) 0.14 (0.07) 0.14 (0.06) 0.16 (0.07) 0.17 (0.06) 0.16 (0.07) 0.15 (0.04) 0.16 (0.08) ΔT2095/2010 1.5 (0.2) 1.6 (0.2) 1.6 (0.3) 1.7 (0.3) 1.9 (0.5) 2.0 (0.5) 1.9 (0.4) 2.0 (0.6) ΔT2095/1960 2.8 (0.2) 2.8 (0.2) 3.2 (0.3) 3.3 (0.3) 3.2 (0.5) 3.6 (0.5) 2.5 (0.4) 3.5 (0.6) RCP85 2010–2040 slope 0.31 (0.11) 0.32 (0.13) 0.33 (0.14) 0.34 (0.14) 0.36 (0.17) 0.39 (0.17) 0.42 (0.17) 0.44 (0.18) ΔT2040/2010 0.9 (0.2) 1.0 (0.2) 1.0 (0.3) 1.1 (0.3) 1.2 (0.3) 1.3 (0.3) 1.3 (0.3) 1.4 (0.3) 2050–2095 slope 0.50 (0.17) 0.60 (0.03) 0.59 (0.06) 0.55 (0.20) 0.72 (0.05) 0.72 (0.06) 0.65 (0.05) 0.74 (0.06) ΔT2095/2010 3.5 (1.0) 4.1 (0.4) 4.1 (0.6) 4.0 (1.2) 5.1 (0.7) 5.2 (0.7) 4.8 (0.4) 5.6 (0.6) ΔT2095/1960 4.8 (1.0) 5.3 (0.4) 5.7 (0.6) 5.6 (1.2) 6.4 (0.7) 6.8 (0.7) 5.4 (0.4) 6.7 (0.6)
Fig. 7. Recent (ERA-Int) and future (RCP45 and RCP85) evolution of the frequency of extremely 1) hot days (TX90P) and nights (TN90P), and 2) cold days (TX10P)
decrease ( 0.22 and 0.37 mm/y, respectively) of the annual pre-cipitations is predicted by the ensemble simulations only under RCP85. Acknowledgments
This work is a contribution to the Egyptian-French ‘Health mapping for infectious diseases vulnerable to climate change’ project funded by the Imhotep program (Grant no. 37485VE). The authors are grateful to the WMO ETCCDI who developed and distributed the CLIMDEX soft-ware under the Linkage Project LP100200690. They have also benefited from the constructive remarks of Jana Sillmann, associate editor at the WACE Journal.
References
Berrisford, P., Dee, D.P., Poli, P., Brugge, R., Fielding, K., Fuentes, M., Kållberg, P.W., Kobayashi, S., Uppala, S., Simmons, A., 2011. The ERA-Interim Archive Version 2.0. ERA Report Series 1. http://www.ecmwf.int/en/elibrary/8174-era-interim-archive -version-20.
Bucchignani, E., Mercogliano, P., Panitz, H.J., Montesarchio, M., 2018. Climate change projections for the Middle East-North Africa domain with COSMO-CLM at different spatial resolutions. Adv. Clim. Change Res. 9, 66–80.
Christensen, J.H., Hewison, B., Busuioc, A., et al., 2007. Regional climate projections. In: Solomon, S., Qin, D., Manning, M., et al. (Eds.), Climate Change 2007: the Physical Science Basis. Contribution of Working Group I to the Fourth Assessment Report of the Intergovernmental Panel on Climate Change. Cambridge University Press, Cambridge and New York, 2007.
Christensen, J.H., Krishna Kumar, K., Aldrian, E., An, S.-I., Cavalcanti, I.F.A., de Castro, M., Dong, W., Goswami, P., Hall, A., Kanyanga, J.K., Kitoh, A., Kossin, J., Lau, N.-C., Renwick, J., Stephenson, D.B., Xie, S.-P., Zhou, T., 2013. Climate phenomena and their relevance for future regional climate change. In: Stocker, T.F., Qin, D., Plattner, G.-K., Tignor, M., Allen, S.K., Boschung, J., Nauels, A., Xia, Y., Bex, V., Midgley, P.M. (Eds.), Climate Change 2013: the Physical Science Basis. Contribution of Working Group I to the Fifth Assessment Report of the Intergovernmental Panel on Climate Change. Cambridge University Press, Cambridge, United Kingdom and New York, NY, USA.
Donat, M.G., et al., 2013. Updated analyses of temperature and precipitation extreme indices since the beginning of the twentieth century: the HadEX2 dataset. J. Geophys. Res. Atmos. 118 https://doi.org/10.1002/jgrd.50150.
Dee, D.P., Uppala, S.M., Simmons, A.J., Berrisford, P., Poli, P., Kobayashi, S., Andrae, U., Balmaseda, M.A., Balsamo, G., Bauer, P., Bechtold, P., Beljaars, A.C.M., van de Berg, L., Bidlot, J., Bormann, N., Delsol, C., Dragani, R., Fuentes, M., Geer, A.J., Haimberger, L., Healy, S.B., Hersbach, H., H�olm, E.V., Isaksen, L., Kallberg, P., Kohler, M., Matricardi, M., McNally, A.P., Monge-Sanz, B.M., Morcrette, J.-J., Park, B.-K., Peubey, C., de Rosnay, P., Tavolato, C., Th�epaut, J.-N., Vitart, F., 2011. The ERA-Interim reanalysis: configuration and performance of the data assimilation system. Q. J. R. Meteorol. Soc. 137, 553–597. https://doi.org/10.1002/qj.828. Giorgi, F., Lionello, P., 2008. Climate change projections for the Mediterranean region.
Glob. Planet. Chang. 63 (2–3), 90–104.
IPCC, 2007. In: Solomon, S., Qin, D., Manning, M., Chen, Z., Marquis, M., Averyt, K.B., Tignor, M., Miller, H.L. (Eds.), Climate Change 2007: the Physical Science Basis. Contribution of Working Group I to the Fourth Assessment Report of the Intergovernmental Panel on Climate Change. Cambridge University Press, Cambridge, UK and New York, NY, 996 pp.
IPCC, 2013. In: Stocker, T.F., Qin, D., Plattner, G.-K., TignorM, Allen, S.K., Boschung, J., Nauels, A., Xia, Y., Bex, V., Midgley, P.M. (Eds.), Climate Change 2013: the Physical Science Basis. Contribution of Working Group I to the Fifth Assessment Report of the Intergovernmental Panel on Climate Change. Cambridge University Press, Cambridge, UK and New York, NY, 1535 pp.
Table 7
Slopes and confidence intervals (CI) of the trends of a selection of CLIMDEX indices. The periods considered are 1980–2017 (ERA-Int) and 2006–2100 (RCP45 and RCP85). The units are either days/year (su25, wsdi, csdi) or %/year (TX90P, TN90P, TX10P, and TN10P). For each index, the average and standard deviation (SD) are also reported. The values in bold characters are those outside the average�1SD interval.
Indices Slope (CI)
Period Alex. Mans. El Ar. Cairo El Far. Asyut Hurg. Aswan Average (SD) su25 ERA-Int 1.75 (0.20) 0.37 (0.18) 0.78 (0.16) 0.63 (0.17) 0.42 (0.16) 0.52 (0.18) 0.74 (0.20) 0.51 (0.20) 0.72 (0.42) RCP45 0.26 (0.03) 0.22 (0.03) 0.25 (0.03) 0.21 (0.03) 0.23 (0.03) 0.25 (0.04) 0.34 (0.03) 0.36 (0.04) 0.26 (0.06) RCP85 0.69 (0.03) 0.75 (0.03) 0.75 (0.03) 0.65 (0.04) 0.63 (0.03) 0.74 (0.04) 0.98 (0.04) 0.82 (0.04) 0.75 (0.11) wsdi ERA-Int 0.10 (0.04) – 0.33 (0.17) 0.52 (0.19) – – 0.74 (0.22) 0.66 (0.21) RCP45 0.91 (0.07) 0.93 (0.07) 0.71 (0.06) 0.90 (0.06) 1.02 (0.06) 0.98 (0.05) 1.90 (0.08) 1.46 (0.07) 1.10 (0.39) RCP85 3.23 (0.11) 3.54 (0.11) 3.25 (0.11) 3.10 (0.10) 3.33 (0.10) 3.36 (0.10) 4.44 (0.11) 3.93 (0.10) 3.52 (0.45) csdi ERA-Int ¡3.11 (0.40) 0.32 (0.10) 0.34 (0.10) 0.46 (0.09) 0.16 (0.06) 1.55 (0.20) 0.42 (0.19) 0.71 (0.20) 0.88 (0.99) RCP45 – – 0.02 (0.01) – – – – 0.07 (0.02) – RCP85 0.01 (0.01) 0.02 (0.01) 0.01 (0.01) 0.03 (0.02) 0.05 (0.01) 0.06 (0.02) 0.04 (0.01) ¡0.08 (0.02) 0.04 (0.02) TX90P ERA-Int 0.33 (0.05) 0.13 (0.06) 0.28 (0.06) 0.21 (0.07) 0.18 (0.06) 0.16 (0.07) 0.36 (0.08) 0.28 (0.07) 0.24 (0.08) RCP45 0.32 (0.02) 0.33 (0.02) 0.29 (0.02) 0.30 (0.02) 0.31 (0.02) 0.29 (0.02) 0.53 (0.02) 0.44 (0.02) 0.35 (0.09) RCP85 0.87 (0.02) 0.93 (0.02) 0.89 (0.02) 0.83 (0.02) 0.87 (0.02) 0.88 (0.02) 1.11 (0.03) 1.01 (0.02) 0.92 (0.09) TN90p ERA-Int 0.38 (0.06) 0.28 (0.06) 0.52 (0.08) 0.46 (0.09) 0.10 (0.05) 0.21 (0.06) 0.21 (0.06) 0.32 (0.07) 0.31 (0.14) RCP45 0.57 (0.02) 0.59 (0.02) 0.48 (0.02) 0.49 (0.02) 0.45 (0.02) 0.46 (0.02) 0.68 (0.03) 0.56 (0.02) 0.54 (0.08) RCP85 1.14 (0.03) 1.18 (0.03) 1.14 (0.03) 1.11 (0.03) 1.14 (0.03) 1.13 (0.03) 1.21 (0.04) 1.19 (0.03) 1.15 (0.04) TX10P ERA-Int ¡1.20 (0.14) 0.29 (0.10) 0.39 (0.05) 0.28 (0.05) 0.26 (0.04) 0.30 (0.06) 0.37 (0.06) 0.23 (0.06) 0.42 (0.33) RCP45 0.09 (0.01) 0.09 (0.01) 0.09 (0.01) 0.09 (0.01) 0.08 (0.01) 0.08 (0.01) 0.10 (0.01) 0.10 (0.01) 0.09 (0.01) RCP85 0.15 (0.01) 0.14 (0.01) 0.14 (0.01) 0.14 (0.01) 0.14 (0.01) 0.14 (0.01) 0.14 (0.01) 0.14 (0.01) 0.14 (0.01) TN10p ERA-Int ¡1.16 (0.13) 0.43 (0.09) 0.58 (0.06) 0.52 (0.06) 0.31 (0.04) 0.74 (0.08) 0.35 (0.10) 0.59 (0.07) 0.59 (0.27) RCP45 0.11 (0.01) 0.11 (0.01) 0.11 (0.01) 0.11 (0.01) 0.11 (0.01) 0.10 (0.01) 0.10 (0.01) 0.11 (0.01) 0.11 (0.01) RCP85 0.13 (0.01) 0.13 (0.01) 0.13 (0.01) 0.13 (0.01) 0.14 (0.01) 0.13 (0.01) 0.13 (0.01) 0.14 (0.01) 0.13 (0.01) Table 8
Average and standard deviation (in mm) of the annual precipitation (PRCPTOT) in the ERA (1980–2017) period. The slope and confidence interval (in mm/y) and the p-value (in %) characterizing the future evolution of these annual precipitation assuming either the RCP45 or the RCP85 scenarios are also reported.
Alex. Mans. El Ar. Cairo El Far. Asyut Hurgh. Aswan
ERA-Int Ave. 192 89 72 18 0 0 10 3 SD 62 36 36 15 0 1 18 6 RCP45 Slope 0.93 0.53 0.48 – 0.04 – – 0.15 CI 0.38 0.22 0.23 – 0.02 – – 0.06 p-value 2% 2% 4% – 2% – – 1% RCP85 Slope 1.40 1.03 0.95 0.22 – – 0.37 – CI 0.36 0.22 0.24 0.05 – – 0.08 – p-value 0% 0% 0% 0% – – 0% –
IPCC, 2014. In: Pachauri, R.K., Meyer, L.A. (Eds.), Climate Change 2014: Synthesis Report. Contribution of Working Groups I, II and III to the Fifth Assessment Report of the Intergovernmental Panel on Climate Change [Core Writing Team. IPCC, Geneva, Switzerland, 151 pp.
Korany, M., Boraiy, M., Eissa, Y., Aoun, Y., Abdel Wahab, M.M., Alfaro, S.C., Blanc, P., El-Metwally, M., Ghedira, H., Hungershoefer, K., Wald, L., 2016. A database of multi-year (2004-2010) quality-assured surface solar hourly irradiation
measurements for the Egyptian territory. Earth Syst. Sci. Data 8, 105–113. https:// doi.org/10.5194/essd-8-105-2016. www.earth-syst-sci-data.net/8/105/2016/. Lelieveld, J., Proestos, Y., Hadjinicolaou, P., et al., 2016. Strongly increasing heat extremes in the Middle East and North Africa (MENA) in the 21st century. Clim. Change 137, 245–260. https://doi.org/10.1007/s10584-016-1665-6.
Sillmann, J., Kharin, V.V., Zhang, X., Zwiers, F.W., Bronaugh, D., 2013. Climate extremes indices in the CMIP5 multimodel ensemble: Part 1. Model evaluation in the present
climate. J Geophys Res Atmos 118, 1716–1733. https://doi.org/10.1002/jg rd.50203.
United Nations, Department of Economic and Social Affairs, Population Division, 2017. World Population Prospects: the 2017 Revision, Key Findings and Advance Tables. Working Paper No. ESA/P/WP/248, 53pp.
van Oldenborgh, G.J., Drijfhout, S.S., van Ulden, A.P., Haarsma, R., Sterl, A., Severijns, C., Hazeleger, W., Dijkstra, H.A., 2009. Western Europe is warming much faster than expected. Clim. Past 5, 1–12.
Zhang, X., Alexander, L., Hegerl, G.C., Jones, P., Tank, A.K., Peterson, T.C., Trewin, B., Zwiers, F.W., 2011. Indices for monitoring changes in extremes based on daily temperature and precipitation data. WIREs Clim. Chang. 2, 851–870. https://doi. org/10.1002/wcc.147.