HAL Id: hal-02891665
https://hal.inria.fr/hal-02891665v2
Submitted on 10 Sep 2020
HAL is a multi-disciplinary open access
archive for the deposit and dissemination of
sci-entific research documents, whether they are
pub-lished or not. The documents may come from
teaching and research institutions in France or
abroad, or from public or private research centers.
L’archive ouverte pluridisciplinaire HAL, est
destinée au dépôt et à la diffusion de documents
scientifiques de niveau recherche, publiés ou non,
émanant des établissements d’enseignement et de
recherche français ou étrangers, des laboratoires
publics ou privés.
Dataset
Nicolas Turpault, Romain Serizel
To cite this version:
Nicolas Turpault, Romain Serizel. Training Sound Event Detection On A Heterogeneous Dataset.
DCASE Workshop, Nov 2020, Tokyo, Japan. �hal-02891665v2�
TRAINING SOUND EVENT DETECTION ON A HETEROGENEOUS DATASET
Nicolas Turpault, Romain Serizel
Universit´e de Lorraine, CNRS, Inria, Loria, F-54000 Nancy, France
ABSTRACT
Training a sound event detection algorithm on a heterogeneous dataset including both recorded and synthetic soundscapes that can have various labeling granularity is a non-trivial task that can lead to systems requiring several technical choices. These technical choices are often passed from one system to another without being questioned. We propose to perform a detailed analysis of DCASE 2020 task 4 sound event detection baseline with regards to several aspects such as the type of data used for training, the parameters of the mean-teacher or the transformations applied while generating the synthetic soundscapes. Some of the parameters that are usually used as default are shown to be sub-optimal.
Index Terms— Sound event detection, weakly labeled data, semi-supervised learning, synthetic soundscapes, ablation study
1. INTRODUCTION
Ambient sound analysis aims at extracting information from the soundscapes that constantly surround us [1]. Many ambient sound analysis applications, ranging from urban planning to home assisted living, have surfaced within the past few years [2, 3, 4, 5, 6, 7]. Most of these were inspired by the fact that we, humans constantly rely on the soundscapes around us to decide on how to act or react.
Sound event detection (SED) is a task of the ambient sound analysis that consists not only in predicting what sound event did occur in a recording but also to detect when it did happen. Intu-itively, the simplest way to solve this problem with a system relying on supervised training would be to use a training dataset composed of so-called strongly labeled soundscapes (with onset and offset timestamps). However strongly labeling a sufficiently large dataset is prohibitive. Strong label annotations are also very likely to con-tain human errors/disagreement given the ambiguity in the percep-tion of some sound event onsets and offsets. One alternative is too rely on so-called weakly labeled soundscapes (without timestamp) that are considerably cheaper to obtain [8]. In the case of weakly labeled data, we only have information about whether an event is present in a recording or not. We have no information about how many times the event occurs nor the temporal locations of the occur-rences within the audio clip. However, there are quite a few short-coming in exploiting weakly labels soundscapes [9, 10, 11]. An-other, cheaper, option is to generate realistic soundscapes that can then easily be strongly labeled [12]. The problem in this latter case is that is that there might be some mismatch between the synthetic
This work was made with the support of the French National Re-search Agency, in the framework of the project LEAUDS Learning to under-stand audio scenes (ANR-18-CE23-0020) and the French region Grand-Est. Experiments presented in this paper were carried out using the Grid5000 testbed, supported by a scientific interest group hosted by Inria and includ-ing CNRS, RENATER and several Universities as well as other organiza-tions (see https://www.grid5000).
soundscapes generated for training and the recorded soundscapes fed to the SED at runtime.
In DCASE 2019 task 4 [13] we proposed to try solving the above problems by designing DESED, a dataset composed of weakly-labeled and unlabeled recorded soundscapes and strongly labeled synthetic soundscapes generated with Scaper [12]. Ex-ploiting such a heterogeneous dataset all together is not necessarily trivial. The baseline was inspired by previous submissions to the challenge [14, 15] and developed incrementally (and so are quite a few systems trying to solve this task). These two aspects led to a solution that is involving a lot of different technical choices that were rarely clearly motivated in the literature. These choices are frequently passed from one system to another without being ques-tioned.
The aim of this paper is to propose a detailed analysis of DCASE 2019 task 4 baseline [13]. The ablation study includes the analysis of aspects such as the kind of data used for training, the pa-rameters for the mean-teacher or the transformation applied on the synthetic soundscapes dataset. The conclusion of this study leads to a system that is close to the baseline for DCASE 2020 task 4.
2. PROBLEM STATEMENT AND BASELINE DESCRIPTION
2.1. Problem description
The problem we try to solve here is similar to that of DCASE 2019 task 4 [13] and focuses on the same 10 classes of sound events. Systems are expected to produce strongly labeled output (i.e. detect sound events with a start time, end time, and sound class label), but are provided with weakly labeled clips for training (i.e. audio clips with labels mentioning only the presence/absence of a sound event without any timing information). Multiple events can be present in each audio clip, including overlapping events. As in the previous iteration of this task, the challenge entails exploiting a large amount of unbalanced and unlabeled training data together with a small weakly annotated training set to improve system performance and an additional training set with strongly annotated synthetic sound-scapes.
2.2. Sound event detection baseline
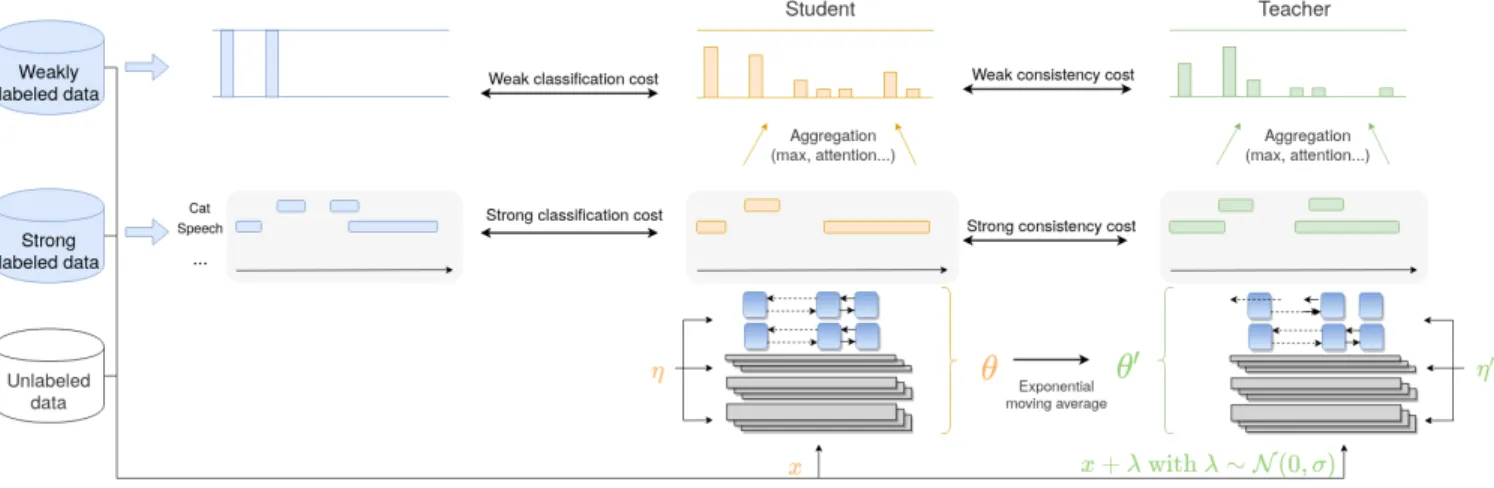
The SED baseline system is inspired by the best performing system from DCASE 2018 task 4 [14] and the improvement provided by the second best performing system in DCASE 2019 task 4 [15]. It uses a mean-teacher model which is a combination of two models: a student model and a teacher model (both have the same architec-ture). The student model is the final model used at inference time, while the teacher model aims at helping the student model during training. Its weights are an exponential moving average of the stu-dent model’s weights. A depiction of the baseline model is provided
Figure 1: Mean-teacher model. η and η0represent noise applied to the different models (in this case dropout).
in Figure 1. Through the consistency costs, this approach allows for exploiting both labeled and unlabeled data.
Our implementation of the mean-teacher model is based on the work of Tarvainen and Valpola [16]. The models are a combination of convolutional neural network (CNN) and recurrent neural net-work (RNN) called CRNN. The model architecture is inspired by DCASE 2019 task 4 second to best system.
Every batch contains a combination of unlabeled, weakly and strongly labeled clips. The student model is trained with the clas-sification costs only on the strongly and weakly labeled clips. The loss (binary cross-entropy) is computed at the frame level for the strongly labeled synthetic clips and at the clip level for the weakly labeled clips. The teacher model is not trained, its weights are a moving average of the student model (at each epoch). During train-ing, the teacher model receives the same input as the student model but with additive Gaussian noise. It helps to train the student model via a consistency loss (mean-squared error) for both strong (frame-level) and weak (clip-(frame-level) predictions for all the clips in the batch (including unlabeled clips).
3. BASELINE SETUP AND DATASET
3.1. DESED dataset
The dataset used for SED experiments is DESED1, a flexible dataset for SED composed of 10-sec soundscapes recorded in a domes-tic environment or synthesized to simulate a domesdomes-tic environ-ment [13, 17]. The recorded soundscapes are taken from Au-dioSet [18]. The synthetic soundscapes are generated using Sca-per [12], a python library for soundscape synthesis and augmen-tation. The foreground events are obtained from the Freesound Dataset (FSD50k) [19, 20]. The background textures are obtained from the SINS dataset (activity class “other”) [21] and TUT scenes 2016 development dataset [22].
The dataset includes a validation set and a public evaluation set composed of recorded clips (VAL and EVAL) that are used to adjust the hyper-parameters and evaluate the SED, respectively. All the experiments reported in Tables 1-5 are performed on VAL.
In order to monitor the SED model convergence, we fur-ther split the DESED training set into a training set and a
cross-1https://project.inria.fr/desed/
validation set (refereed to as Training and X-valid in the tables). In the public DCASE 2020 task 4 baseline, the cross-validation set was composed of 10% on the total amount of weakly labeled soundscapes and 10% of the total amount of synthetic soundscapes generated in the training set2. The difference here is that the cross-validation synthetic soundscapes are generated using a separate set of isolated foreground events that are different from those used to generate the training set (isolated events are split into 90%/10% for the training and cross-validation, respectively).
3.2. Sound event detection baseline
The input features for the SED baseline3are mel-spectrograms with
128 mel bands. The signals are sampled at 16 kHz, the mel-spectrogram features are obtained from the short-term Fourier trans-form coefficients (STFT) computed on 2048 sample windows with 255 samples hop size.
The CNN block is composed of 7 layers with [16, 32, 64, 128, 128, 128, 128] filters per layer, respectively. We use a kernel size of 3x3 and the max-pooling is [[2, 2], [2, 2], [1, 2], [1, 2], [1, 2], [1, 2], [1, 2]] per layer, respectively. The convolution operations are followed by gated linear unit activations.
The RNN block is composed of 2 layers of 128 bidirectional gated recurrent units. The RNN block is followed by an attention pooling layer that is the multiplication between a linear layer with softmax activations and a linear layer with sigmoid activations.
The model is trained with Adam optimizer, we apply 50 % dropout. The model is trained for 200 epochs and the best model (on the cross-validation set) is kept. The post-processing is a me-dian filtering on ≈0.45 s (27 frames at 16 kHz).
3.3. Evaluation metrics
SED systems are evaluated according to an event-based F1-score with a 200 ms collar on the onsets and a collar on the offsets that is the greatest of 200 ms and 20% of the sound event’s length. The overall score is the unweighted average of the class-wise
F1-2https://zenodo.org/record/3745475
3https://github.com/turpaultn/dcase20_task4/
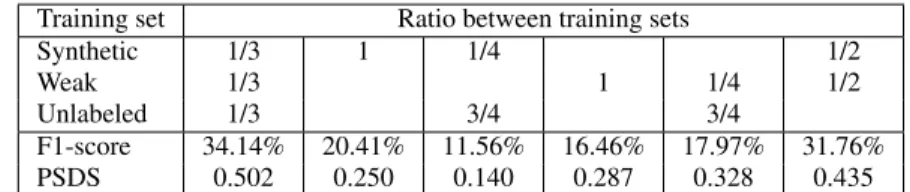
Training set Ratio between training sets Synthetic 1/3 1 1/4 1/2 Weak 1/3 1 1/4 1/2 Unlabeled 1/3 3/4 3/4 F1-score 34.14% 20.41% 11.56% 16.46% 17.97% 31.76% PSDS 0.502 0.250 0.140 0.287 0.328 0.435
Table 1: SED performance on the evaluation set depending on the kind of data used for training.
Pitch-shifting
Training X
X-valid X X
F1-score 35.15% 35.91% 34.14% PSDS 0.487 0.495 0.502
Table 2: SED performance depending on pitch shifting being ap-plied or not on isolated events during synthetic soundscapes gener-ation. Reverberation Training X X-valid X X F1-score 18.30% 35.54% 34.14% PSDS 0.435 0.508 0.502
Table 3: SED performance depending on reverberation being ap-plied or not on during synthetic soundscapes generation.
Mean-teacher SNR
0 15 30 ∞
F1-score 12.56% 26.29% 34.14% 37.80% PSDS 0.261 0.437 0.502 0.540
Table 4: SED performance depending on the SNR parameter for the noise applied to the mean-teacher input.
scores (macro-average). F1-scores are computed on a single oper-ating point (decision thresholds=0.5) using the sed eval library [23]. SED systems are also evaluated with polyphonic sound event detection scores(PSDS) [24]. As opposed to F1-score, PSDS event matching in time relies on the intersection between the predicted event and the ground truth. This can be interpreted as a compromise between event-based metrics and segment-based metrics. PSDS also handles cross-triggers as a specific case not just as a true posi-tive plus a false posiposi-tive and is independent of the operating point. In this paper PSDS are computed using 50 operating points (deci-sion thresholds linearly distributed from 0.01 to 0.99) with the fol-lowing parameters: detection tolerance parameter (ρDTC = 0.5),
ground truth intersection parameter (ρGTC = 0.5), cross-trigger
tolerance parameter (ρCTTC = 0.3), maximum false positive rate
(emax= 100). The weight on the cost trigger cost is set to αCT= 1
and the weight on the class instability cost is set to αST= 0.
4. EXPERIMENTS
The SED baseline has been built on DCASE 2019 task 4 base-line [13] and submissions [14, 15]. As a consequence, the SED baseline results from the combination of several technical solutions. The impact of each of these solution has barely been investigated
until now. In this section we propose a detailed analysis of the SED baseline system. We propose to study the following aspects:
• the type of data used for training;
• the transformations applied to the isolated sound events and to the synthetic soundscapes while generating the soundscapes; • the amount of noise added to the mean-teacher input; • the use of ramp-up to balance between the classification loss
and the consistency loss;
• the use of ramp-up on the learning rate.
In the subsequent tables, the column where the performance is 34.14% corresponds to the official SED baseline setup but trained with the new training/cross-validation split (see also Section 3.1). For simplicity sake we report here only the largest confidence in-tervals obtained during the experiments to provide insight about the significance of the performance difference. For F1-score, perfor-mance difference below 1.2% on the VAL set and below 1.3% on the EVAL set are generally not to be considered as statistically sig-nificant. For PSDS the intervals are 0.015 and 0.018 on the VAL and EVAL sets, respectively.
One of the key challenge in the task is the way the heteroge-neous training data is handled. In a first set of experiments we analyse the impact of each subset (recorded clips without labels or weakly labeled, strongly labeled synthetic soundscapes) on the SED performance (Table 1). We did not include the case when using only the unlabeled data as the SED baseline requires some supervision.
When using only weakly labeled recorded soundscapes, the per-formance degrades severely. This is due to the lack of strong labels that provide information on how to perform the sound event seg-mentation. When using only synthetic soundscapes with strong la-bels, the performance degrades also. In this case, the degradation is probably caused by the acoustic mismatch between the training data (synthetic soundscapes) and the test data (recorded soundscapes).
When combining several subsets, the ratio of soundscapes used per subset has been optimized during preliminary experiments and we present here only the performance obtained with the optimal ra-tio. When combining only two subset, the combinations including unlabeled data fail to improve the performance. The only tion of two datasets that improves the performance is the combina-tion of the weakly labeled subset and the synthetic soundscapes sub-set. This combination probably allows for overcoming the weak la-bels problem and the domain mismatch problem mentioned above. Finally, the best performance is obtained by combining all the sub-sets (as in the original SED baseline). The diversity provided by the unlabeled subset seems to be beneficial to the SED system.
The second experiment aims to investigate the impact of the transformation used while generating the synthetic soundscapes. The number of isolated sound events in DESED is limited. To overcome this problem, Scaper offers the possibility to apply pitch shifting on the isolated sound events before including them in the
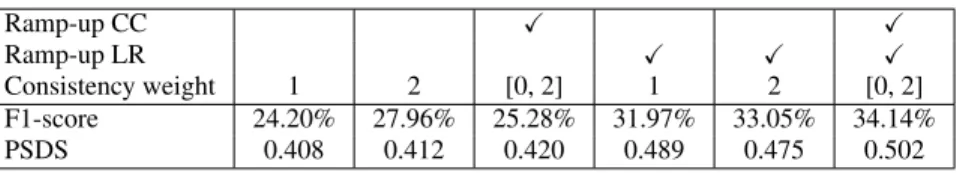
Ramp-up CC X X
Ramp-up LR X X X
Consistency weight 1 2 [0, 2] 1 2 [0, 2] F1-score 24.20% 27.96% 25.28% 31.97% 33.05% 34.14% PSDS 0.408 0.412 0.420 0.489 0.475 0.502
Table 5: Impact of the ramp-up
Reverb X X Pitch-shifting X X VAL F1-score 31.13% 36.27% 37.80% 34.46% PSDS 0.482 0.521 0.540 0.520 EVAL F1-score 33.7% 39.9% 39.0% 36.8% PSDS 0.515 0.568 0.552 0.566
Table 6: Parameter combination for the new baseline definition
soundscapes.
Table 2 presents the SED performance depending on pitch-shifting being applied on the isolated sound events before gener-ating the soundscapes or not. The best combination in terms of F1-score is not to apply pitch-shifting on the training set but to apply it on the cross-validation set. In terms of PSDS the best combina-tion is to apply pitch-shifting on both the training and the cross-validation sets (as in the original baseline). This indicates that even if the impact of the pitch shifting on the SED performance is not al-ways significant, using pitch-shifting is beneficial for the SED sys-tems as it increases the diversity of the isolated sound events.
In Scaper there is the possibility to add reverberation to the soundscapes in order to blend isolated sound events in and to avoid having just a juxtaposition of isolated sound events. By default, the reverberation is added with Sox4. In order to have a more realistic reverberation applied to the synthetic soundscapes we are replacing the Sox-based reverberation applied to the soundscapes by room impulse responses (RIR) from the FUSS dataset [25]. Each sound-scape is reverberated with a different room from the FUSS dataset (each sound event is convolved with a RIR corresponding to a dif-ferent location in the room).
Table 3 presents the SED performance depending on if rever-beration is applied on the synthetic soundscapes or not. The origi-nal baseline was not using FUSS reverberation. Applying RIR from FUSS on the validation set improves the performance, possibly be-cause the synthetic soundscapes are then more realistic. Surpris-ingly, when applying RIR from FUSS on both the training set and the validation set, the performance degrades severely. This can be due to the fact that the RIR in FUSS do not match to the acoustic condition observed in the recorded soundscapes. The fact that the PSDS performance is less affected tends to indicate that this mis-match has a severe impact on the decision thresholds.
The next set of experiments is related to the SED model. In the mean-teacher model, Gaussian white noise is added to the orig-inal soundscapes before feeding them to the mean-teacher branch. This is supposed to improve the robustness of the SED model. In the original SED baseline, the SNR between the soundscape and the Gaussian noise was 30 dB. In Table 4 we present the SED per-formance depending on this SNR. Perper-formance quickly degrades when the SNR decreases. Performing SED at 0 dB SNR is really challenging [17], this could explain why feeding 0 dB soundscapes
4http://sox.sourceforge.net/
to the mean-teacher branch is actually degrading performance. On the other hand, totally removing the noise from the teacher branch allows for improved performance. An explanation for this could be that the different dropout in the branches is already adding noise between the models.
Optimizing the mean-teacher model involves the combination of several costs (two classification costs and two consistency costs). One frequent problem when optimizing several costs at once is that of balancing between them. A solution that have proven to be ef-fective in the case of the mean-teacher is the use of the so-called ramp-up where the weight attributed to one cost is gradually in-creased across time. Delphin-Poulat et al. proposed to apply the same approach to increase gradually the learning rate (LR) [15]. This is commonly called LR warm-up [26].
Table 5 presents the SED performance depending on the weight applied on the consistency costs and depending on whether ramp-up is applied on not. Applying ramp-up on both the consistency costs and the LR (as in the baseline) allows for obtaining the best perfor-mance. Additionally, increasing the weight on the consistency cost from 1 to 2 also improves the performance.
Experiments on the SNR in the mean-teacher branch, on pitch-shifting and on reverberation showed that there is room for improve-ment compared to the original baseline. In table 6 we propose to perform a last set of experiments on pitch-shifting and reverbera-tion in the case where there is no additive noise in the mean-teacher branch. Pitch-shifting and reverberation are applied only on the cross-validation set. We also provide the performance on DESED public evaluation set (EVAL). The best performance (on the VAL set) is obtained when applying pitch-shifting but not reverberation.
5. CONCLUSIONS
In this paper we provided an detailed analysis of several technical aspects implemented in DCASE task 4 baseline since 2018 (as well as in other SED systems). Some of the default settings that are passed from one system to another without being questioned were shown to be sub-optimal for the task at hand. Through the detailed ablation study, this paper provides insights on how to configure a SED system to be trained on a heterogeneous dataset. The result-ing SED system, even-though really similar to DCASE 2020 task 4 official baseline, actually outperforms this baseline by up to 3% on both the validation and set the public evaluation set.
6. ACKNOWLEDGEMENTS
We would like to thank all the other organizers of DCASE 2020 task 45. In particular, we would like to thank Justin Salamon and Prem
Seetharaman for their help with Scaper and Hakan Erdogan, John R. Hershey and Scott Wisdom for their help with the FUSS dataset.
5
7. REFERENCES
[1] T. Virtanen, M. D. Plumbley, and D. Ellis, Computational analysis of sound scenes and events. Springer, 2018. [2] J. P. Bello, C. Silva, O. Nov, R. L. DuBois, A. Arora, J.
Sala-mon, C. Mydlarz, and H. Doraiswamy, “SONYC: A system for the monitoring, analysis and mitigation of urban noise pol-lution,” Communications of the ACM, In press, 2018. [3] R. Radhakrishnan, A. Divakaran, and A. Smaragdis,
“Au-dio analysis for surveillance applications,” in Proc. WASPAA. IEEE, 2005, pp. 158–161.
[4] R. Serizel, V. Bisot, S. Essid, and G. Richard, “Machine listening techniques as a complement to video image analysis in forensics,” in IEEE International Conference on Image Processing, Phoenix, AZ, United States, Sept. 2016, pp. 948–952. [Online]. Available: https://hal.archives-ouvertes. fr/hal-01393959
[5] Q. Jin, P. Schulam, S. Rawat, S. Burger, D. Ding, and F. Metze, “Event-based video retrieval using audio,” in Proc. Interspeech, 2012.
[6] C. Debes, A. Merentitis, S. Sukhanov, M. Niessen, N. Fran-giadakis, and A. Bauer, “Monitoring activities of daily living in smart homes: Understanding human behavior,” IEEE Sig-nal Processing Magazine, vol. 33, no. 2, pp. 81–94, 2016. [7] Y. Zigel, D. Litvak, and I. Gannot, “A method for automatic
fall detection of elderly people using floor vibrations and soundproof of concept on human mimicking doll falls,” IEEE Transactions on Biomedical Engineering, vol. 56, no. 12, pp. 2858–2867, 2009.
[8] R. Serizel, N. Turpault, H. Eghbal-Zadeh, and A. Parag Shah, “Large-Scale Weakly Labeled Semi-Supervised Sound Event Detection in Domestic Environments,” in Workshop on Detection and Classification of Acoustic Scenes and Events, Woking, United Kingdom, Nov. 2018, sub-mitted to DCASE2018 Workshop. [Online]. Available: https://hal.inria.fr/hal-01850270
[9] A. Shah, A. Kumar, A. G. Hauptmann, and B. Raj, “A closer look at weak label learning for audio events,” in arXiv:1804.09288. [Online]. Available: http://arxiv.org/abs/ 1804.09288
[10] N. Turpault, R. Serizel, and E. Vincent, “Limitations of weak labels for embedding and tagging,” in ICASSP 2020 - 45th International Conference on Acoustics, Speech, and Signal Processing, Barcelona, Spain, May 2020. [Online]. Available: https://hal.inria.fr/hal-02467401
[11] B. McFee, J. Salamon, and J. P. Bello, “Adaptive pooling op-erators for weakly labeled sound event detection,” IEEE/ACM Trans. on Audio, Speech, and Language Processing, vol. 26, no. 11, pp. 2180–2193, Nov. 2018.
[12] J. Salamon, D. MacConnell, M. Cartwright, P. Li, and J. P. Bello, “Scaper: A library for soundscape synthesis and aug-mentation,” in Proc. WASPAA, 2017, pp. 344–348.
[13] N. Turpault, R. Serizel, A. Parag Shah, and J. Salamon, “Sound event detection in domestic environments with weakly labeled data and soundscape synthesis,” in Proc. DCASE Workshop, 2019.
[14] L. JiaKai, “Mean teacher convolution system for dcase 2018 task 4,” DCASE2018 Challenge, Tech. Rep., September 2018. [15] L. Delphin-Poulat and C. Plapous, “Mean teacher with data augmentation for dcase 2019 task 4,” Orange Labs Lannion, France, Tech. Rep., 2019.
[16] A. Tarvainen and H. Valpola, “Mean teachers are better role models: Weight-averaged consistency targets improve semi-supervised deep learning results,” in Proc. NIPS, 2017, pp. 1195–1204.
[17] R. Serizel, N. Turpault, A. Shah, and J. Salamon, “Sound event detection in synthetic domestic environments,” in Proc. ICASSP, 2020.
[18] J. F. Gemmeke, D. P. W. Ellis, D. Freedman, A. Jansen, W. Lawrence, R. C. Moore, M. Plakal, and M. Ritter, “Audio set: An ontology and human-labeled dataset for audio events,” in Proc. ICASSP, 2017.
[19] F. Font, G. Roma, and X. Serra, “Freesound technical demo,” in Proc. ACM, 2013, pp. 411–412.
[20] E. Fonseca, X. Favory, J. Pons, F. Font, and X. Serra, “FSD50k: an open dataset of human-labeled sound events,” in arXiv, 2020.
[21] G. Dekkers, S. Lauwereins, B. Thoen, M. W. Adhana, H. Brouckxon, T. van Waterschoot, B. Vanrumste, M. Ver-helst, and P. Karsmakers, “The SINS database for detection of daily activities in a home environment using an acoustic sen-sor network,” in Proc. DCASE Workshop, November 2017, pp. 32–36.
[22] A. Mesaros, T. Heittola, and T. Virtanen, “TUT database for acoustic scene classification and sound event detection,” in 2016 24th European Signal Processing Conference (EUSIPCO). IEEE, pp. 1128–1132. [Online]. Available: http://ieeexplore.ieee.org/document/7760424/
[23] ——, “Metrics for polyphonic sound event detection,” Ap-plied Sciences, vol. 6, no. 6, May 2016.
[24] C. Bilen, G. Ferroni, F. Tuveri, J. Azcarreta, and S. Krstulovic, “A framework for the robust evaluation of sound event detec-tion,” in Proc. ICASSP, 2020.
[25] S. Wisdom, H. Erdogan, D. P. W. Ellis, and J. R. Her-shey, Free Universal Sound Separation (FUSS) dataset, 2020, https://github.com/google-research/sound-separation/ tree/master/datasets/fuss.
[26] P. Goyal, P. Doll´ar, R. Girshick, P. Noordhuis, L. Wesolowski, A. Kyrola, A. Tulloch, Y. Jia, and K. He, “Accurate, large minibatch sgd: Training imagenet in 1 hour,” arXiv preprint arXiv:1706.02677, 2017.