Developing, Implementing, and Evaluating Tuberculosis Laboratory
Information Systems for Resource-Poor Settings
by
Joaquin Andres Blaya
Bachelor of Science, Mechanical Engineering and Applied Physics University of Miami, 2000
Masters of Science, Mechanical Engineering Massachusetts Institute of Technology, 2003
Submitted to the Harvard-MIT Division of Health Sciences and Technology "1 v in partial fulfillment of the requirements for the degree of
MASSACHUSETTS INSTi .OF T CHNOLOGY' Doctor of Philosophy in Medical Engineering
---at the
MASSACHUSETTS INSTITUTE OF TECHNOLOGY
December 2008
LBRARIES
C 2008 Joaquin A. Blaya. All rights reserved.
The author hereby grants to MIT permission to reproduce and to distribute publicly paper and electronic copies of this thesis document in whole or in part in any
medium now 1pqvn or hereafter created.
Signature of Author.
LCeI LieU Uy...
Certified by.
Accepted by..
H rd-MIT Division of Health Sciences and Technology December 19, 2008
Hamish SF Fraser, MBChB, MSc, MRCP Assistant Professor, Brigham & Women's Hospital, Harvard Medical School Thesis Advisor
Sonya S. Shin, MD, MPH As stProssor, Brigham & Women's Hospital, Harvard Medical School Thesis Advisor
Lee Gehrke, PhD Hermann von Helmholtz Professor of Health Sciences and Technology Interim Director, Harvard-MIT Division of Health Sciences and Technology
Abf'unlr
Developing, Implementing, and Evaluating Tuberculosis Laboratory
Information Systems for Resource-Poor Settings
by
Joaquin Andres Blaya
Submitted to the Harvard-MIT Division of Health Sciences and Technology on November 1, 2008 in partial fulfillment of the requirements for the Degree of Doctor of Philosophy in Medical Engineering and Informatics
Abstract
Multi-drug resistant tuberculosis (MDR-TB) patients in resource-poor settings experience large delays in starting appropriate drug regimens and are often not monitored appropriately due to an
overburdened health care system, communication delays, and missing or error-prone data.
Medical information systems can be used to alleviate these problems by increasing the timeliness and quality of laboratory information available.
The research reported in this thesis developed, implemented, and evaluated two such systems in the urban, resource-poor setting of Lima, Peru in institutions with and without internet.
The first part addresses the electronic collection of tuberculosis (TB) laboratory information from multiple institutions without internet. A handheld computer-based system was developed and implemented. A cluster randomized controlled trial and before-and-after comparison showed that this system had a significant effect in reducing processing times from 23 to 8 days, the proportion of cultures with delays >90 days from 9.2% to 0.1%, the number of errors by 57.1%, and the work-hours necessary to process results by 60%. A cost and timeline framework was developed to allow other organizations in resource-poor settings to implement this
technology.
The second part addresses a web-based system, e-Chasqui, developed to provide electronic communication and reporting of TB laboratory information to health care personnel within institutions with internet. A cluster randomized controlled trial showed that access to e-Chasqui resulted in significantly less time to receipt of test results, a 56% reduction in tests taking over 60 days to arrive and a 98% reduction of results that never arrived, as well as a significantly faster time to culture conversion among patients in intervention versus control centers.
These two parts describe verified medical informatics tools and an implementation methodology for settings both with and without internet connectivity.
Thesis Supervisor: Hamish SF Fraser, MBChB, MSc, MRCP
Assistant Professor, Brigham & Women's Hospital, Harvard Medical School Thesis Supervisor: Sonya S. Shin, MD, MPH
Acknowledgements
Me gustaria dedicar este trabajo a todos los pacientes peruanos con TB o TB-MDR que aun no conociendolos son la razon de mis esfuerzos.
I wanted to thank my doctoral committee that has been so amazing in supporting me through this process. Hamish Fraser, my initial inspiration for this work, thank you for always encouraging me to look further and for always promoting my work. Sonya Shin, I truly believe that this work would be a shadow of what it is now if it hadn't been for your help. I have learned how to work from watching you. Lucila Ohno-Machado and Peter Szolovits, thank you for keeping this work on track and for all of the thoughtful ideas and suggestions throughout the many hours we spent together.
Le querio mandar un gran agradecimiento a todos los usuarios de los sistemas que
implementamos incluyendo el equipo de BK (Mayra Napa, Yrene Torres, Briam Chavez, y Veronica Albitres) y el personal de los centros de salud que usan e-Chasqui. Tambien a Roger Huamani, Betty Palma, Pablo Rodriguez, y Wilmer Gomez por mantener los sistemas, hablar con los usuarios, y lidiar con tantas cosas. Al equipo de Metodos Rapidos por recolectar, editar, e ingresar todos los datos que he usado aqui y por todo el apoyo que me han dado.
Mis co-investigadores que han impulsado este trabajo: Martin Yagui, Gloria Yale, Carmen Suarez, Luis Asencios, Peter Cegielski, y todo el personal de los laboratorios de Lima Ciudad y Lima Este. Finalmente, Socios En Salud por haberme dado la estructura para poder trabajar en Perti y no haberme echado por todos los dolores de cabeza que les cause.
All the folks at Partners In Health who through advice or just a smile showed me how wonderful it is to work there. The EMR team: Mike and Darius, without whom I would not have had any systems to evaluate. Claire, for all those edits (I hope this is better than chippers). Ellen for being my second mom, and the rest of the team for making it so great to work there.
My statistical and SAS gurus, Jihoon Kim and Sid Atwood, without whom all of this would just be unintellible spreadsheets.
My family and friends who saw me through this entire process. And I'm going to apologize up front and blame my bad memory if I forget something, but that's just the story of my life. Rocio y Francesca por todas las veces que me sacaron del trabajo justo cuando iba a explotar y me batieron hasta que me tuve que reir.
The Farrells for being my second family y por encarnar el estilo de vida que yo solo habia podido sofiar.
The SES volunteers for all of the great Limenian moments lived together (Melissa, Aldo, Holly, Chloe, Carlos, Brian, Kelsey, Collin, and others).
The River House crew for being my home in Boston and making it a true home.
The HST gang (Aaron, Roxanna, Jenny, Melissa, Phil, Blanca) who have seen me through all 8 years of this process.
Chris and Kathryn (and Adam) for being an amazing example of how passionate someone should be for their work, yet balance that with friends and family.
Jeannette, for showing me how to share life with someone again. Cat and Charmaine, this is definitely worth another round of sangria.
My faith group for challenging me and supporting me all at the same time over sweets and wine. Cata, por todas las uevas vividasjuntos y a muchas otras aventuras entre gringolandia y chilito. Paula, Esteban, Kenzo, Marigen, Andres, y Mariela, por ser mi comunidad chilena aca en Boston.
Mark, for all the free advice.
Eduardo, compafiero de frustraciones academicas y crisis de la vida. A pesar de nunca llamarte devuelta, tu sigues siendo mi amigo.
BB, Martin and Tomas, nunca lo he dicho, pero los quiero.
Mama y Papa, gracias por el amor nunca pronunciado pero siempre presente. Solamente ahora empiezo a reconocer mi suerte en haberlos tenidos como padres. Ustedes mas que cualquier otra cosa me han formado como soy.
Table of Contents
A bstract ... . ... 2
A cknow ledgem ents... ... 3
T ab le o f C on ten ts ... 5 L ist o f F ig ures ... ... 8 List of Tables ... 10 1 Introdu ction ... 12 1.1 Motivation... 12 1.2 Problem Identification ... ... 13 1.3 Executive Summary... 14
1.3.1 Chapter 3 - Development and implementation of PDA-based system ... 14
1.3.2 Chapter 4 - Evaluation of PDA-based system... ... 15
1.3.3 Chapter 5 -Cost analysis of PDA-based system... 15
1.3. 4 Chapter 6 - Development and implementation of e-Chasqui, laboratory information sy stem ... ... ... . ... 16
1.3.5 Chapter 7 - Evaluation of e-Chasqui in reducing delays... 16
1.3.6 Chapter 8 - Evaluation of e-Chasqui in reducing errors... 17
2 B ackgroun d ... 18
2. 1 Tuberculosis... .. ... 18
2.2 EM Rs in Developing Countries ... 19
2.3 Evaluations of EMRs, LIMS, and Data Collection Systems in Developing Countries... 22
2.3.1 M ethods ... ... ... 23
2.3.2 R esults ... ... ... ... ... ... ... ... . 25
2.3.3 D iscussion ... ... ... 30
2. 4 Evaluations of Electronic Laboratory Reporting Systems and Handheld Systems in Developed Countries ... 32
2.4.2 Electronic Laboratory Reporting Systems... ... 32
2.4.2 Handheld Systems for Data Collection... 33
2.5 The Partners In Health EMR (PIH-EMR) for sensitive & multi-drug resistant TB (MDR-TB )... ... ... ... ... ... .... .. ... .... ... 3 4 3 Development and Implementation of a PDA-based Bacteriology Collection System ... 37
3.1 Organization and Collection Workflow... 37
3.1.1 Bacteriology Collection Team at Socios En Salud... ... 37
3.2 PDA-based System Description ... 40
3.2.1 Hardware and Software Selection ... ... 41
3.2.2 PDA Forms ... ... 41
3.2.3 Decision Support System for BC Team in PIH-EMR ... 42
3.2.4 Additional Utilities... ... ... ... 46
3.3 Results... ... ... 47
3.4 Discussion ... ... 48
4 Evaluation of PDA-based System ... ... ... ... .... 49
4.1 Introduction... ... ... ... 49
4.2 M ethods ... 50
4.2.2 Processing Time ... .... ... 51
4.2.3 Collection Errors ... ... ... ... ... 51
4.2.4 Usability and Acceptability of System... 52
4.2.5 Data Abstraction... ... 52
4.2.6 Statistical Analysis... ... 53
4.3 Results... ... ... .. ... ... ... 55
4.3.1 Processing Times... 55
4.3.2 Collection Errors... ... ... 58
4.3.3 Usability and Acceptability of System... ... 59
4. 4 D iscussion ... 59
4.4.1 Limitations of study... 60
4.5 Conclusion ... ... ... ... 61
5 Cost A nalysis of PDA -based System ... ... 62
5.1 Introduction... . ... ... ... 62
5.2 M ethods... ... ... ... 62
5.2. 1 Study Design and Data Collection... 62
5.2.2 Statistical A nalysis... ... ... 64 5.2.3 Costing ... . . . 64 5.2.4 User's perception... .... ... 66 5.3 Results ... ... ... 67 5.3.1 Time-Motion Study... ... 67 5.3.2 Costs... ... 68 5.3.3 Break-even Point... ... ... 69 5.3.4 User's perception... ... ... 70 5. 4 D iscussion ... .... ... ... 70 5.5 Conclusions... ... ... 72
6 Design and Implementation of e-Chasqui, a Web-based Tuberculosis Laboratory Information System ... ... ... ... ... . 73
6.1 Background on organization ... 73
6.2 M eth ods ... ... 74
6.2. 1 Needs Assessment. ... 74
6.2.2 Integration into Laboratory Workflow ... ... 75
6.2. 3 System D esign ... ... 76 6.2.4 Implementation ... 86 6.3 R esults ... ... .... ... 88 6.3.1 System Usage ... ... 88 6.3.2 System Costs... 90 6.3.3 Additional Benefits... ... 91 6. 4 Discussion ... ... 94
6. 4.1 Challenges and Obstacles... 94
6. 4.2 Lessons learned ... ... ... 95
6.5 Conclusions... . . . 96
7 Impact of e-Chasqui on Delays... ... ... 98
7.1 In tro d u ction ... ... 9 8 7.2 M e th o ds ... ... ... ... ... 9 8 7.2.1 S tudy Setting s... ... ... ... 98
7. 2.2 Study D esign ... ... 100
7.2.3 Study Population ... 101
7.2,4 O utcom es... ... ... . . ... ... 102
7. 2.5 Intervention ... 103
7. 2.6 Sam p le Size ... ... ... ... 103
7.2. 7 Usability and Acceptability of System... 103
7.2.8 D ata A bstraction... ... ... ... 104
7.2.9 Statistical Analysis... ... ... 104
7.3 Results ... ... 105
7.3.1 Laboratory TAT ... 106
7.3.2 Laboratory TAT > 60 days ... 108
7.3.3 Treatment TAT... ... . ... ... 108
7.3.4 Culture Conversion TAT ... ... ... 109
7.3.5 Usability and Acceptability of System... 110
7.4 D iscussion ... ... ... .. ... 113
Lim itations ... .. ... ... ... ... 115
7. 5 Conclusion ... .... ... 115
8 Impact of e-Chasqui on Data Quality ... 117
8.1 M ethods ... ... ... ... ... ... ... ... 117
8. 1.1 Study Settings and Design... 117
8.1.2 Outcomes.... ... 118
8. 1.3 Sam ple Size ... ... ... ... ... . . .... 119
8.1.4 D ata A bstraction ... ... 119
8.1.5 Statistical Analysis... 119
8.2 Results ... ... ... . .... 119
8.2.1 Primary Analysis.... ... ... .... ... 120
8.2.2 Secondary Analysis... ... ... ... 121
8.2.3 Usability and Acceptability of System... 123
8.3 D iscussion ... ... ... ... ... 125
Lim itations of study ... ... ... 126
8. 4 Conclusion ... . . .... ... ... 126
9 Conclusions and Future W ork ... 127
9.1 Conclusions... ... . ... 127
9.. 1 Developing Informatics Tools and Implementation Methodologies ... 127
9.1.2 Evaluation of the Impact of the Informatics Tools... 128
9.2 Recommendations for Future Work... ... 129
R eferen ces ... . ... 13 2 Appendix A Palm Project User Survey ... 145
Appendix B e-Chasqui and Control User Survey ... 149
B. 1 e-Chasqui User Survey... ... 149
List of Figures
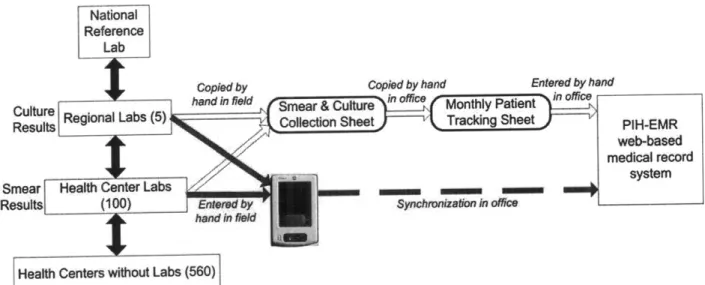
Figure 3.1 Bacteriology team's workflow with the paper and PDA-based systems ... 38
Figure 3.2 Example of a collection sheet for bacteriology team ... 39
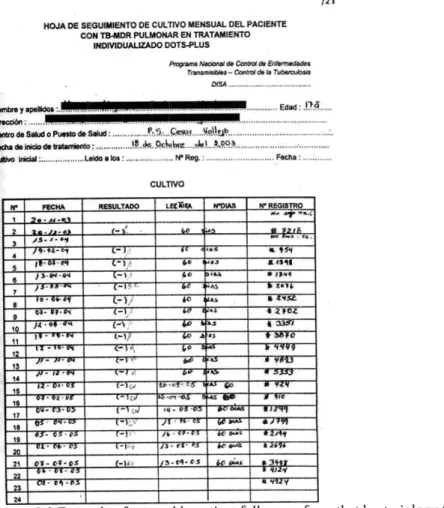
Figure 3.3 Example of a monthly patient follow-up form that bacteriology team filled out in the o ffice ... ... ... ... .. ... 3 9 Figure 3.4 Overview of PDA-based system ... ... 40
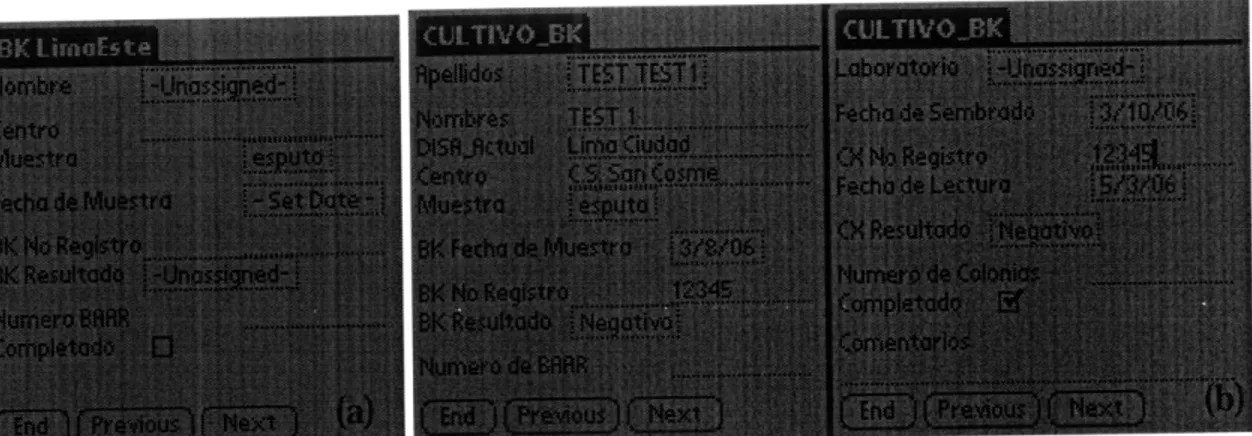
Figure 3.5 (a) Smear and (b) culture result collection forms on the PDA ... 42
Figure 3.6 Main page of bacteriology module in PIH-EMR for bacteriology team to process results before transferring them to clinical pages of the PIH-EMR... . 43
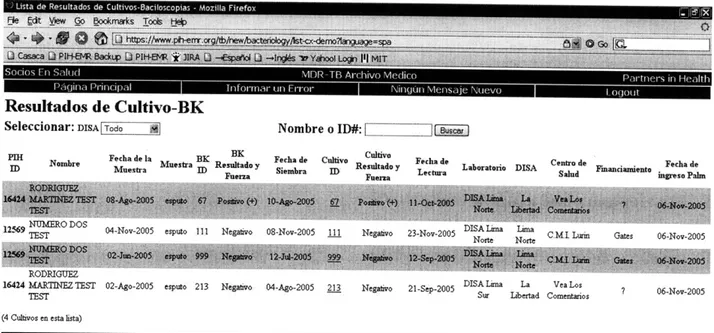
Figure 3.7 Table view of all culture and respective smears entered through the PDA-based sy stem ... ... . . ... 44
Figure 3.8 PDA-based system's decision support page in the PIH-EMR ... 45
Figure 3.9 PDA-based system's transfer page to the clinical section of the PIH-EMR ... 45
Figure 3.10 Bacteriology page of PIH-EMR showing results entered by PDA-based system marked with [palm] to the left of the sample ID (example marked with a red arrow)... 46
Figure 3.11 Page to generate a list of patients who have or don't have a result for the time period chosen by the user. The options on this page are to choose a health district (DISA) or any subdivision (Subdivision Actual), to exclude any subsection (Excluir subdivision actual), to choose the specific date range (Fecha de BK), show those patients who have left a sample (Mostrar los pacientes que han dejado una muestra?), and the type of test result either smear or culture (T ipo de Prueba) ... ... 47
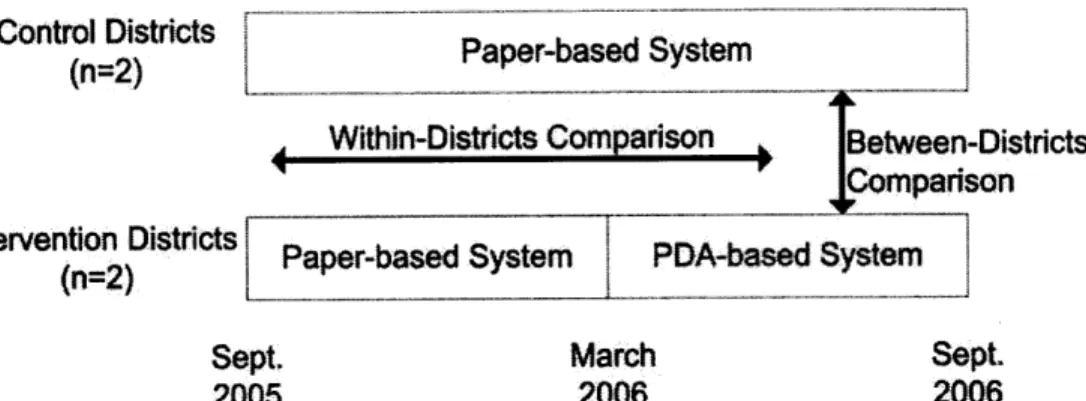
Figure 4.1 Cluster randomized controlled trial schema with within-districts (before and after) and betw een-districts com parisons ... ... 51
Figure 4.2 Definition of processing time ... ... 51
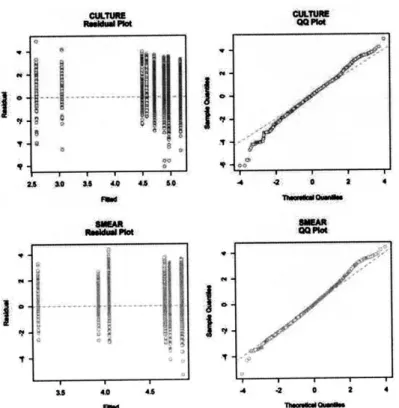
Figure 4.3 Diagnostic plots for random effects model used to compare processing times ... 53
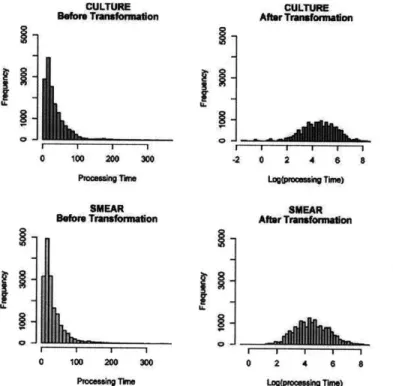
Figure 4.4 Log transformation of processing time for both culture and smear microscopies ... 54
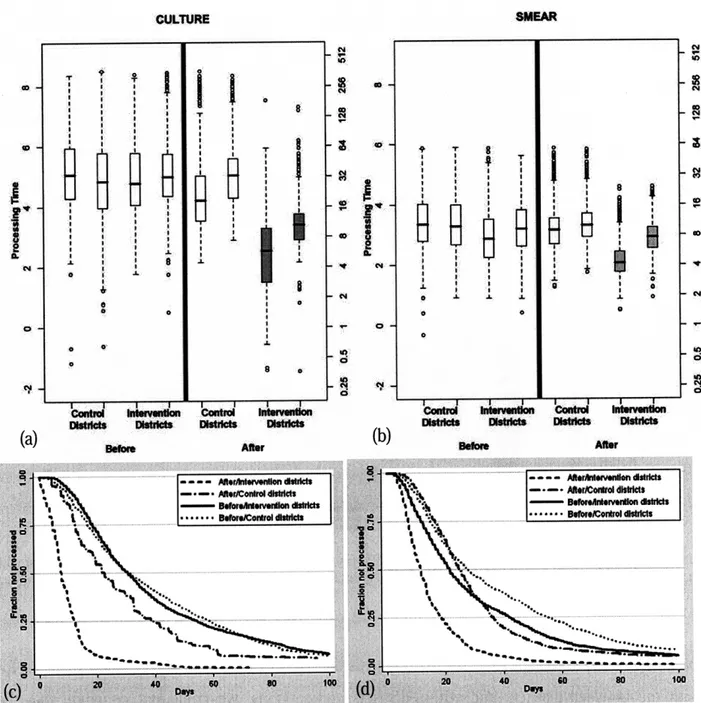
Figure 4.5 Box plot for processing time of (a) cultures and (b) smears in log scale (left y-axis) and days (right y-axis). These show that for both culture and smear results there was a statistically significant decrease (p<0.001) in the processing time with the PDA-based system (intervention districts after) compared to the same districts before the implementation (intervention districts before) and districts with the paper-based system (control districts after). The Kaplan Meier survival curves for the initial 100 days for (c) culture and (d) smear microscopy show that the PDA-based system was able to drastically decrease the number of outlying results with a processing time of over 90 days ... . 57
Figure 4.6 Proportion of total and misidentification errors comparing the intervention districts after the implementation to the historical control group (intervention districts before) and the prospective control group (control districts before) ... 58
Figure 6.1 Tuberculosis laboratory structure/workflow in Lima and locations of e-Chasqui implementation ... ... 74 Figure 6.2 Main page of e-Chasqui showing all of its functions: search for patient by name
(Buscar Paciente), search for patient by sample id (Buscar Muestra), show all results entered by lab for last 2 months (Ver todas las solicitudes), create laboratory reports
(Reportes), verification of results by laboratory director (Verificaci6n), print a batch of recently verified results (Imprimir), list of DST performed for laboratory (Consolidados de
PS), quality control page (Calidad de Datos), unverified results (Datos de Pruebas no Verificadas), export data to PHLIS (Exportar a PHLIS), recent results for health center
personnel (Resultados Recientes), and tracking samples for health center personnel (Pruebas
P en d ientes) ... 77
Figure 6.3 e-Chasqui main patient page which shows the patient's full bacteriological history on the left sidebar and with bolded sample date for the sample whose results were being displayed on the main part of the page ... 79
Figure 6.4a Search page by patient name or partial name ... ... 80
Figure 6.4b Search page by sample ID showing results ... ... 80
Figure 6.5 Multiple results view page designed at the request of the health center personnel... 81
Figure 6.6 Cultures and DSTs in Process page designed at the request of the health center personnel ... 81
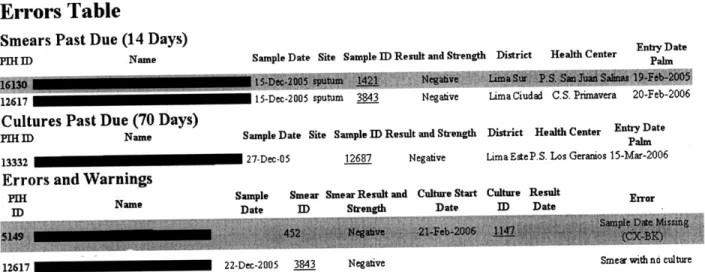
Figure 6.7 Quality control page for laboratory showing the number of DSTs without reception dates (Numero de PS sin fecha de recepcion), DSTs in process for too long (PS que han estado mucho tiempo en proceso), number of DSTs by proportions method that have not been entered (Numero de PS que faltan ingresar por numero correlativo), number of Griess DSTs that haven't been entered (Numero de PS Griess que faltan ingresar por numero correlativo), duplicate tests (Pruebas duplicadas), cultures in process over 60 days (Cultivos que pasaron 60 dias de proceso), and number of cultures that have not been entered (Numero de cultivos que faltan ingresar por numero correlative) ... 82
Figure 6.8 Verication page by laboratory personnel for cultures (Cultivos), speciation (Tipificacion), and DSTs (Pruebas de Sensibilidad del Laboratorio) ... 83
Figure 6.9 Communication times for results... 84
Figure 6.10 Reports page showing how laboratory personnel can create reports of cultures performed (Generar Reporte de Cultivos), reports of smears they have received (Generar Reporte de BKs), find negative cultures with positive smears (Cultivos Negativos con BKs Positivos), pacientes with positive cultures (Pacientes con cultivos positivos), and create reports of DSTs performed (Generar Reporte de Pruebas de Sensibilidad) ... 85
Figure 6.11 Sample of page to give users permissions to health districts (top half) and to health establishm ents (bottom half) ... 88
Figure 6.12 Average monthly number of pages viewed by health centers in each of the two health districts. Full implementation occurred in March 2006 (Lima Ciudad) and August 2006 (L im a E ste) ... ... 89
Figure 6.13 Example of online survey sent to health center personnel when a duplicate DST was entered into e-Chasqui ... 92
Figure 7.1 Flow of samples, results, and MDR treatment (Tx) requests and plans within the Peruvian National TB Program... 100
Figure 7.2 Cluster randomized controlled trial schema with before and after comparison... 101
Figure 7.3 Diagram of turn-around-time (TAT) outcomes... 103
Figure 7.4 Flow of participants (npts), cultures (nx) and DSTs (nDST) through trial... 105
Figure 7.5 Kaplan-Meier survival curve for DST laboratory TAT for RCT showing first 200 days ... ... ... ... 107
Figure 7.6 Kaplan-Meier survival curve for treatment TAT for RCT showing first 400 days... 109
Figure 7.7 Kaplan-Meier survival curve for culture conversion TAT for RCT showing first 400 days ... 110
List of Tables
Table 2.1 Number of total articles for the different eHealth categories by type of evaluation. If an article had both qualitative and quantitative studies or multiple types of systems, it was
counted in both categories. Numbers are quantity of studies (percentage of total studies).. 26
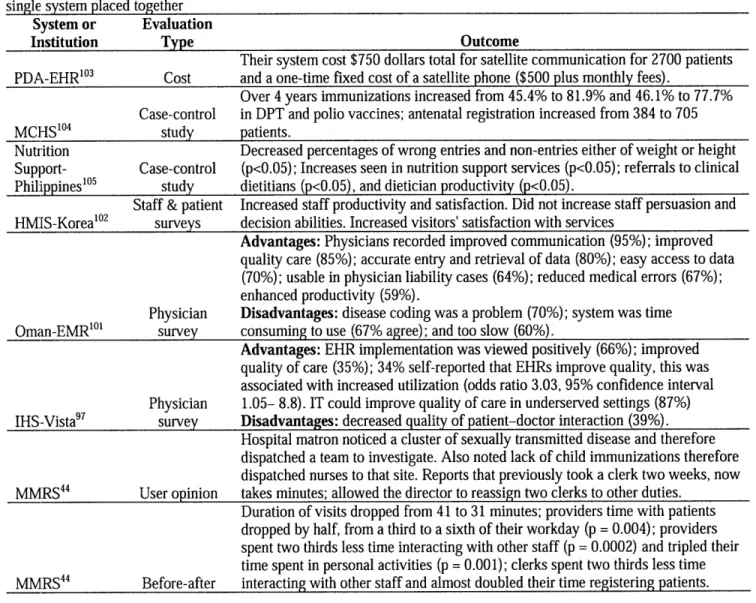
Table 2.2 Description of EMR evaluations in increasing order of evaluation strength with multiple evaluations of a single system placed together... ... 27
Table 2.3 Description of LIMS evaluations in increasing order of evaluation strength... 27
Table 4.1 Descriptive statistics of samples for study... ... 55
Table 5.1 Time-Motion study results for collection and processing tasks showing the number of samples, mean minutes per sample, the change caused by the PDA-based system, and corresponding p-value for each task. ... 64
Table 5.2 Processes and costs of developing and implementing PDA-based system, 2006 US$ 66 Table 5.3 Sample sizes for smear microscopies and cultures collected during study, number of health centers, mean monthly results, and average experience of users for control districts (current paper system) and intervention districts (PDA-based system)... 67
Table 5.4 Costs of expanding PDA-based system to 9 additional districts and implementing additional data collection form by Peruvian personnel, 2006 US$ ... 69
Table 5.5 Sensitivity analysis for break-even point of implementing and expanding PDA-based system. All costs are in 2006 US$. ... 70
Table 6.1 Needs assessment of health centers and laboratories... 75
Table 6.2 Reports generated by e-Chasqui ... ... 84
Table 6.3 Fixed and monthly costs of implementing e-Chasqui ... 90
Table 6.4 R esults of online survey... ... 93
Table 7.1. Number of tests performed annually in district laboratories using e-Chasqui ... 99
Table 7.2 Outcome definitions and sample ... 102
Table 7.3. Characteristics and outcome measures for all study health centers (HCs) and participants. Values are mean (SD) unless stated otherwise... 106
Table 7.4 Primary and secondary outcomes with stratification factors of health district and HC type. Figures are median (IQR) unless stated otherwise... 106
Table 7.5 Survey respondent characteristics... ... 110
Table 7.6 User satisfaction with paper and e-Chasqui systems and opinion on a national TB laboratory information system. Responses are mean of five-point Likert scale anchored by 1=very positive, 5=very negative or number (percentage) of option chosen ... 111
Table 8.1. Characteristics measures for all study health centers (HCs). Values are mean (SD) unless stated otherwise ... 120
Table 8.2 Number of errors by type in cluster randomized controlled trial ... 120
Table 8.3 Number of errors by type in before-and-after trial ... 121
Table 8.4 Primary and secondary analyses stratified by health district for cultures in RCT. Figures are percent of samples with at least one error unless stated otherwise ... 121
Table 8.5 Primary and secondary analysis stratified by health district for cultures in the before-and-after trial. Figures are percent of samples with at least one error unless stated otherwise. ... 1 2 2 Table 8.6 Primary and secondary analysis stratified by health district for DSTs in the RCT. Figures are percent of samples with at least one error unless stated otherwise ... 122
Table 8.7 Primary and secondary analysis stratified by health district for DSTs in the before-and-after trial. Figures are percent of samples with at least one error unless stated otherwise. 122 Table 8.8 Survey respondent characteristics with number (percentage) of users... 123 Table 8.9 User opinion of paper and e-Chasqui systems. Responses are mean of five-point Likert
scale anchored by 1=very negative, 5=very positive or number (percentage) of option chosen. Percentages are calculated from total surveys even if question was left blank.... 124
1 Introduction
1.1 Motivation
Tuberculosis (TB) is a chronic infectious disease that kills over 2 million people per year in the developing world. According to the World Health Organization (WHO), tuberculosis is second only to AIDS as the most deadly infectious disease in the world. Multidrug-resistant tuberculosis (MDR-TB) is now recognized as one of the most significant emerging infectious diseases. MDR-TB has been documented in more than 100 countries throughout the world.1
Transmission "hot spots" exist on several continents, and the problem of MDR-TB continues to grow.2 In developed countries, programs to treat MDR have demonstrated cure rates of up to
90%.3 Only recently have programs implemented in middle-income and poor countries also
shown promising results. 8
Multidrug-resistant tuberculosis in Lima, Peru
Incidence of TB in Peru is 162 per 100,000, second highest behind Bolivia.9 In the densely
populated periphery of metropolitan Lima, where half of all national cases are detected, the risk of infection with M. tuberculosis is estimated to be among the highest levels documented recently in any population.10-1 2 Tuberculosis remains the leading cause of death among individuals between 15-59 years of age.13
Rates of MDR-TB are also significant, with a national prevalence of 5.3% among patients never before treated for TB (primary MDR-TB) and 23% among previously treated patients.14 While
directly observed standardized short-course chemotherapy (DOTS) has been successfully implemented in Peru since a reform in the early 1990's, the prevalence of MDR-TB continues to rise; thus, on-going transmission of these strains makes DOTS alone an insufficient strategy to control this epidemic.
The treatment of MDR-TB requires the use of second line anti-tuberculosis drugs, which are more costly, more toxic, and less effective than first-line drugs. For these reasons, the clinical management of these patients is complex and individual. The identification of patients with risk factors for drug resistance; timely diagnosis through drug susceptibility testing; individual
regimens based on test results; and close clinical monitoring all require specialized laboratory and clinical resources that are not easily implemented in resource-poor settings.
The motivation of this thesis is to improve patient care and reduce the transmission of drug sensitive and resistant TB in resource poor settings with a high burden of disease by providing a methodology for creating and implementing laboratory information systems, and performing randomized controlled trials to measure their impact under program conditions.
1.2 Problem Identification
As TB programs continue to address the growing burden of drug-sensitive and drug-resistant TB, there is increasing need for greater laboratory capacity and better information systems to manage patient data that can be employed in resource-poor settings. Drug sensitivity tests (DST) measure the medications to which the patient's TB is resistant. This test is fundamental in determining the appropriate drug regimen to be given to the patient. Bacteriology tests, smear and culture, comprise some of the most important clinical measures of treatment response. Each MDR-TB patient on treatment should leave a monthly sputum sample at his or her local health center for smear and culture tests.
Timeliness and accuracy of this data are essential to starting a patient on an appropriate drug regimen and monitoring them throughout their 2 year treatment period. An observational study in Peru has shown that despite the large increase in treatment capacity and decentralization of laboratory capacity, patients still experience risky delays of several months in starting the correct treatment and getting monitored appropriately. 5 For example, a Peruvian high school student with MDR-TB was not appropriately treated because doctors assumed she had drug-sensitive TB, a sample sent for DST was lost, and when she was started on an appropriate treatment, drug supply issues kept her from receiving the medications. Due to this delay of over 2 years, she now has permanent bilateral lung damage.16 Our organization has seen many patients in this situation where the lack of information management has led to worse patient outcomes. Prompt treatment with individualized drug regimens based on DST improves patient outcomes'7 and reduces the risk of amplification of drug resistance and ongoing transmission'8 9
Information systems could be used to alleviate both of these major problems. Appropriately designed web-based and off-line systems could virtually eliminate the time to communicate
results between different institutions and thus eliminate a major source of treatment start delays. Further, analysis and data quality tools within the system could radically improve quality control, eliminating lost results and delays in starting treatment. Decreasing the time to treatment and ensuring an appropriate drug regimen should lead to improved patient outcomes and reduce the transmission of this deadly disease.20 As Raviglione and Smith comment in a recent editorial,
"information is essential to build a response [to drug-resistant diseases], and only computerized information systems allow sufficiently rapid exchange of information within and between
21 n
countries .'
A key area for research in medical information systems is evaluating the usability and impact of
such systems. This is particularly important in assessing the impact on quality of care and patient outcomes. This thesis proposes to perform such an evaluation of systems that have the capacity to improve the quality of care provided to patients by increasing the timeliness and quality of information available. Few studies have been able to convincingly demonstrate such benefits in the US, and virtually none in resource-poor settings.22 24
1.3 Executive Summary
This thesis describes the design, development and deployment of two systems for TB laboratories. It then reports results of a formal evaluation of their effects in the target environment of MDR-TB care in Lima, Peru. Here I summarize the findings of the research chapters of the thesis.
Part 1: Improve the method of collecting laboratory data from a distributed group of non-networked TB laboratories by the use of a PDA-based system
1.3.1 Chapter 3 - Development and implementation of PDA-based system
This chapter describes the process of development and implementation of a PDA-based electronic data system to collect TB bacteriological results for current MDR-TB patients from a group of laboratories and health centers without internet in a low resource urban setting for clinical and research purposes. This electronic system uses PDAs as the initial point of data entry at the clinical site. The PDAs interface with the existing web-based medical record system (PIH-EMR) over the internet. A new section within the PIH-EMR, created for this project, contains pages to automate the validation of the data, generate the required forms, and transfer
data into the clinical section of the medical record system. This work was published in the Proceedings of the 2006 AMIA Annual Conference.25
1.3.2 Chapter 4 - Evaluation of PDA-based system
We performed a cluster randomized controlled trial in 93 health establishments to evaluate the effectiveness of the PDA-based system and compare this new system to the previous paper-based system. The PDA- and paper-based systems were evaluated based on processing times, frequency of errors, and number of work-hours expended by data collectors. Baseline data were collected for 19 months. Districts (n=4) were then randomly assigned to intervention (PDA) or control (paper) groups, and further data were collected for 6 months. Comparisons were made between intervention and control districts and within-districts before and after the introduction of
the intervention.
The PDA-based system had a significant effect on processing times (p<0.001) and errors (p=0.005). The median processing time for cultures and smears was reduced from 23 to 8 days and 25 to 12 days, respectively, in the between-districts comparison. In that comparison, the proportion of cultures with delays >90 days was reduced from 9.2% to 0.1% and the number of errors was decreased by 57.1%. The intervention reduced the work-hours necessary to process results by 70% and was preferred by all users. This work was published in the International Journal of Infectious Diseases in 2008.26
1.3.3 Chapter 5 -Cost analysis of PDA-based system
The goal of this study was to assess the collection efficiency of each system and the resources required to develop, implement, and transfer the PDA-based system to a resource-poor setting. I performed a time-motion study of data collectors using the PDA-based or paper systems and a cost analysis of developing, implementing, and transferring the PDA-based system to a local organization and their further expansion of the system.
The study showed that work hours spent collecting and processing results decreased by 60% (p<0.001) when using the PDA-based system. Users perceived this decrease to be 70% and had no technical problems they could not fix. The total cost and time to develop and implement the intervention was US$26,092 and 22 weeks. The cost to expand to 9 other districts was $1,125
and to implement collecting patient weights was $4,107. This work was published in the International Journal of Tuberculosis and Lung Disease.27
Part 2: Improve clinical care by electronic communication and reporting of TB laboratory results in a resource-poor setting with internet
1.3.4 Chapter 6 - Development and implementation of e-Chasqui, laboratory information system
This chapter describes the web-based laboratory information system "e-Chasqui" that was designed and implemented in Peru to improve the timeliness and quality of laboratory data. It was deployed in the national TB laboratory, two regional laboratories and twelve pilot health centers. Using needs assessment and workflow analysis tools, e-Chasqui was designed to provide for improved patient care, increased quality control, and more efficient laboratory monitoring and reporting.
Since its full implementation in March 2006, 29,944 smear microscopy, 31,797 culture and 7,675 drug susceptibility test results have been entered. Over 99% of these results have been viewed online by the health centers. High user satisfaction and heavy use have led to the expansion of e-Chasqui to additional institutions. In total, e-e-Chasqui will serve a network of institutions providing medical care for over 3.1 million people. The cost to maintain this system is approximately US$0.53 per sample or 1% of the National Peruvian TB Program's 2006 budget. This chapter shows that electronic laboratory information systems have a large potential to improve patient care and public health monitoring in resource-poor settings. Some of the challenges faced in these settings, such as lack of trained personnel, limited transportation, and large coverage areas, are obstacles that a well-designed system can overcome. This work was published in BMC Medical Informatics and Decision Making.127
1.3.5 Chapter 7 - Evaluation of e-Chasqui in reducing delays
This chapter describes the cluster randomized controlled trial performed to evaluate the effectiveness of e-Chasqui compared to the current paper-based system. The e-Chasqui and paper-based systems were evaluated based on the times to communicate a result, to start or change a patient's treatment, and for that patient to culture convert. The trial was conducted in 78 health establishments in Lima, Peru. Baseline data were collected for 15 months. Health centers
were then randomly assigned to intervention (e-Chasqui) or control (paper) groups, and further data were collected for at least 2 years. Comparisons were made between intervention and control groups, as well as before and after the introduction of the intervention.
This study showed that intervention health centers took significantly less time to receive both DST and culture results. They also had a significantly lower proportion of DSTs that had taken over 60 days to arrive. The time to start or change a treatment was not significantly different between control and intervention health centers, but those patients in intervention health centers did have significantly lower time to culture conversion.
1.3.6 Chapter 8 - Evaluation of e-Chasqui in reducing errors
This chapter describes the cluster randomized controlled trial performed to evaluate the effectiveness of e-Chasqui in reducing the number of communication errors compared to the paper-based system. The trial was conducted in the same 78 health establishments in Peru. However, here baseline data were collected every four months for 12 months before the health center randomization and then for the same months the following year. Comparisons were made between intervention and control districts and within-districts before and after the introduction of the intervention.
It was found that the major sources of errors in the paper results are missing results or charts, accounting for approximately 90% of all errors. When comparing the control and intervention HCs, there was no difference in the error rate for either cultures (21.5 vs. 21.9%, p=0.07) or DSTs (18.8 vs. 15.6%, p=0.26). However, when taking into account the online viewing of results by the intervention HC personnel, there is a significant decrease in errors in both cultures (1.9 vs. 21.9%, p<0.001) and DSTs (1.4 vs. 15.6%, p<0.001). A majority of users responded that they were missing at least 10% of results in the paper system (66% for control HCs, 55% for intervention HCs) and approximately the same proportion felt that this diminished the opportunity of treatment given to a patient. This showed that e-Chasqui reduced the number of missing laboratory results at point-of-care healthcare sites via electronic viewing, while the rate of missing results or errors on paper remained unchanged.
2 Background
This chapter provides the background on tuberculosis, the infectious disease targeted by these informatics tools. It describes the electronic medical records (EMR), laboratory system, and data collection systems implemented in developing countries and the evaluations that have been performed on them. It also summarizes the major findings of evaluations of these three types of systems in developed countries. The first section describes EMR implementations in developing countries. The second section provides a systematic review of evaluations performed on EMRs, laboratory information management systems (LIMS), and research or data collection systems that have been implemented in developing countries. It shows that although there is a rising trend in the number of evaluations performed, there are still few scientifically rigorous data on the effectiveness and cost-effectiveness of these systems in developing countries. The third section describes the evaluations of those systems in developed countries. In these settings, evaluations of different methodologies have been performed and have been shown to reduce delays, decrease errors, and positively impact patient care. Finally, the last section describes the Partners In Health EMR (PIH-EMR) that has been used for treating multi-drug resistant tuberculosis (MDR-TB) patients in Peru since 2001. Both the handheld and web-based systems described in this dissertation were built on this platform.
2.1 Tuberculosis
Tuberculosis (TB) is a common infectious disease caused by mycobacteria, the most common of which is Mycobacterium tuberculosis. In approximately 80% of cases, TB affects the lungs (pulmonary TB), but it can also affect many other parts of the body (extra-pulmonary TB), such as the central nervous system, gastrointestinal system, bones, or joints. The most common symptoms of TB are a chronic cough lasting at least two weeks28 with or without blood, chest
pain, weight loss, fever, and night sweats. Extra-pulmonary TB can have a variety of other symptoms depending on the organ affected.
Tuberculosis is spread through the air, when people who have the disease cough, sneeze, or spit. It has been estimated that a person with active but untreated tuberculosis can infect 10-15 other people per year. One third of the world's current population has been infected with M.
in ten of these latent infections will eventually progress to active disease, which, if left untreated, kills more than half of its victims. In 2004, mortality and morbidity statistics included 14.6 million chronic active cases, 8.9 million new cases, and 1.6 million deaths, mostly in developing countries.29
The :most common detection method for TB is smear microscopy because it is low cost, requires little training, and the result can be read in the same day. It involves collecting a biological sample (usually sputum or some other clinical material), fixing it thinly on a glass slide and then staining it with a dye that binds specifically to mycobacteria (making them easier to identify under a microscope).29 Another type of test with higher sensitivity and specificity is a culture. There are different methods for cultures but all grow the mycobacteria in a liquid or solid medium for 20-60 days, then detect growth by evaluating the sample by visual exam or other modes of visualization to see if any mycobacteria can be detected. Both of these tests are used both to detect TB and to monitor a patient on treatment.
There are strains of TB that have become resistant to anti-tuberculous medications. Multi-drug resistant TB (MDR-TB) is TB resistant to the two most potent drugs, isoniazid and rifampicin. Extensively drug-resistant TB is resistant to isoniazid and rifampin plus resistant to any fluoroquinolone and at least one of three injectable second-line drugs (amikacin, kanamycin, or capreomycin).30 To diagnose the resistance pattern of any strain of TB, a drug susceptibility test (DST) must be performed. Again, there are different methods, but the most commonly used in developing countries grow the TB strain in a liquid or culture medium with some concentration of the drug to be tested. Visual or automated detection then confirms if the strain grew in the presence of the drug and if so the strain is considered resistant to that drug.
2.2 EMRs in Developing Countries
Developing countries provide a greater challenge in the implementation of EMR systems than developed countries due to lower levels of infrastructure, communications and education. Despite these additional challenges, EMRs in developing countries are becoming more widely used, easier to implement, and more prominent in the public domain. Studies have shown the increasing availability of internet in developing countries and its increased use by health care professionals,3 1-34 including the use of email and digital images for telemedicine.3 5-3 9 A broad
range of robust and flexible devices are becoming available.40 Governments are also becoming
more aware of the need to develop clinical and reporting information systems41 and to evaluate their use in health care.4 2
Several EMRs have been implemented and successfully used in developing countries. I conducted an exhaustive literature search in August 2006 to identify all published descriptions of EMRs, including those that were not peer-reviewed or were presented in conference proceedings. This search used a review of EMRs in developing countries43 as a start and was supplemented by search of MEDLINE and Google Scholar using combinations of the terms: "electronic medical record", "electronic health record", "electronic patient record", "developing countries", "third world", "poor settings". We retrieved potentially relevant articles and reviewed their reference lists for additional articles. Further, we consulted colleagues to identify further unpublished systems. We restricted my search to only English articles.
* In Kenya, the Mosoriot Medical Record Systems (MMRS) has been implemented in a primary care rural health center.44 6 The MMRS provides both patient registration and visit data collection functions. Data are collected on all patients seen in the medical clinic, including their laboratory test results and medications. Seven networked computers are linked to a single MS Access@ database, which maintains information on over 60,000 patients.
* The Lilongwe EMR is a patient management information system for a wide range of clinical problems in the pediatric department of a central hospital in Malawi.47 Data are collected on patient demographics, medication, laboratory tests and X-rays by using touch screens.4 8 A centralized server, located in the hospital, connects all of the touch screens. This system contains information on over 160,000 patients.
* The Brazilian public health system uses the Computerized System for the Control of Drug Logistics (Sistema de Controle Logistico de Medicamentos, SICLOM) to deliver antiretroviral (ARV) treatments to over 100,000 patients.49 50 This is by far the largest group of HIV patients whose treatment is tracked by an EMR in the developing world. Information about this system is limited; available literature indicates that the system registers the distribution of ARVs, helping both to maintain needed stocks of the drugs at the national
administrative agency and to ensure that ARVs are prescribed in accordance with national treatment and prescribing guidelines to maximize efficacy and minimize toxicity. A dial-up connection allows physicians-who each have separate data bases on their desktops-to periodically connect to the central server and update patient records. Another computer system, called System for Control of Laboratory Exams (Sistema de Controle de Exames
Laboratoriais, SISCEL), established in 1997, gathers data from the public HIV laboratories
nationwide and sends the information, online, to the central AIDS administration in Brasilia.50
* The MEDCAB system was implemented in an urban primary health care practice in Cameroon.51 Data are collected on patient demographics, medication and laboratory tests. The implementation team found that, after 14 months of usage, only 8 of the 16 users were still using the system. The main reasons for attrition included: (1) trained personnel left the practice; (2) changes in management, new leadership gave less attention to the project; (3) continual hardware breakdown; and (4) departure of most of the main investigators.
* CAREWare is an EMR developed by the US Department of Health and Human Services to support HIV treatment. It has over 350 US based sites and was deployed in Uganda in October 2003.52 The MS Access@ stand-alone database provides comprehensive tools for tracking HIV patients and their treatment, including clinical assessment, medications and billing data. Currently, the system contains information on thousands of patients in the USA and several hundred in their two sites in Uganda. An internet-accessible version has been developed and deployed.53
* FUCHIA was developed by Epicentre, the epidemiology group of Medecins Sans Frontieres (MSF), to support their HIV treatment projects.54 It supports clinical care and long-term
follow-up of patients, including scheduling of visits; it includes data on medications and investigations and generates reports. It was developed as a stand-alone system using MS Access@ and the Delphi programming language. This system is reported to be used in multiple sites where MSF provides care, although a list of sites was unavailable.
* An information system was developed to support the TB program in Botswana using Epilnfo, a free stand-alone program from the US Centers for Disease Control and Prevention (CDC)
designed for data collection and analysis in developing countries.55 56 This system was implemented in five pilot projects in Botswana and South Africa which have 8,000 and
16,000 TB cases annually, respectively. However, no further data on its use was available.
* An MS Access@ based system was also used in Botswana to support that country's first public highly active antiretroviral therapy (HAART) outpatient clinic. It used optical character recognition (OCR) technology to scan three one-page data forms into the electronic database. They used this system for seven months to manage about 3000 patients on HAART and concluded that this OCR-based system combined ease of data entry and saving of physician time while not disrupting the patient-physician encounter.57
* The Patient Record Information System (PaRIS) was built in Indonesia for primary health centers spread over the thousands of islands which comprise the country.58 Data collected include patient demographics, visit dates, medication, and disease category. The system uses a radio modem to connect 5 computers to a Postgres SQL database server on Linux machines. Each Linux machine has the database for local information as well as a copy of the entire global database. No information on the actual usage of this system was available. * A recent report40 includes other systems that have been implemented in developing countries
including Therapy Edge,59 60 Care2x,61 and World Vista, however, no other implementation information could be found aside from the list of countries where these systems have been used.
* EMR systems are also being implemented in Zambia (national EMR using smart cards),62 Tanzania (MS Access@ database for PEPFAR project), Haiti (pilot phase of data entry and reporting tool for PEPFAR and Global Fund reporting) and South Africa (use of cell phones to monitor adherence for the management of HIV/AIDS in patients on antiretroviral therapy).63 However, no further information could be found in the literature.
2.3 Evaluations of EMRs, LIMS, and Data Collection Systems in Developing Countries
Despite the increasing number of EMR implementations in developing countries, no formal evaluations have been published of their impact on patient outcomes or clinical care,22 24 64 and
only limited evaluations on their impact on improved productivity among health professionals exist.65 -6 7 These evaluations are essential in ensuring that the systems being implemented are
safe, have a significant impact, and are not a waste of already scant resources.66 68 A systematic
review performed in 2004 of the use of IT in primary health care worldwide22 found that most
articles in the realm of eHealth "lacked any evaluation of their concrete application to health care." This echoes the conclusions of a 2001 review of the impact of computers on primary care titled "A descriptive feast but an evaluative famine,2 3" as well as separate systematic reviews of telemedicine applications' effect on patient care6 9 and cost-effectiveness.07
We performed a systematic review of evaluations of EMRs, LIMS, and data collection systems in developing countries.71 The goal of the review was to survey the evaluations that have been performed on these types of systems in developing countries to find their potential impact and to guide future implementations and evaluations of these systems.
2.3.1 Methods
2.3.1.1 Studies Eligible for Review
We included any qualitative or quantitative evaluation of EMR, LIMS, or data collection system as described below in developing countries. Developing countries were defined as those in the Emerging and Developing Economies List in the International Monetary Fund's World Economic Outlook Report72. Evaluations were excluded if (1) data completeness of the system
was the only outcome, (2) the evaluation method was not described in the article, (3) the article was limited to describing the feasibility or technical evaluation of a system, (4) the evaluation was on attitudes towards or knowledge of eHealth (not an implemented system), or (5) it was only an educational tool73 74. In the cases of Uganda Health Information Network75 76 and
EHAS 77 78 where both systems were a health education and an eHealth system, we only report on the eHealth system.
2.3.1.2 Finding Relevant Studies
We conducted a worldwide review of the literature and requested submissions from researchers and implementers of eHealth systems in developing countries. Literature searches were completed through May 2008 without language restrictions through MEDLINE, EMBASE, Science Citation Index (Web of Science), Social Sciences Citation Index, The Cochrane Library,
and the Latin American and Caribbean Health Science Literature Database (LILACS). To find reports not in scientific journals or conferences, we also used Google Scholar. All citations were downloaded into EndNote X (Thomson ISI Research-Soft, Philadelphia, PA). For MEDLINE and EMBASE, terms were derived from the MeSH database and EMTREE tool, respectively. Among the terms used in the final strategies were medical informatics applications, management
information systems, telemedicine, telehealth, reminder system, geographic information system, hospital information systems, outcome and process assessment (Health Care), program evaluation, evaluation studies, attitude, costs and cost analysis, developing countries, poverty, Africa, Latin America, eastern Europe, central or southeastern Asia (complete strategies
available from the authors). An initial reviewer evaluated the eligibility of all studies identified in our search. A second reviewer confirmed all relevant articles and retrieved the full text of each article. Supplementary methods of finding evaluations included a review of article reference lists, informatics conference proceedings, information provided by primary study authors, requesting submissions from other researchers and implementers and searching the RHINO Literature Database79 and other recent reviews.22 43 80 81
2.3.1.3 Data Abstraction and Synthesis
We extracted data according to recurring themes. We summarized these findings using tabular techniques and descriptive statistics. Reported analyses were too disparate to be pooled in a meta-analysis.
The systems described in the articles were placed into one of three categories:
1. Electronic Medical Record (EMR): an electronic record of health-related information on an individual that can be created, managed, or consulted by clinicians or staff. We have found that in the literature the term electronic health record (EHR) is used interchangeably and therefore will be used as a synonym for the purposes of this paper.
2. Laboratory Information Management System (LIMS): a system for laboratory specific activities or for reporting results to administrators and health care personnel.
3. Research or Data Collection System: any electronic system used for collecting data from different locations or for storing, managing, or reporting on data used for research purposes.
Evaluations were classified into two major categories: qualitative and quantitative. In this review, qualitative evaluations were those where users, patients, or staff gave their opinion regarding a system. These could take the form of questionnaires, focus groups, or interviews. This definition is different from the one proposed by Strauss and Corbin of "any type of research that produces findings not arrived at by statistical procedures or other means of quantification."82 Quantitative evaluations were those whose outcomes were data quality, administrative changes, patient care, or economic assessment. The evaluation designs were grouped according to the definition by Friedman and Wyatt:83 (1) descriptive (uncontrolled) study; (2) historically controlled (before-after) study; (3) case-control (retrospective) study; (4) prospective self-controls (subjects performing same action in both systems);' (5) simultaneous nonrandomized controls; (6) simultaneous randomized controls; and (7) externally and internally controlled before-after study. Two cost studies84 85 and two studies that modeled future medication
requirements86 87 were categorized as self-controls, since the authors compared the impact of the system against the same situation without the system. Due to the inherent limitation of performing a case-control, descriptive, or qualitative study without statistics, we will not comment on the limitations of these studies in the results sections.
2.3.2 Results
Searches retrieved 1947 citations. Five of these articles were excluded because they did not have abstracts and full text versions were not available.88-92 After the initial screening of article titles
and abstracts, we found 154 articles that appeared relevant. An additional five articles were identified by hand searching bibliographies of eligible articles and prior reviews. Of these, 22 were deemed to fulfill the inclusion criteria of the review after full review of their abstracts, and are listed by type of system and evaluation in Table 2.1. For three of these articles, we were only able to retrieve the abstract, but still included them in the analysis.93 -96 Brief descriptions of outcomes and limitations are described under each category of system type in Tables 2.2-2.4. Though it is not in a developing country, we included an evaluation from the Indian Health Services in the U.S. since conditions were similar to those in developing countries.97 If a system had multiple evaluations, only those with different outcomes are listed. If they had the same outcome, we took the one with the largest sample size. There were two articles reporting that an
evaluation did not occur because of a failed system implementation.24 98 These are not part of the
results, but we considered it relevant to list them since articles on unsuccessful systems are not commonly published.
Eight articles performed qualitative evaluations and 18 performed quantitative evaluations. If an evaluation performed both types it was counted in both categories. Two qualitative and six quantitative evaluations performed some sort of statistical analysis on the results. Of all these evaluations, two of the qualitative and two of the quantitative were performed by an outside evaluator that was not the system developer. The number of evaluations has increased in the last few years.
Table 2.1 Number of total articles for the different eHealth categories by type of evaluation. If an article had both qualitative and quantitative studies or multiple types of systems, it was counted in both categories. Numbers are quantity of studies (percentage of total studies)
eHealth Category Qualitative Quantitative
Descriptive Controlled
Studies Studies
Electronic Medical Record (EMR) 4 (14) 1 (3) 4 (14)
Laboratory Information Management Systems (LIMS) 0 1 (3) 3 (10)
Research or Data Collection Systems 4 (14) 1 (3) 11 (38)
TOTAL 8 (28) 3 (10) 18 (62)
2.3.2.1 Electronic Medical Record (EMR)
EMRs are the core application on which other clinical systems such as computerized clinical decision support (CDSS), computerized order entry (COE), and sometimes telemedicine systems can be implemented and sustained. Because of this they usually need to encompass a variety of different functionality, making their implementations complex"99 and often prone to failure.100
This complexity provides an additional challenge in evaluating these systems. In our search we were only able to find one evaluation that had a control group (Table 2.2); four were qualitative, with only one of them using statistics; two were case-control studies that could provide an insight into possible impacts, but had limited scientific rigor.83
The Vista system used by the Indian Health Services (IHS) was the most complete system, as it includes services for clinical reminders, radiology order entry, medication order entry, and lab
order entry. Several of the other EMRs also incorporated multiple services,44 101 102 however all
of them will only be reported in the EMR sections because none performed evaluations on the separate parts of the system.
The MMRS evaluation provided data on the impact that an EMR could have on improving staff productivity and reducing patient wait times. The other evaluations gave insights into the ability of EMRs to improve staff satisfaction, providing higher quality data to relevant personnel, and ultimately improving the care provided to patients.
Table 2.2 Description of EMR evaluations in increasing order of evaluation strength with multiple evaluations of a single system placed together
System or Evaluation
Institution Type Outcome
Their system cost $750 dollars total for satellite communication for 2700 patients PDA-EHR0 3 Cost and a one-time fixed cost of a satellite phone ($500 plus monthly fees).
Over 4 years immunizations increased from 45.4% to 81.9% and 46.1% to 77.7% Case-control in DPT and polio vaccines; antenatal registration increased from 384 to 705
MCHS0 4 study patients.
Nutrition Decreased percentages of wrong entries and non-entries either of weight or height
Support- Case-control (p<0.05); Increases seen in nutrition support services (p<0.05); referrals to clinical Philippines'" study dietitians (p<0.05), and dietician productivity (p<0.05).
Staff & patient Increased staff productivity and satisfaction. Did not increase staff persuasion and HMIS-Korea'0 2 surveys decision abilities. Increased visitors' satisfaction with services
Advantages: Physicians recorded improved communication (95%); improved
quality care (85%); accurate entry and retrieval of data (80%); easy access to data (70%); usable in physician liability cases (64%); reduced medical errors (67%); enhanced productivity (59%).
Physician Disadvantages: disease coding was a problem (70%); system was time
Oman-EMR0 survey consuming to use (67% agree); and too slow (60%).
Advantages: EHR implementation was viewed positively (66%); improved
quality of care (35%); 34% self-reported that EHRs improve quality, this was associated with increased utilization (odds ratio 3.03, 95% confidence interval Physician 1.05- 8.8). IT could improve quality of care in underserved settings (87%) IHS-Vista97 survey Disadvantages: decreased quality of patient-doctor interaction (39%).
Hospital matron noticed a cluster of sexually transmitted disease and therefore dispatched a team to investigate. Also noted lack of child immunizations therefore dispatched nurses to that site. Reports that previously took a clerk two weeks, now MMRS44 User opinion takes minutes; allowed the director to reassign two clerks to other duties.
Duration of visits dropped from 41 to 31 minutes; providers time with patients dropped by half, from a third to a sixth of their workday (p = 0.004); providers spent two thirds less time interacting with other staff (p = 0.0002) and tripled their time spent in personal activities (p = 0.001); clerks spent two thirds less time MMRS44 Before-after interacting with other staff and almost doubled their time registering patients. 2.3.2.2 Laboratory Information Management Systems (LIMS)
There were only three evaluations of LIMS, of which only one had a control group. However they suggest two major benefits that a LIMS system can provide: (1) decreasing turn around times in the communication of results and (2) improving productivity of the laboratory. An
additional impact, reduction in errors, has not yet been studied.