HAL Id: cea-02509183
https://hal-cea.archives-ouvertes.fr/cea-02509183
Submitted on 16 Mar 2020HAL is a multi-disciplinary open access archive for the deposit and dissemination of sci-entific research documents, whether they are pub-lished or not. The documents may come from teaching and research institutions in France or abroad, or from public or private research centers.
L’archive ouverte pluridisciplinaire HAL, est destinée au dépôt et à la diffusion de documents scientifiques de niveau recherche, publiés ou non, émanant des établissements d’enseignement et de recherche français ou étrangers, des laboratoires publics ou privés.
CFD analysis of non-axial flow in fuel assemblies
U. Bieder
To cite this version:
U. Bieder. CFD analysis of non-axial flow in fuel assemblies. NURETH 16 - 16th International Topical Meeting on Nuclear Reactor Thermalhydraulics, Aug 2015, Chicago, United States. �cea-02509183�
CFD ANALYSIS OF NON-AXIAL FLOW IN FUEL ASSEMBLIES
U. Bieder
Commissariat à l’énergie atomique et aux énergies alternatives
CEA DEN/DANS/DM2S/STMF/LMSF
F-91191 GIF-sur-Yvette
[email protected]
ABSTRACT
CFD studies with the Trio_U code were performed to evaluate the flow field and pressure drop in rod bundles with a slope angle of 22° between main flow and the axis of the rods. Comparison to the CEA experimental program EOLE is discussed which was performed with inclined rod bundles in in a square channel. Finally, the inter-assembly flow in two adjusted parts of fuel assemblies, separated by the assembly bypass flow, is analyzed. The large eddy simulation (LES) method is used to account for non-isotropic turbulence. A mesh of 1.1 billion control volumes was used for this analysis. The simulation has been performed on 10,000 processor cores of the HPC computer CURIE of the TGCC. The correlation of the EOLE program under estimates the pressure drop of the assembly calculation by a factor of about six. In contrary to the flow in the open, unbounded core region modeled by the assembly calculation, the EOLE experiments have been performed in a square channel. Thus, questions rise concerning the applicability of correlations derived from a channel configuration to the unbounded core region. Simulating the flow in the inclined rod bundle of the EOLE experiment by using the open boundary conditions of the assembly calculation confirms the under prediction of the correlation.
KEYWORDS: Fuel assembly, CFD, LES, cross flow, pressure drop
1. INTRODUCTION
Heterogeneities in the coolant flow map in PWR cores are one of the mechanisms involved in fuel assembly deformation which has sometimes been detected after core unloading /1/. The cross flow within and between fuel assemblies, which are strongly influenced by the core inflow and outflow conditions, generate lateral hydraulic forces. Pressure forces acting on the rods are assumed to be the dominant hydro-mechanical forces under high mass flow conditions. Temperature and flux distribution does not show a strong correlation to the assembly deformation /2/.
The pressure drop coefficient depends on the mass flow rate and on the slope angle between the flow and the fuel bundle axis. Usually, empirical correlations were used to estimate the pressure drop in rod bundles /3/. These correlations have been established from rather old experimental tests, which have not all been validated on geometries similar to those of PWR fuel assemblies. Thus nuclear reactor specific experimental programs have been performed by Peybernes /4/ and Barcellos et al /5/ to evaluate the pressure forces acting on tube bundle under non-axial flow conditions.
To our knowledge, CFD studies to evaluate the pressure drop of rod bundles with slope angles between main flow direction and bundle axis have not been published to date. Thus comparisons of CFD calculations with the Trio_U code to an experimental program of CEA with inclined rod bundles in a channel are discussed. Then the inter assembly flow in two adjusted parts of inclined fuel assemblies,
separated by the assembly bypass flow is analyzed. After describing the main features of the Trio_U code /6/ for the application of Large Eddy Simulations (LES) (chapter 2), the measurements of Peybernes /4/ were used to validate this code for flow in rod bundles with a slope angle of 22° between main flow and rods (chapter 3). The validated code is then applied to quantify the flow fields and pressure forces in adjunct sections of two adjunct fuel assemblies in cross flow (chapter4). In this context, the influence of the inter-assembly gap on the flow field is discussed. Finally, the limitation of existing pressure drop correlations for the application in the reactor core is stressed out (chapter 5).
2. THE TRIO_U CODE
Trio_U is a CFD code dedicated to unsteady, low Mach number, turbulent flows /6/. The code is especially designed for industrial CFD calculations on structured (parallelepipeds) and non-structured (tetrahedrons) grids of several hundreds of millions of meshes. The platform independent code, developed at CEA, is based on an object oriented, intrinsically parallel approach and is coded in C++ /7/. The flexible code structure allows the user to choose a suitable discretization method and to combine various appropriate physical models, including different treatments of turbulence. Several convection and time marching schemes as well as a wide range of boundary conditions are available. For all that flexibility in the field of application, the code has been run successfully on massively parallel computers with up to 10000 processor cores without a significant reduction of the overall performance /8/.
A hybrid Finite Volume Element discretization method (FVE) is implemented for tetrahedral grids. This method approximates a continuous problem by a discrete solution in the space of the finite elements by maintaining the balance notation of finite volumes. In Trio_U, the main unknowns as velocity and scalars (e.g. temperature) are located in the center of the faces of the tetrahedral element leading to a P1 non-conforming discretization (P1NC). Thus, the number of control volumes for the momentum and scalar conservation is approximately two times the number of tetrahedral elements. The pressure is discretized in both the center (P0) and the vertices (P1) of an element. The resulting staggered mesh arrangement improves the velocity/pressure coupling, increases the divergence free basis and shows a hyper convergence behavior on mesh refinement. The SOLA velocity projection method of Hirt /9/ is used to assure the mass conservation.
In the presented analysis, only Large Eddy Simulations (LES) are used to treat turbulence effects. An explicit 2nd order Adams-Bashforth time marching scheme was used to temporally integrate the momentum equations. The linear system of the pressure projection method is solved once per time step by means of a conjugate gradient method (CGP) with SSOR preconditioning. The numerical scheme for LES calculations recommended with Trio_U is summarized in Tab. 1. More detailed information on the numerical scheme and the solution method has been discussed by Ducros /10/.
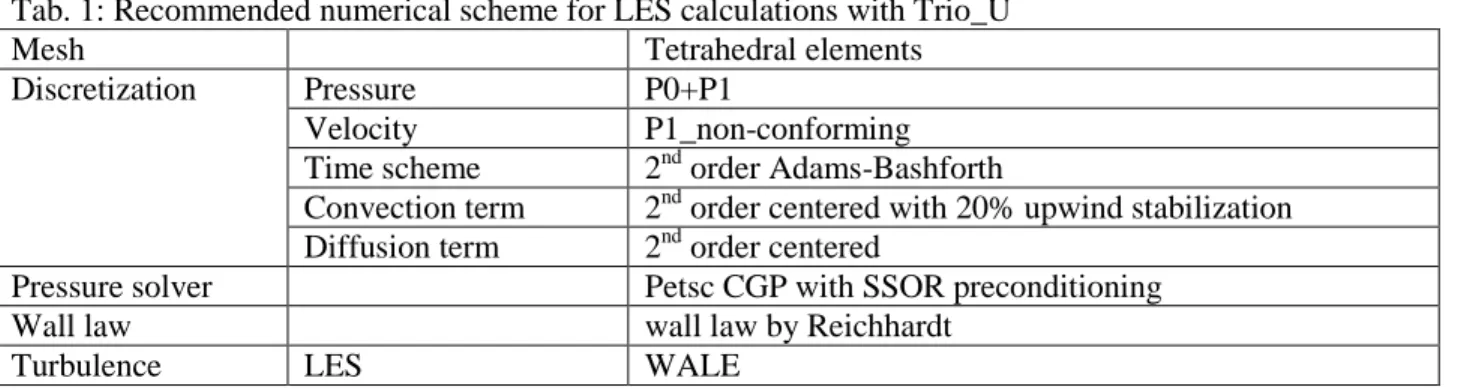
Tab. 1: Recommended numerical scheme for LES calculations with Trio_U
Mesh Tetrahedral elements
Discretization Pressure P0+P1
Velocity P1_non-conforming
Time scheme 2nd order Adams-Bashforth
Convection term 2nd order centered with 20% upwind stabilization Diffusion term 2nd order centered
Pressure solver Petsc CGP with SSOR preconditioning
Wall law wall law by Reichhardt
3. THE EOLE EXPERIMENTS Experimental Setup
3.1
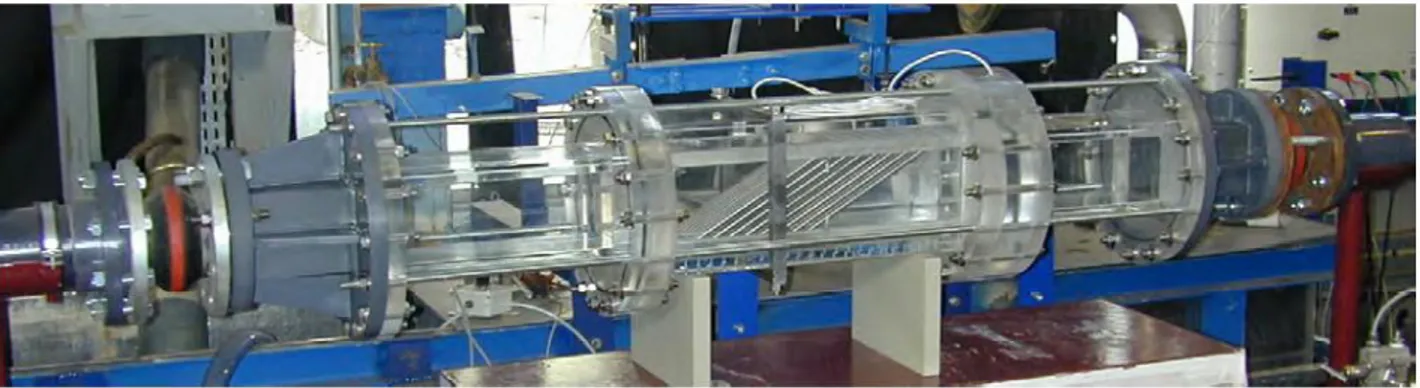
An experimental device called EOLE has been designed and built to characterize the cross flow through a rod bundle at different slope angles /4/. The test section in Plexiglas allows an optical access to flow by Laser Doppler Anemometer measurements (LDA) through the rod bundle. The horizontal channel of square section (106.7x106.7mm²) can contain a rod bundle of maximum 8x8 rods at an angle with the horizontal channel of 90°, 67.5°, 45° and 30°. 1 to 8 rows of rods can be mounted in the test section. The assembly mock-up is similar to the PWR fuel assembly geometry with stainless steel rods of 9.5mm diameter, arranged in a square array with a pitch of 12.6 mm. Two pressure taps are set upstream and downstream from the assembly mock-up in a steady state flow area, enabling measurement of the pressure drop due to the rod bundle in the channel for different inlet flow rates. Fig. 1 shows the EOLE test section with assembly mock-up at an inclination of 30°.
Fig. 1: EOLE test section with a tube bundle inclined at 30°.
The pressure drop measurements presented here were performed with 8 and 4 rows in stream wise direction, each with 8 rods in span wise direction. The pressure drop of a pure 4-row rod bundle corrected for the influence of the hydraulic discontinuities at the inlet and outlet of the bundle can easily be determined by subtracting the 4-row pressure drop from the 8-row pressure drop.
Main Experimental Results 3.2
Peybernes /4/ has shown that the pressure drop of the rod bundle is a function of the mean velocity between the rods v0-gap, calculated for the same rod bundle and the same flow conditions at pure cross flow
of 90° inclination angle. To better define this velocity in the rod gaps, a typical stream line going through the gap between two rods located side by side is given in red in Fig.2. In this context the velocity is decomposed in its components vx and vz, is the inclination angle of the flow with respect to the bundle
axe and is the angle of the flow in the gap. An inclination angle of 0° represents pure axial flow; an inclination angle of 90° represents a pure cross flow.
Fig.2: Schematic stream line between two adjunct fuel rods
Peybernes /4/ has calculated the pressure drop Pc of nrow rows from the correlation:
∆𝑃𝑐 = 𝑛𝑟𝑜𝑤∙ 𝐾𝑐(𝜓) ∙12𝜌𝑣0−𝑔𝑎𝑝2 (1)
The pressure drop coefficient Kc() is a function of the inclination angle .
𝐾𝑐(𝜓) = 𝐾𝑐∙ 𝜉(𝜓) (2)
This function has been detected experimentally in the EOLE experiments /4/:
𝜉(𝜓) = ( sin(𝜓)
cos(90−𝜓2 ))
1.7
(3)
Two correlations for the pressure drop coefficient Kc have been tested:
The coefficient of EOLE /4/: 𝐾𝐸𝑂𝐿𝐸 = 5.64 ∙ 𝑅𝑒0−0.3 (Indice EOLE) (4a)
The coefficient of Idel’cik /3/: 𝐾𝐼𝑑𝑒𝑙′𝑐𝑖𝑘 = 2.66 ∙ 𝑅𝑒0−0.2 (Indice Idel’cik) (4b)
The Reynolds number is calculated from v0-gap, the cinematic viscosity of the fluid and the hydraulic
diameter which is in this case the tube diameter: 𝑅𝑒0=𝐷ℎ∙𝑣0−𝑔𝑎𝑝
𝜈 (5)
Two EOLE experiments were analyzed numerically; one with an inclination angle of 90° and one with an inclination angle of 22°. The flow conditions of these two experiments are given in Tab.2.
Tab.2: Flow conditions of the analyzed EOLE experiments
[°] vx [m/s] v0-gap [m/s] Dh [m] [m2/s] Re0
90° 1.6 2.37 0,0095 6.58.10-7 3.42.104
22° 1.6 2.37 0,0095 6.58.10-7 3.42.104
The pressure drop per row of rods are given in Tab 3, calculated with the pressure drop coefficients of EOLE (eq.(4a)) and Idel’cik (eq.(4b)). The pressure drop of the correlation of Idel’cik is about 30% higher than that calculated with the correlation of EOLE, most probably because in EOLE the effect of the
Vz Vx V V0-gap
bundle inflow and outflow rows on the pressure drop have been eliminated by the already described experimental procedure /4/.
Tab 3: Pressure drop of the two analyzed EOLE experiments KEOLE KIdel’cik Inclination
angle PIdel’cik [Pa/row] PEOLE [Pa/row] 0.2461 0.3296 90° 1.0 917 685 0.2460 0.3296 22° 0.2558 235 175
Numerical Analysis of the EOLE Experiments 3.3
In this preliminary study the flow in both inclined (22°) and not inclined (90°) tube bundles is simulated with Trio_U and LES turbulence modelling approach (numerical scheme see chapter 2). The square channel upwind and downwind of the bundle is not modelled in this analysis to simplify the calculation. In fact, only a bundle of 5x5 rods in stream and span wise direction is placed into a channel of 53.35mm height. The CAD model of this geometrically simplified EOLE tube bundle with an inclination angle of 22° is given in Fig.3.
Fig.3: CAD model for the simplified EOLE geometry
The use of periodic boundary conditions in direction of the main flow allows directly comparing the numerically calculated pressure drop to the corrected pressure drop of the experiment. Five tube rows where taken into account in the model in main flow direction to assure the de-correlation of the turbulent fluctuations at the periodic faces. Periodicity is also used in span wise direction by imposing additionally a globally zero flowrate trough these lateral periodic faces. Fixed walls with standard wall functions are used for the rods and the channel walls which vertically bound the calculation domain. The schematic presentation of the boundary conditions is shown in Fig.4.
Fig.4: Boundary conditions for the simulation of the EOLE facility. Wall
Wall
vx vx
Periodic
Source terms in form of constant pressure gradients are used in both periodic directions to impose a constant mass flow rate in main flow direction and a zero mass flow in span wise direction.
A typical flow field in the inclined tube bundle of the geometrically simplified EOLE experiment is shown in Fig.6. Stream lines based on the mean velocity are shown. Directly downwind of the rods, streamlines raise parallel to the inclined rods. In the space between the rods, the streamlines descent in wave form. The reason for this behavior can be seen in the mean vertical velocity (vz) distribution, visualized in the
horizontal cut plane at z =0.025m. Leeward of the rods (in x direction), vz is positive, span wise between
the rods (in y-direction vz) is negative and in the sub channels between four rods vz is about zero. This
distribution of the vertical velocity leads to the flow field presented by the two vector plots. Two vertical cup planes are shown at y=0.027m (between the rods) and at y=0.032m (through the center of the rods). Lines representing these cut planes are added to the horizontal cut plane.
Stream lines based in the mean velocity Vectors of the mean velocity at y=0.027m
Mean vertical velocity at z =0.025m Vectors of the mean velocity at y=0.032m
Fig.5: Flow field of the simplified calculation of the EOLE experiment
The pressure drop per row is given in Tab 4 calculated with pressure drop coefficients of EOLE and Idel’cik as well as with LES. The LES underestimates the pressure drop of the correlations for the non-inclined bundle and slightly overestimates the pressure drop for the non-inclined bundle.
Tab.4: Comparison of the pressure drop per row; correlations and LES Inclination angle PIdel’cik [Pa/row] PEOLE [Pa/row] PLES [Pa/row] 90° 917 685 591 22° 235 175 250
Nevertheless, experiments and LES give a pressure drop per row which is sufficiently close to confirming the validity of the simulation calculation by the experiment.
4. TRANSVERSE FLOW IN FUEL ASSEMBLIES
The objective of this enlarged numerical analysis with LES turbulence modelling is to predict the pressure forces acting on fuel assemblies by a strong transversal flow. The simulation also expects to show the influence of the inter-assembly bypass flow on the global flow behavior in the vicinity of the mixing grid.
The calculation simulates the flow in a nuclear reactor core close to nominal conditions (water at 300°C and 160 bar) without representing a particular location in the core. However, the flow condition approaches those of assemblies close to the core inlet, radially at the periphery of the core where the radial velocity gradients are the most important. A typical fuel assembly and the CAD model around the two adjunct mixing grids are given in Fig.6. The CAD model has been created with SALOME /11/.
Fig.6: typical fuel assembly and CAD model of the mixing grid with fuel and control rods
The Reynolds number of the bare rod bundle calculated with the axial velocity is about 745000 and the inclination angle of the flow with respect to the axis of the rods is about 23°. The flow conditions are summarized in Tab.5.
Tab.5: Flow conditions of the assembly calculation
[°] vx [m/s] vy [m/s] vz [m/s] v0-gap [m/s] Dh [m] [m2/s] Re0
23 -1.6 0.0 4.0 6.2 0.0095 1.21.10-7 4.89.105
The used boundary conditions are: imposed velocity at the bundle inlet, pressure boundary at the bundle outlet, periodicity in transversal and span wise direction. A periodic box is connected to the inlet face of the assemblies. The flow in the periodic box mimics the flow in an infinitively long tube bundle. A preparatory transient is calculated for this periodic box until a fully developed turbulent flow is established with converged statistics (mean values and RMS). Momentum sources assure constant mean velocity in axial (4.0m/s), transversal (-1.6m/s) and span wise (0.0m/s) direction. After stabilization of the flow and convergence of the statistics, the periodic box is connected to the inlet face of the assemblies. As described in more detail in /12/, instantaneous velocities are imposed in this way at each time step at the inlet of the calculation domain.
The meshing has been created with CENTAUR /13/; 2 layers of prisms have been introduced close to walls. These prisms have been cut into tetrahedrons to create a pure tetra meshing. The surface meshing of
x y
the mixing grid is given in Fig.7. The inter-assembly gap with the positioning devices, the mixing vanes and dimples are good visible.
Fig.7: Surface meshing of the mixing grids
700 million tetrahedrons discretize the assemblies and the periodic box what led to 1.1 billion velocity control volumes for the Trio_U calculation due to the used face centered discretization. The simulation to reach convergence of the mean velocity in the whole domain has been performed in 22 CPU days on 10000 processor cores of CURIE of the TGCC /14/. The RMS of the velocity did not converge totally close to the outlet of the domain.
Streamlines as well as velocity vectors and the reduced pressure (P/-source term) for two cut planes are shown in Fig.8. Two types of streamlines can be observed; those aligned to the transvers flow and those aligned to the rods. This separation in two main flow directions has already been observed in the EOLE calculations but is much more accentuated here.
Only a much reduced transvers flow is present directly downstream of the grid; this can be seen from the streamlines and the velocity distribution at z=0.01m. Close to the grid, the flow is mostly influenced by the mixing and guiding vanes which initiate a strongly swirling flow. The inter-assembly bypass flow accelerates between the assemblies and is canalized between the two mixing grids. This leads to the formation of a kind of swirling plane jet downstream of the gap as can be seen from the stream lines directly downstream of the mixing grids.
Streamlines in the calculation domain Pressure and velocity vectors at z=0.01m
Pressure and velocity vectors at z=0.10m
Fig.8: Streamlines as well as reduced pressure and velocity vectors in horizontal cut planes
The transvers velocity dominates the flow further downstream of the grid as can be seen from the cut plane at z=0.1m, although some rather strong swirls are still present (downstream of the guiding vanes and right in the middle between two guide tubes).
The pressure forces on the rods can easily be calculated from the pressure drop per row of rods and the rods surface. This pressure drop per row, calculated with the correlation of EOLE (eq.(4a)), and Idel’cik (eq.(4b)) is compared in Tab.6 to the pressure drop calculated with the LES for the periodic box. In accordance to the EOLE experiments, the flow in the periodic box is also not perturbed by the mixing grid. The simulation overestimates the pressure drop of the correlation of Idel’cik by a factor 3.96 and the correlation EOLE by a factor 6.92.
Tab 6: Pressure drop of the assembly calculation
KEOLE KIdel’cik PIdelcik
[Pa/row] PEOLE [Pa/row] PLES [Pa/row] 0.1108 0.1936 0.2839 771 441 3054
We suppose that the experimental setup with a tube bundle in a closed square channel is responsible for the large difference. The configuration and boundary conditions of the assembly calculation represent an open, i.e. unbounded domain, quite the contrary to the EOLE experiment bounded by the channel walls.
5. FLOW IN AN UNBOUNDED ASSEMBLY
The position and extend of the simulation domains of the EOLE calculation (chapter 3) and assembly calculation (chapter 4) are compared in Fig.9. The corresponding boundary conditions are also given. The core region is schematically represented by the fuel rods and the main flow direction is given by the arrow. It is evident that the EOLE experiment does not represent correctly the physics of a transvers flow in a fuel assembly of a nuclear reactor core. The walls of the experimental channel inhibit any flow aligned to the rods axis over a longer axial distance as found in the assembly calculation. The setup of the assembly calculation takes the open, unbounded character of a fuel assembly in a reactor core most probably better into account.
Fig.9: Setup of the EOLE and assembly calculation as well as of the unbounded EOLE calculation
In order to test the impact of the restriction of the calculation domain on the pressure drop, a new modeling setup is proposed in the same Figure which resumes the geometry of the EOLE calculation, but which allows at the same time the flow to develop locally in axial direction, aligned to rod axes; only globally this flux is set to zero. This configuration is called “EOLE unbounded”.
The norm of the velocity for the two cases “EOLE calculation” and “EOLE unbounded” is shown in Figure 10 for a vertical cut plane between the rods at y=0.027m.
Fig.10: Norm of the velocity at y=0.027m; top “EOLE calculation”, bottom “EOLE unbounded”
P er io d ic P er io d ic EOLE calculation Fuel rods P er io d ic P er io d ic Inlet Outlet Assembly calculation Fuel rods P er io d ic P er io d ic EOLE unbounded Fuel rods
For the identic axial mean velocity of 1.6m/s the flow field of the EOLE calculation is given at the top; that of the open EOLE unbounded calculation is given at the bottom. Other than in the unbounded calculation, the mean velocity in the EOLE calculation is accelerated near the lower channel wall due to the global downward flow already shown in Fig.5. This downward flow balances the rising flow downwind of the rods. Near the top wall of the channel, the flow is de-accelerated. The resulting pressure drop of these two configurations is compared in Tab.7 to the experimentally derived pressure drop correlations.
Tab 7: Comparison of the pressure drops of EOLE experiment, EOLE calculation and EOLE unbounded
EOLE experiment EOLE calculation EOLE unbounded
PIdel’cik [Pa/row] PEOLE [Pa/row] PLES [Pa/row] PLES [Pa/row] 235 175 250 930
The configuration “EOLE unbounded” overestimates the correlation of Idel’cik by a factor 3.95 and the correlation of EOLE by a factor 5.3. These differences are very close to those determined for the same correlations and the assembly calculation (see Tab.6).
6. CONCLUSION
Heterogeneities in the coolant flow map in PWR cores are one of the mechanisms involved in fuel assembly deformation. The cross flow within and between fuel assemblies generates lateral hydraulic forces which have been studies with Large Eddy Simulation (LES). The inter assembly flow in two adjusted parts of fuel assemblies, separated by the assembly bypass flow, have been analyzed with the Trio_U code. The flow field and pressure forces in the assemblies were quantified for a slope angle of 22° between main flow and rods. A mesh of 700 million control volumes was used for the analysis. The simulation has been performed on 10,000 processor cores of the HPC computer CURIE of the TGCC. The calculated pressure drop is compared to correlations of single effect experiments of the CEA (EOLE) and to a correlation presented by Idel’cik. In contrary to the flow in the open, un-bounded core region, the EOLE experiments have been performed in a square channel bounded by walls. Typical PWR fuel assemblies were mounted in this channel with different inclination angles. The achieved comparison between experiment and simulation calculation raise the questions concerning the applicability of correlations derived from a channel configuration to the open core region. The presented numerical study together with the experimental findings enable us to better understand the applicability of pressure loss correlations on core regions with local cross flow and to evaluate hydrodynamic forces on fuel assemblies in the reactor.
REFERENCES
[1] H.J.Lippert, G.Gentet, P.Mollard, N.Garne : Zero Tolerance for Failure: An Areva Initiative to Improve Reliability. atw 54, 4, April 2010
https://inis.iaea.org/search/search.aspx?orig_q=RN:41067904
[2] N.Teboul, G.Gentet , C.Hintergräber, P.H.Louf, C.Wiltz: Areva product experience in support EPR fuel design. In: TOP FUEL 2012 Manchester UK, 2-6 September 2012
http://www.euronuclear.org/events/topfuel/topfuel2012/transactions/Transactions-Operation.pdf
[3] I.E. Idel’cik : Mémento des pertes de charge, coefficient de pertes de charge singulières et de pertes de charge par frottement, Edition Eyrolles, 1986
[4] J. Peybernes: Evaluation of the forces generated by cross-flow on PWR Fuel assembly. In: Structural behavior of fuel assemblies for water cooled reactors. Proceedings of a technical meeting held in Cadarache, France, 22–26 November 2004, IAEA-TECDOC-1454
http://www-pub.iaea.org/MTCD/publications/PDF/te_1454_web.pdf
[5] C. R. Barcellos, C. L. Bartz, L. A. M. Endres and S. V. Möller: Velocity and Pressure Fluctuations on inclined tube banks submitted to turbulent flow. Transaction SMiRT Whashington DC, 2001
http://www.mecanica.ufrgs.br/lmf/J1182.PDF [6] Trio_U (2008): http://www-trio-u.cea.fr/
[7] C. Calvin, O. Cueto, P. Emonot (2002): An object-oriented approach to the design of fluid mechanics software. ESAIM: Mathematical Modelling and Numerical Analysis - Modélisation Mathématique et Analyse Numérique, 36.5, 907-921 (2002) http://eudml.org/doc/245828 .
[8] U. Bieder, F. Falk, G. Fauchet : CFD analysis of the flow in the near wake of a generic PWR mixing grid. Ann. Nucl. Energy (2014), article in press http://dx.doi.org/10.1016/j.anucene.2014.08.004
[9] C.V. Hirt, B.D. Nichols, N.C. Romero (1975): SOLA - A numerical solution algorithm for transient flow. Los Alamos National Lab., Report LA-5852 (1975)
[10] F. Ducros, U. Bieder, O. Cioni, T. Fortin, B. Fournier, G. Fauchet, P. Quéméré (2010): Verification and validation considerations regarding the qualification of numerical schemes for LES for dilution problems. Nuclear Engineering and Design, 240 (2010), 2123-2130
[11] SALOME: http://www.salome-platform.org/
[12] U. Bieder, F. Falk, G. Fauchet (2014): LES analysis of the flow in a simplified PWR assembly with mixing grid: Progress in Nuclear Energy 75 (2014) 15-24 http://dx.doi.org/10.1016/j.pnucene.2014.03.014
[13] CENTAUR: http://www:centaursoft.com