HAL Id: hal-00670648
https://hal.archives-ouvertes.fr/hal-00670648
Submitted on 16 Feb 2012
HAL is a multi-disciplinary open access
archive for the deposit and dissemination of
sci-entific research documents, whether they are
pub-lished or not. The documents may come from
teaching and research institutions in France or
abroad, or from public or private research centers.
L’archive ouverte pluridisciplinaire HAL, est
destinée au dépôt et à la diffusion de documents
scientifiques de niveau recherche, publiés ou non,
émanant des établissements d’enseignement et de
recherche français ou étrangers, des laboratoires
publics ou privés.
Evaluation of in vivo liver tissue characterization with
spectral RF analysis versus elasticity
Stéphane Audière, Elsa D. Angelini, Maurice Charbit, V. Miette
To cite this version:
Stéphane Audière, Elsa D. Angelini, Maurice Charbit, V. Miette. Evaluation of in vivo liver tissue
characterization with spectral RF analysis versus elasticity. MICCAI 2011, Sep 2011, Toronto, France.
pp.387-395, �10.1007/978-3-642-23623-5_49�. �hal-00670648�
Evaluation of in vivo Liver Tissue Characterization
with Spectral RF Analysis versus Elasticity
Stéphane Audière1,2, Elsa D. Angelini1, Maurice Charbit1, Véronique Miette21 Institut Telecom, Telecom ParisTech, CNRS LTCI, Paris, FRANCE
2 Echosens, Research and Development Department, Paris, FRANCE
Abstract. Ultrasonic elastography, via vibration-controlled transient
elastogra-phy (VCTE™), enables to assess, under active mechanical constraints, the elas-ticity of the liver, correlating with fibrosis stages. On the other hand, the same VCTE™ probe can also be used in passive mode, acquiring RF lines at differ-ent locations in the liver. This paper presdiffer-ents a thorough evaluation of passive-mode RF spectral parameters (integrated backscatter coefficient, power spectral index, effective scattering size and spectral variance), for tissue characterization on a large cohort of volunteers with various ranges of elasticity measures. Re-sults showed that capabilities to discriminate between liver and subcutaneous fat tissues were highly variable among spectral parameters. Furthermore, it ap-pears that no in vivo discrimination of liver elasticity/fibrosis stage can be per-formed with passive RF spectral analysis, at 3.5MHz.
Keywords: ultrasound, RF lines, liver, backscatter coefficient, scatterer size,
spectral analysis, elastography.
1 Introduction
A large amount of literature exists on the potential of backscatter radiofrequency (RF) analysis to characterize tissue content. The underlying assumption in this field is that scattering properties characterize and discriminate tissues. However, in conventional ultrasonic data processing and image formation, the frequency content of the back-scattered RF data is generally not exploited. The backback-scattered RF ultrasound signal content depends on the acoustic properties of the tissue (density and size of the reflec-tors), but also on the transfer function of the transducer. Both components are fre-quency dependent through signal attenuation and backscattering intensity in the tis-sue. In this study we investigated several spectral parameters to discriminate in vivo different types of tissues and different stages of liver fibrosis. The study was divided into two steps: first we investigated if liver fibrosis stage correlates with some acous-tic parameters that are sensitive to tissue microstructures. Secondly, we investigated if subcutaneous and liver tissues could be discriminated based on acoustic parameters that are sensitive to tissue macrostructures. Such information is necessary for ade-quate use of the Vibration-controlled transient elastography (VCTE™) probe. Meas-urements were performed on a database of 181 volunteers, with a single-transducer VCTE™ probe operating at f0 = 3.5MHz in a bandwidth 2.5-4.5MHz and with a focus
at 35mm. Similar studies appear in the literature but on smaller in vivo databases and with histological fibrosis scores, while we used mechanical elasticity measurements.
The ultrasound RF signals were acquired for a depth range between 5 and 65 mm, to accommodate for the variability of the skin-liver capsule distance within the volun-teers population. Pass-band filtering was applied in band 1-8 MHz by the frontal hardware. From individual RF lines, we extracted the following parameters: the broadband ultrasound attenuation (BUA), the backscattered coefficient (BSC), the scattering power index (SPI), the effective scatterer size (ESS) and the spectral vari-ance (SV). Screening was also performed in active (elastography) mode, using the VCTE™ technique [1] to quantify liver elasticity by measuring the velocity of a low-frequency shear wave generated by a pulse and travelling through the liver. It has been demonstrated that stiffness is highly correlated with fibrosis stage assessed by liver biopsy [2].
2 Materials and Methods
Measured RF signals correspond to echoes of an initially transmitted pulse, which propagated up to a certain depth in the body, attenuated along the travel path and par-tially reflected at interfaces between tissues and by non-specular reflections in "granu-lar" tissues such as the liver. The notion of granularity depends on the ratio of the wavelength of the emitted signal and the micro-texture of the tissue. At 3.5MHz, for an average speed of sound of 1500 m/s in human soft tissues, this corresponds to wavelength λ=430µm, which is of the order of magnitude of the liver microstructures. The spectrogram
S
(
f
,
z
)
of the RF signal at frequency f and at a distance z from the probe is generally modelled as [3-4]:z f e f R f H z f S 2 2 2 ( ) ) ( ) ( ) , ( = −α , (1)
where H is the Fourier Transform (FT) of the composite pulse, consisting of the transmitted pulse and the response of the electronic device. R is the FT of the back-scatter component from the echoes and
α
( f
)
is the attenuation coefficient function. The last two terms encode the interaction of the transmitted pulse with the tissues. Within the limited bandwidth of the ultrasound transducer, experimental measures have shown that RF lines are attenuated in soft tissues proportionally to the operating frequency so thatα
(
f
)
=
β
f
, whereβ
is the BUA.Regarding the generation of non-specular reflection in a homogeneous tissue, the backscattering spectrum is often modeled as
R
(
f
)
=
f
n, where n is the SPI that ranges from 0 to 4 in soft materials, and from 1 to 2 for most human soft tissues.The transmitted pulse consisted of two periods of sinusoid with apodization. This signal can be adequately approximated by a modulated Gaussian pulse leading to a Gaussian spectral distribution that writes:
2 2 0 2 ) ( ) ( σ f f e f H − − ∝ , (2)
2.1 RF spectral parameters related to tissue characterization
Five spectral parameters were studied as illustrated in Fig. 1
Fig. 1: Liver screening protocol (left) and flowchart of spectral RF signal analysis.
We now detail the estimation of these parameters, based on various models com-monly used in the literature dedicated to ultrasound-based tissue characterization.
Estimation of the BUA
Taking the log of Eq. (1), the log-spectrum writes
2 2
ln( ( , ))S f z =ln H f( ) +ln R f( ) −α( )2f z, (3)
Assuming that the tissue is homogeneous over a thickness of a few wavelengths, we use a short-term spectral analysis (STSA) based on the Welch’s approach. The at-tenuation coefficient α(f) is then accessed via the derivative of the log-spectrum with respect to z. Indeed, for each frequency component, we have:
z z f S f ∂ ∂ − = ln( ( , )) 2 1 ) ( α , (4)
For the linear model,
α
( )
f
=
β
f
, the broadband ultrasound attenuation (BUA) coefficient can be estimated by least square regression on the experimental attenua-tion coefficient [5]. It is general practice in clinical use to reconstruct ultrasound im-ages assuming a fixedβ
value of0
.
5
dB
cm
−1MHz
−1 for human soft tissues.Estimation of the backscatter coefficients BSC and IBC
The backscatterer coefficient was introduced in [6] and corresponds to the relative scattering cross-section per unit solid angle and volume. Indeed to compute the BSC, echoes from the media of interest are compared to specular echoes measured from a steel plate with a reflection coefficient of R=0.9 and placed at the focal length of the transducer. This plate is used as the reference signal to learn the transducer transfer function. The BSC is then computed as:
) , ( 45 . 1 ) , ( 0 2 Z f W z A Z Z f BSC ∆ = , (5)
where A0 is the area of the transducer aperture,
∆
z
is the axial length used for localmeasures, and Z is the axial distance between the transducer and plate. W(f,Z) is the
ratio between the spectrograms of the backscattered RF signal and the reference sig-nal, and given by:
) , ( ) , ( 2 ) , ( 0 ) 2 / ))( ( ) ( ( 4 2 0 Z f S Z f S e R Z f W m f− f Z+∆z m = α α , (6)
where
S
mis the STSA of the sample media RF signal,S
0is the STSA of the plate RF signal,(
α
m(
f
),
α
0(
f
))
are the attenuation coefficients (Eq. 1) for the sample and ref-erence media. From a series of BSC measurements at different frequencies within the bandwidth[
f
min, f
max]
of the transducer, we can compute the integrated backscatter coefficient (IBC), as the frequency-average of the BSC:∫
− = max min ) , ( 1 ) ( min max f f BSC f Z df f f Z IBC , (7)Estimation of the scattering power index (SPI)
For independent scatterers of size smaller than the wavelength, theoretical approaches [7] lead to a BSC frequency dependence in
f
4 : this is called the Rayleigh limit. In practice, it was observed that this simple model fails in soft tissues [8], leading to a generalization of the BSC frequency dependence model as:BSC
(
f
,
Z
)
∝
f
n,where n is the scattering power index. To estimate the SPI, a log-log linear regression analysis on the empirical BSC with respect to frequency within the bandwidth of the transducer is performed. The regression slope yields a tissue-specific SPI value which ranges between 1 and 4 in soft tissues, as reported in several studies [9-10].
Estimation of the effective scatterer size (ESS)
Rather than relying on a macroscopic measure of the backscatterer intensity with the BSC, alternative theoretical backscattering models have been proposed [9-10]. These models provide theoretical BSC expressions as the TF of the autocorrelation functions explicitly parameterized with the effective scatterer size a, corresponding to the spa-tial variation of the density and compressibility within the tissue. A series of BSC curves was generated for different values of a. From the slope of the log-log linear re-gression, a series of theoretical SPI values, related to a, was derived. The a value pro-viding the theoretical SPI closest to the empirical SPI is then selected as the scatterer size of the observed tissue. In this study we tested two autocorrelation models [4, 9], described in Table 1, to estimate the ESS.
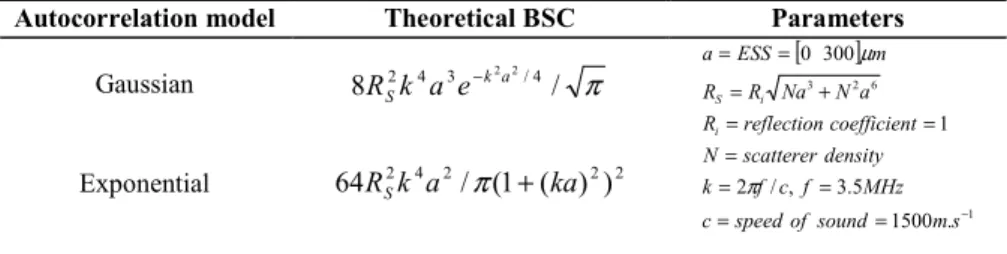
Table 1: Spatial autocorrelation models and theoretical BSC functions.
Autocorrelation model Theoretical BSC Parameters
Gaussian 8RS2k4a3e−k2a2/4/ π Exponential 64RS2k4a2/π(1+(ka)2)2 [ ] 1 6 2 3 . 1500 5 . 3 , / 2 1 300 0 − = = = = = = = + = = = s m sound of speed c MHz f c f k density scatterer N t coefficien reflection R a N Na R R m ESS a i i S π µ
Spectral Variance σσσσ'2
As in [11], the spectrogram of the received echoes
S
(
f
,
z
)
can be approximate as a Gaussian pulse, around the central frequencyf
C following:2 2 ' 2 ) ( ) , ( σ c f f e z f S − − ∝ , (8)
where
σ
'
is given by:2 2 0 2 0 2 2 ' σ σ σ n f f + = , (9)
According to this model, soft tissues with different acoustic properties (character-ized by n) should generate echoes with different spectrum bandwidth. Computation of this parameter on in vivo RF signals is detailed in [12].
The literature on RF based tissue characterization, exploiting all the previous models, contains very few in vivo studies, and only performed on small cohorts of volunteers. We exploited a large cohort of volunteers, to evaluate the models, and investigate the potential correlation between elasticity measures and spectral RF parameters for a large range of values.
3
Results and Discussion
3.1 Ultrasound RF Scanning Setup and Procedure
The VCTE™ device used in this study was composed of a probe containing a low-frequency vibrator, an ultrasonic transducer operating, at 3.5 MHz, a dedicated elec-tronic system and a control unit (50 MHz sampling frequency with a 14-bit resolu-tion). A single element probe was used both as an emitter and a receiver. For each volunteer, 400 ultrasound RF lines were acquired, along a fixed scan line, at a pulse repetition frequency of 20 Hz during 20 s.
A database was acquired with the VCTE™ probe, operating in passive and elasto-graphy modes [1], on 181 volunteers. Elastoelasto-graphy mode was used to measure the elasticity of the liver. The ultrasound RF lines were acquired for a depth range be-tween 5 and 65mm, to accommodate for the variability of the skin-liver capsule dis-tance within the population.
A phantom was also used to validate our computational framework for the experi-mental BSC, SPI and ESS computations. It was made of a mixture of cohesive co-polymer, white mineral oil, and silica powder as acoustic scatterers [13]. Particle di-ameters ranged between 35–70 µm. The diameter of these particles, smaller by an order of ten than the wavelength of the ultrasound pulse (λ=430 µm) provides Rayleigh scattering conditions (i.e. BSC proportional to f 4).
Spectral parameters were estimated on individual RF lines, using STSA with 75% overlapping windows of length 12λ, along the whole depth range. Spatial parameter values can be displayed as parametric images for tissue segmentation, as [14], or con-catenated into their median value for quantitative characterization of tissue types (such as liver tissues with different fibrosis stages).
3.2 Quantitative liver fibrosis stage characterization via spectral analysis Phantom study
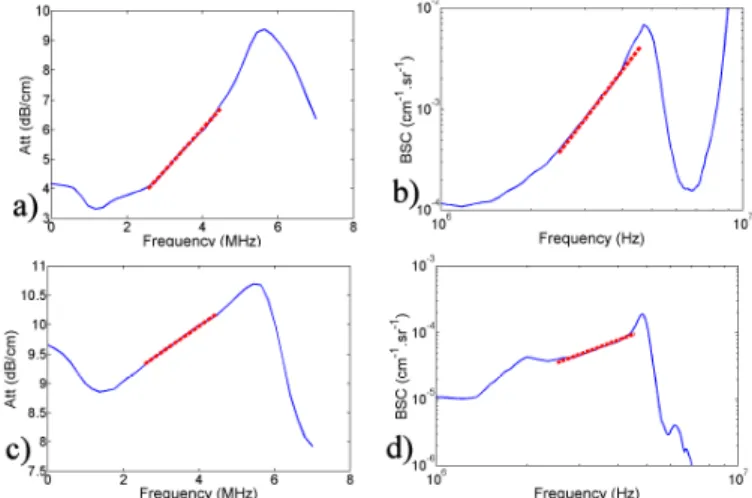
Average elasticity of the phantom was measured, using the VCTE™ elastography probe, as E=6.0±0.05 kPa over 10 measurements. Median values over the 400 RF lines provided attenuation and BSC measures illustrated in Fig. 2. We can observe on these results that the phantom media behaved as expected, with attenuation and BSC coefficients varying linearly, in frequency and in log-frequency respectively, within the bandwidth of the transducer. Linear interpolations, illustrated in Fig. 2, lead to empirical estimations of the BUA=1.14±0.03 dB/cm/MHz and SPI= 3.97±0.15. The other spectral parameters provided the following measures: IBC= -68.14±0.89dB, ESS =19.85±9.24 µm with the exponential model, ESS=55.9±26.16 µm with the Gaussian model and σ'2=1.36±0.05. These results were in agreement with what was expected, with a SPI close to 4 and ESS size close to the phantom, specifications us-ing the Gaussian autocorrelation model.
Fig. 2: Experimental measures on a phantom(a-b) and liver (c-d): (a-c) Attenuation and BUA measurements. (b-d) BSC and SPI measurements.
In vivo study
For in vivo RF signals, we report, in Table 2, median values of the spectral parameters computed on the 400 RF lines. We have considered three classes of liver fibrosis [2]. In Table 2, N denotes the number of volunteers in each class.
Table 2: Average-median spectral parameters on in vivo liver tissue scanning.
Fibrosis stage N E (kPa) BUA (dB/cm/MHz) SPI (f n ) ESS (µm) IBC (dB) σ’ (MHz) Non to mild 105 4.7±0.8 0.41±0.23 1.68±0.68 220.5±36.8 -58.5±6.8 1.03±0.03 Significant to extensive 66 7.2±1.3 0.37±0.29 1.73±0.88 218.0±44.9 -59.9±8.3 1.05±0.03 Cirrhosis 10 21.0±9.2 0.38±0.33 1.81±0.94 214.3±51.2 -58.8±9.7 1.06±0.04
BUA and BSC are reported Fig. 2. We observed that linear fits on the attenuation and the BSC curves was suitable for in vivo RF measures, within the bandwidth of the transducer. None of the average parameter measures was able to discriminate between the three classes of liver fibrosis stages. This result is in agreement with the in vivo study of [15] but which was performed on a cohort of only 17 volunteers.
3.3 Spectral parametric images for tissue segmentation
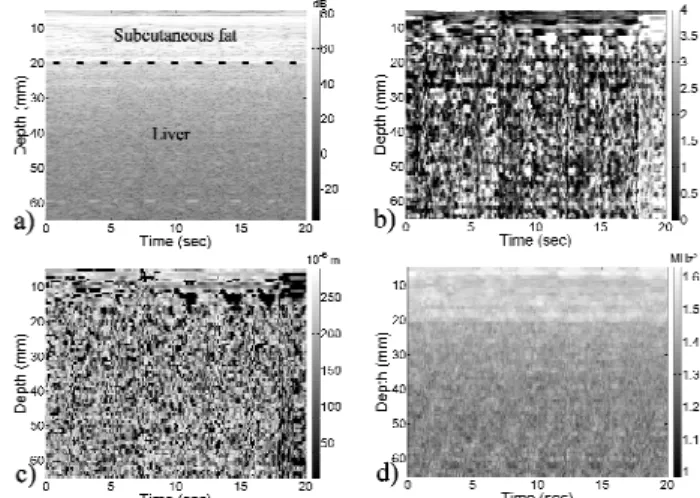
Parametric images were generated for all the spectral parameters. As illustrated in Fig. 3 for three of the parameters, these images showed high spatial variations of the parameter values and poor homogeneity within the three tissue layers: subcutaneous fat, muscle/fat layer and liver.
Fig. 3: Image of RF line envelopes (a) and parametric maps of SPI (b), ESS (c) and
σ’2
(d) spectral parameters.
Segmentation of these layers might be worthwhile to investigate via three ap-proaches: (1) thresholding of the RF envelope, which is limited by a high noise level and uncalibrated variations on the RF envelope intensity, (2) thresholding of the spec-tral variance, confirming the results reported in [12], (3) exploitation of the SPI con-verging to zero at specular interfaces between the three layers, as clearly observed in Fig. 3. Regarding the ESS parameter, it is not discriminating for small SPI values and can only reflect macro granularity of the tissues, rather than characterizes interfaces.
4 Conclusion
This paper has presented an in vivo study of spectral parametric analysis of RF ul-trasound signals for tissue characterization. Results were in agreement with the litera-ture and showed that in vivo spectral tissue characterization remains challenging. While spectral parametric analysis provides promising capabilities for tissue segmen-tation, fine classification of tissue fibrosis stage seems too difficult. Maybe the ex-perimental conditions were not appropriate for accurate quantification of scattering
properties. Indeed, one important limitation is that all these parameters (except the SV) rely entirely on an accurate estimate of the BUA that requires a homogeneous tis-sue, which is not the case in the fat layer. In the majority of papers, the problem was acknowledged too challenging and an average value of 0.5dB/cm/MHz is used.
From our results, we conclude that no in vivo discrimination of liver elastic-ity/fibrosis stage can be performed with passive RF spectral analysis, at 3.5MHz and a wavelength of 430µm. We infer from this that either liver tissue homogeneity must be studied at a shorter wavelength, which is not applicable in vivo due to attenuation ef-fects, or we need to look at the tissue structures at a larger scale, for example with the mean scatterer spacing [16], which is a non-parametric approach requiring higher fre-quencies in the echo pulses.
Bibliography
[1] L. Sandrin, et al., "Transient elastography: A new noninvasive method for assessment of hepatic fibrosis.," Ultrasound in Medicine and Biology, vol. 29, pp. 1705-1713, 2003.
[2] L. Castera, et al., "Prospective comparison of transient elastography, Fibrotest, APRI, and liver biopsy for the assessment of fibrosis in chronic hepatitis C," Gastroenterology, vol. 128, pp. 343--350, 2005. [3] B. J. Oosterveld, et al., "Ultrasound attenuation and texture analysis of diffuse liver disease: methods
and preliminary results," Physics in Medicine and Biology, vol. 36, pp. 1039-1064, 1991.
[4] R. L. Romijn, et al., "Estimation of scatterer size from backscattered ultrasound: a simulation study,"
Ultrasonics, Ferroelectrics and Frequency Control, IEEE Transactions on, vol. 36, pp. 593-606, 1989.
[5] R. Kuc and M. Schwartz, "Estimating the Acoustic Attenuation Coefficient Slope for Liver from Reflected Ultrasound Signals," Sonics and Ultrasonics, IEEE Transactions on, vol. 26, pp. 353-361, 1979.
[6] M. F. Insana, et al., "Describing small-scale structure in random media using pulse-echo ultrasound,"
Journal of Acoustical Society of America, vol. 87, pp. 179-192, 1990.
[7] R. F. Wagner, et al., "Statistical properties of radio-frequency and envelope-detected signals with applications to medical ultrasound," J. Opt. Soc. Am. A, vol. 4, pp. 910-922, 1987.
[8] F. L. Lizzi, et al., "Relationship of ultrasonic spectral parameters to features of tissue microscructure,"
IEEE Transactions on Ultrasononics, Ferroelectrics and Frequency Control, vol. 33, pp. 319-333,
1986.
[9] M. Ueda and Y. Ozawa, "Spectral analysis of echoes for backscattering coefficient measurement," The
Journal of the Acoustical Society of America, vol. 77, pp. 38-47, 1985.
[10]D. Nicholas, et al., "Evaluation of backscattering coefficients for excised human tissues: Principles and techniques," Ultrasound in Medicine & Biology, vol. 8, pp. 7-15, 1982.
[11]G. Treece, et al., "Ultrasound attenuation measurement in the presence of scatterer variation for reduction of shadowing and enhancement," Ultrasonics, Ferroelectrics and Frequency Control, IEEE
Transactions on, vol. 52, pp. 2346-2360, 2005.
[12]S. Audière, et al., "Measurement of the Skin-Liver Capsule Distance on Ultrasound RF Data for 1D Transient Elastography," in Medical Image Computing and Computer-Assisted Intervention – MICCAI
2010. vol. 6362, T. Jiang, et al., Eds., ed: Springer Berlin / Heidelberg, 2010, pp. 34-41.
[13]J. Oudry, et al., "Copolymer-in-oil phantom materials for elastography," Ultrasound Med Biol, vol. 35, pp. 1185-97, Jul 2009.
[14]M. F. Insana and T. J. Hall, "Parametric ultrasound imaging from backscatter coefficient measurements: Image formation and interpretation," Ultrasonic Imaging, vol. 12, pp. 245-267, 1990. [15]K. A. Wear, et al., "Measurements of ultrasonic backscatter coefficients in human liver and kidney in
vivo," The Journal of the Acoustical Society of America, vol. 98, pp. 1852-1857, 1995.
[16]C. B. Machado, et al., "Characterization of in vitro healthy and pathological human liver tissue periodicity using backscattered ultrasound signals," Ultrasound in Medicine & Biology, vol. 32, pp. 649-657, 2006.