EUROPEAN ORGANIZATION FOR NUCLEAR RESEARCH (CERN)
CERN-EP-2017-100 LHCb-PAPER-2017-013 August 22, 2017
Test of lepton universality with
B
0
→ K
∗0
`
+
`
−
decays
The LHCb collaboration†
Abstract
A test of lepton universality, performed by measuring the ratio of the branching fractions of the B0 → K∗0µ+µ− and B0 → K∗0e+e− decays, RK∗0, is presented. The K∗0 meson is reconstructed in the final state K+π−, which is required to have an invariant mass within 100 MeV/c2 of the known K∗(892)0 mass. The analysis is performed using proton-proton collision data, corresponding to an integrated luminosity of about 3 fb−1, collected by the LHCb experiment at centre-of-mass energies of 7 and 8 TeV. The ratio is measured in two regions of the dilepton invariant mass squared, q2, to be
RK∗0 = (
0.66+ 0.11− 0.07(stat)± 0.03 (syst) for 0.045 < q2 < 1.1 GeV2/c4, 0.69+ 0.11− 0.07(stat)± 0.05 (syst) for 1.1 < q2 < 6.0 GeV2/c4.
The corresponding 95.4% confidence level intervals are [0.52, 0.89] and [0.53, 0.94]. The results, which represent the most precise measurements of RK∗0 to date, are compatible with the Standard Model expectations at the level of 2.1–2.3 and 2.4–2.5 standard deviations in the two q2 regions, respectively.
Published in JHEP 08 (2017) 055
c
CERN on behalf of the LHCb collaboration, licence CC-BY-4.0.
†Authors are listed at the end of this paper.
1
Introduction
In the Standard Model (SM) of particle physics, the electroweak couplings of leptons to gauge bosons are independent of their flavour and the model is referred to as exhibiting lepton universality (LU). Flavour-changing neutral-current (FCNC) processes, where a quark changes its flavour without altering its electric charge, provide an ideal laboratory to test LU. The SM forbids FCNCs at tree level and only allows amplitudes involving electroweak loop (penguin and box) Feynman diagrams. The absence of a dominant tree-level SM contribution implies that such transitions are rare, and therefore sensitive to the existence of new particles. The presence of such particles could lead to a sizeable increase or decrease in the rate of particular decays, or change the angular distribution of the final-state particles. Particularly sensitive probes for such effects are ratios of the type [1] RH =
R
dΓ(B→Hµ+µ−) dq2 dq2R
dΓ(B→He+e−) dq2 dq2 ,where H represents a hadron containing an s quark, such as a K or a K∗ meson. The
decay rate, Γ, is integrated over a range of the squared dilepton invariant mass, q2. The
RH ratios allow very precise tests of LU, as hadronic uncertainties in the theoretical
predictions cancel, and are expected to be close to unity in the SM [1–3]. At e+e− colliders operating at the Υ (4S) resonance, the ratios R
K(∗) have been
measured to be consistent with unity with a precision of 20 to 50% [4, 5]. More recently, the most precise determination to date of RK in the q2 range between 1.0 and 6.0 GeV2/c4
has been performed by the LHCb collaboration. The measurement has a relative precision of 12% [6] and is found to be 2.6 standard deviations lower than the SM expectation [1]. Hints of LU violation have been observed in B→ D(∗)`ν
` decays [7–9]. Tensions with
the SM have also been found in several measurements of branching fractions [10–12] and angular observables [13, 14] of rare b→ s decays. Models containing a new, neutral, heavy gauge boson [15–20] or leptoquarks [21, 22] have been proposed to explain these measurements.
A precise measurement of RK∗0 can provide a deeper understanding of the nature
of the present discrepancies [23]. Some of the leading-order Feynman diagrams for the B0→ K∗0`+`− decays, where ` represents either a muon or an electron, are shown in
figure 1 for both SM and possible New Physics (NP) scenarios. If the NP particles couple differently to electrons and muons, LU could be violated. The K∗0 represents a
K∗(892)0 meson, which is reconstructed in the K+π− final state by selecting candidates
within 100 MeV/c2 of the known mass [24]. No attempt is made to separate the K∗0
meson from S-wave or other broad contributions present in the selected K+π− region.
The S-wave fraction contribution to the B0→ K∗0µ+µ− mode has been measured by the
LHCb collaboration and found to be small [25]. Inclusion of charge-conjugate processes is implied throughout the paper, unless stated otherwise. The analysis is performed in two regions of q2 that are sensitive to different NP contributions: a low-q2 bin, between 0.045
and 1.1 GeV2/c4, and a central-q2 bin, between 1.1 and 6.0 GeV2/c4. The lower boundary of
the low-q2 region corresponds roughly to the dimuon kinematic threshold. The boundary
at 1.1 GeV2/c4 is chosen such that φ(1020)→ `+`− decays, which could potentially dilute
Figure 1: Feynman diagrams in the SM of the B0→ K∗0`+`−decay for the (top left) electroweak penguin and (top right) box diagram. Possible NP contributions violating LU: (bottom left) a tree-level diagram mediated by a new gauge boson Z0 and (bottom right) a tree-level diagram involving a leptoquark LQ.
bin at 6.0 GeV2/c4 is chosen to reduce contamination from the radiative tail of the J/ψ
resonance.
The measurement is performed as a double ratio of the branching fractions of the B0→ K∗0`+`− and B0→ K∗0J/ψ (→ `+`−) decays RK∗0 = B(B 0→ K∗0µ+µ−) B(B0→ K∗0J/ψ ( → µ+µ−)) B(B0→ K∗0e+e−) B(B0→ K∗0J/ψ ( → e+e−)),
where the two channels are also referred to as the “nonresonant” and the “resonant” modes, respectively. The experimental quantities relevant for the measurement are the yields and the reconstruction efficiencies of the four decays entering in the double ratio. Due to the similarity between the experimental efficiencies of the nonresonant and resonant decay modes, many sources of systematic uncertainty are substantially reduced. This helps to mitigate the significant differences in reconstruction between decays with muons or electrons in the final state, mostly due to bremsstrahlung emission and the trigger response. The decay J/ψ→ `+`− is measured to be consistent with LU [24]. In order to
avoid experimental biases, a blind analysis was performed. The measurement is corrected for final-state radiation (FSR). Recent SM predictions for RK∗0 in the two q2 regions are
reported in table 1. Note that possible uncertainties related to QED corrections are only included in Ref. [26], and these are found to be at the percent level. The RK∗0 ratio is
smaller than unity in the low-q2 region due to phase-space effects.
The remainder of this paper is organised as follows: section 2 describes the LHCb detector, as well as the data and the simulation samples used; the experimental challenges in studying electrons as compared to muons are discussed in section 3; section 4 details
Table 1: Recent SM predictions for RK∗0. q2 range [ GeV2/c4] RSM K∗0 References [0.045, 1.1] 0.906 ± 0.028 BIP [26] 0.922 ± 0.022 CDHMV [27–29] 0.919 + − 0.0040.003 EOS[30, 31] 0.925 ± 0.004 flav.io[32–34] 0.920 + − 0.0070.006 JC [35] [1.1, 6.0] 1.000 ± 0.010 BIP [26] 1.000 ± 0.006 CDHMV [27–29] 0.9968 +− 0.00050.0004 EOS[30, 31] 0.9964 ± 0.005 flav.io[32–34] 0.996 ± 0.002 JC [35]
how the simulation is adjusted in order to improve the modelling of the data; the selection of the candidates, rejection of the background and extraction of the yields are outlined in sections 5, 6 and 7; section 8 discusses the efficiency determination; the cross-checks performed and the systematic uncertainties associated with the measurement are summarised in sections 9 and 10, respectively; the results are presented in section 11; and section 12 presents the conclusions of the paper.
2
The LHCb detector and data set
The LHCb detector [36, 37] is a single-arm forward spectrometer covering the pseudora-pidity range 2 < η < 5, designed to study particles containing b or c quarks. The detector includes a high-precision tracking system consisting of a silicon-strip vertex detector surrounding the pp interaction region, a large-area silicon-strip detector located upstream of a dipole magnet with a bending power of about 4 Tm, and three stations of silicon-strip detectors and straw drift tubes placed downstream of the magnet. The tracking system provides a measurement of momentum, p, with a relative uncertainty that varies from 0.5% at low values to 1.0% at 200 GeV/c. The minimum distance of a track to a primary vertex (PV), the impact parameter (IP), is measured with a resolution of (15 + 29/pT) µm, where
pT is the component of the momentum transverse to the beam, in GeV/c. Different types
of charged hadrons are distinguished using information from two ring-imaging Cherenkov detectors. Photons, electrons and hadrons are identified by a calorimeter system consisting of scintillating-pad and preshower detectors, an electromagnetic calorimeter (ECAL) and a hadronic calorimeter (HCAL). Muons are identified by a system composed of alternating layers of iron and multiwire proportional chambers.
The trigger system consists of a hardware stage, based on information from the calorimeter and muon systems, followed by a software stage, which applies a full event reconstruction. The hardware muon trigger selects events containing at least one muon
with significant pT (from ∼ 1.5 to ∼ 1.8 GeV/c, depending on the data-taking period).
The hardware electron trigger requires the presence of a cluster of calorimeter cells with significant transverse energy, ET, (from ∼ 2.5 to ∼ 3.0 GeV, depending on the data-taking
period) in the ECAL. The hardware hadron trigger requires the presence of an energy deposit with ET above ∼ 3.5 GeV in the calorimeters. The software trigger requires a
two-, three- or four-track secondary vertex, with a significant displacement from the PV. At least one charged particle must have significant pT and be inconsistent with originating
from any PV. A multivariate algorithm [38] is used for the identification of secondary vertices consistent with the decay of a b hadron.
The analysis is based on pp collision data collected with the LHCb detector at centre-of-mass energies of 7 and 8 TeV during 2011 and 2012, and corresponding to an inte-grated luminosity of about 3 fb−1. Samples of simulated B0→ K∗0µ+µ−, B0→ K∗0e+e−,
B0→ K∗0
J/ψ (→ µ+µ−
) and B0→ K∗0
J/ψ (→ e+e−
) events are used to determine the efficiency to trigger, reconstruct and select signal events, as well as to model the shapes used in the fits for signal candidates. In addition, specific simulated samples are utilised to estimate the contributions from backgrounds and to model their mass distributions. The pp collisions are generated using Pythia [39] with a specific LHCb configuration [40]. Decays of hadronic particles are described by EvtGen [41], in which FSR is generated using Photos [42], which is observed to agree with a full QED calculation at the level of ∼ 1% [26]. The interaction of the generated particles with the detector, and its response, are implemented using the Geant4 toolkit [43] as described in Ref. [44].
3
Electron reconstruction effects
The experimental environment in which the LHCb detector operates leads to significant differences in the treatment of decays involving muons or electrons in the final state. The two types of leptons behave differently when travelling through the detector material. Electrons emit a much larger amount of bremsstrahlung which, if not accounted for, would result in a significant degradation of the momentum resolution and consequently in a degradation of the B mass resolution. If the radiation occurs downstream of the dipole magnet, the photon energy is deposited in the same calorimeter cell as that of the lepton, and the momentum of the electron is correctly measured. If the photons are emitted upstream of the magnet, the electron and photon deposit their energy in different calorimeter cells, and the electron momentum is evaluated after bremsstrahlung emission. However, for both types of emissions, the ratio of the energy detected in the ECAL to the momentum measured by the tracking system, an important variable to identify electrons, remains unbiased.
A dedicated bremsstrahlung recovery procedure is used to improve the electron mo-mentum reconstruction. Searches are made within a region of the ECAL defined by the extrapolation of the electron track upstream of the magnet for energy deposits with ET > 75 MeV that are not associated with charged tracks. Such “bremsstrahlung clusters”
are added to the measured electron momentum. If the same cluster can be associated with both the e+and the e−, its energy is added to one of the two electrons at random. In
B0→ K∗0J/ψ (→ e+e−) decays, one bremsstrahlung cluster is added to either electron of
the pair in about half of the cases; the remaining half is equally split between cases when no bremsstrahlung cluster is found, or two or more clusters are added. These fractions are
reproduced well by the simulation and depend only weakly on q2. The bremsstrahlung
recovery procedure is limited in three ways: the energy threshold of the clusters that are added; the calorimeter acceptance and resolution; and the presence of energy deposits wrongly interpreted as bremsstrahlung clusters. These limitations degrade the resolution of the reconstructed invariant masses of both the dielectron pair and the B candidate.
Since the occupancy of the calorimeters is significantly higher than that of the muon stations, the constraints on the trigger rate require that higher thresholds are imposed on the electron ET than on the muon pT. In the central-q2 region the higher threshold
causes a loss of about half of the electron signal. The efficiency decreases slightly at lower q2 values. To partially mitigate this effect, decays with electrons in the final state can
also be selected through the hadron hardware trigger, using clusters associated with the K∗0 decay products, or by any hardware trigger from particles in the event that are not
associated with the signal candidate.
In decays with electrons, since the mass resolution of the reconstructed B candidate is worse than in final states with muons, the background contamination in the signal region is larger. The level of combinatorial background, arising from the accidental association of particles produced by different b- and c-hadron decays, is also higher in such channels, due to a larger number of electron candidates. As a result, the discriminating power of the fits to extract the signal yields is reduced (see section 7). Differences due to bremsstrahlung and the trigger response lead to a reconstruction efficiency for the B0→ K∗0J/ψ (
→ e+e−)
decays that is about five times smaller than for the B0→ K∗0J/ψ (→ µ+µ−) decays.
4
Corrections to the simulation
In order to optimise the selection criteria and accurately evaluate the efficiencies, a set of corrections is determined from unbiased control samples selected from the data. The procedure is applied to the simulated samples of the nonresonant and resonant modes.
The first correction accounts for differences between simulation and data in the particle identification (PID) performance [45]. The PID efficiencies are directly measured using a tag-and-probe method on high-purity data samples of pions and kaons from D∗+
→ D0(→ K−π+)π+decays. Similarly, the electron and muon identification efficiencies
are obtained from B+→ K+J/ψ (→ `+`−) decays. Corrections are determined as a function
of the track momentum and pseudorapidity.
The second step of the procedure adjusts the simulation for the charged-track multi-plicity in the event, which is not described well in simulation. A small correction for the B0 kinematics is also applied. Resonant B0→ K∗0J/ψ (→ µ+µ−) decays are used since
the muon triggers are observed to be well modelled in simulation.
The third step corrects the simulation of the trigger response for both the hardware and software levels using a tag-and-probe technique. Whenever pos-sible, B0→ K∗0J/ψ (
→ µ+µ−) decays are used as a control sample in place of
B0→ K∗0J/ψ (→ e+e−) decays in order to take advantage of the larger sample size. In
such cases, the two decays are compared and found to give consistent results. The tag sample is defined by events where the hardware trigger is fired by activity in the event not associated with any of the signal decay particles. Alternatively, when probing the leptonic (hadronic) hardware triggers, the tag is required to have triggered the hadronic (leptonic) hardware trigger. The corrections for the leptonic hardware triggers are parameterised
as a function of the cluster ET or track pT. The hadron hardware trigger efficiency is
known to be sensitive to tracks overlapping in the HCAL, however, a good description can be obtained when the efficiency is measured as a function of the pT of the K+π− pair
instead of the kaon or the pion independently. Corrections are determined separately in the different calorimeter regions [36], in order to take into account potential differences due to different occupancies. When the hardware trigger is fired by activity in the event not associated with any of the signal decay particles, the correction is determined as a function of the B0 p
T and the charged-track multiplicity in the event in order to take into
account correlations in the production between the two b hadrons in the event. For the software trigger, the corrections are determined as a function of the minimum pT of the
B0 decay products.
Finally, residual differences between data and simulation in the reconstruction per-formance are accounted for using B0→ K∗0
J/ψ (→ `+`−
) candidates to which the full selection is applied, as well as additional requirements to further reduce the background contamination. The corrections are determined by matching the distribution of the B0
kinematics and vertex fit quality in simulation to the data, separately for muon and electron samples.
The correction factors are determined sequentially as histograms, with the previous corrections applied before deriving the subsequent one. To avoid biases in the procedure due to common candidates being used for both the determination of the corrections and the measurement, a k-folding [46] approach with k = 10 is adopted. To dilute the dependence on the choice of the binning schemes, all corrections are linearly interpolated between adjacent bins. After all the corrections are applied to the simulation, a very good agreement with the data is obtained.
5
Selection of signal candidates
A B0 candidate is formed from a pair of well-reconstructed oppositely charged particles
identified as either muons or electrons, combined with two well-reconstructed oppositely charged particles, one identified as a kaon and the other as a pion. The K+π− invariant
mass is required to be within 100 MeV/c2 of the known K∗0 mass. The kaon and pion must
have pT exceeding 250 MeV/c, while for the muons (electrons) pT > 800 (500) MeV/c is
required. Only dilepton pairs with a good-quality vertex are used to form signal candidates. The K∗0 meson and `+`− pair are required to originate from a common vertex in order
to form a B0 candidate. When more than one PV is reconstructed, the one with the
smallest χ2
IP is selected, where χ2IP is the difference in χ2 of a given PV reconstructed
with and without the considered B0 candidate. With respect to this selected PV, the
impact parameter of the B0 candidate is required to be small, its decay vertex significantly
displaced, and the momentum direction of the B0 is required to be consistent with its
direction of flight. This direction is given by the vector between the PV and decay vertex. The distribution of q2 as a function of the four-body invariant mass for the B0
candidates is shown in figure 2 for both muon and electron final states. The requirements on the neural-network classifier and mcorr (see section 5) are not applied. In each plot,
the contributions due to the charmonium resonances are clearly visible at the J/ψ and ψ(2S) masses. For electrons, these distributions visibly extend above the nominal mass values due to the calorimeter resolution affecting the bremsstrahlung recovery procedure
] 2 c ) [MeV/ − µ + µ − π + K ( m 4500 5000 5500 6000 ] 4 c/ 2 [GeV 2 q 0 2 4 6 8 10 12 14 16 18 20 1 10 2 10 3 10 4 10 LHCb ] 2 c ) [MeV/ − e + e − π + K ( m 4500 5000 5500 6000 ] 4 c/ 2 [GeV 2 q 0 2 4 6 8 10 12 14 16 18 20 1 10 2 10 LHCb
Figure 2: Number of candidates for B0→ K∗0`+`− final states with (left) muons and (right) electrons as a function of the dilepton invariant mass squared, q2, and the four-body invariant mass of the B0.
(see section 3). The empty region in the top left corresponds to the kinematic limit of the B0→ K∗0`+`− decay, while the empty region in the top right corresponds to the
requirement that rejects the B+→ K+`+`− background (see section 6).
The B0 mass resolution and the contributions of signal and backgrounds depend on
the way in which the event was triggered. The data sample of decay modes involving an e+e− pair is therefore divided into three mutually exclusive categories, which in order of
precedence are: candidates for which one of the electrons from the B0 decay satisfies the
hardware electron trigger (L0E), candidates for which one of the hadrons from the K∗0
decay meets the hardware hadron trigger (L0H) requirements, and candidates triggered by activity in the event not associated with any of the signal decay particles (L0I). For B0→ K∗0µ+µ− candidates, at least one of the two leptons must satisfy the requirements
of the hardware muon trigger.
For the B0→ K∗0J/ψ (→ µ+µ−) decay mode, a dimuon mass interval within 100 MeV/c2
of the known J/ψ mass is selected to identify candidates. It is not possible to apply a tight q2 requirement to identify the B0→ K∗0J/ψ (
→ e+e−) mode as, despite the bremsstrahlung
recovery, the e+e− invariant mass distribution has a long radiative tail towards low values.
This tail can be seen in figure 2. The q2 interval used to select B0→ K∗0J/ψ (
→ e+e−)
candidates is between 6.0 and 11.0 GeV2/c4, with the lower limit corresponding to the
upper boundary of the central-q2 bin.
The separation of the signal from the combinatorial background is based on neural-network classifiers [47]. The same classifier is used for the resonant and nonresonant modes, but muon and electron channels are treated separately. The classifiers are trained using simulated B0→ K∗0`+`− decays, which have been corrected for known differences
between data and simulation (see section 4), to represent the signal. Data candidates with K+π−`+`− invariant masses larger than 5400 MeV/c2 and 5600 MeV/c2 are used
to represent background samples for the muon and electron channel, respectively. To best exploit the size of the available data sample for the training procedure, a k-folding technique [46] is adopted with k = 10. The variables used as input to the classifiers are: the transverse momentum, the quality of the vertex fit, the χ2
IP, the χ2VD (the χ2 on the
measured distance between the PV and the decay vertex), and the angle between the direction of flight and the momentum of the B0 candidate, the K+π− and the dilepton
pairs; the minimum and maximum of the kaon and pion pT, and of their χ2IP; the minimum
and maximum of the lepton pTvalues, and of their χ2IP; and finally, the most discriminating
variable, the quality of the kinematic fit to the decay chain (this fit is performed with a constraint on the vertex that requires the B0 candidate to originate from the PV). In each
fold, only variables that significantly improve the discriminating power of the classifier are kept.
For the muon modes, a requirement on the four-body invariant mass of the B0candidate
to be larger than 5150 MeV/c2 excludes backgrounds due to partially reconstructed decays,
B→ K∗0µ+µ−X, where one or more of the products of the B decay, denoted as X, are not
reconstructed. A kinematic fit that constrains the dielectron mass to the known J/ψ mass allows the corresponding background to be separated from the B0→ K∗0J/ψ (
→ e+e−)
signal by requiring the resulting four-body invariant mass to be at least 5150 MeV/c2. For
the nonresonant electron mode, the partially reconstructed backgrounds can be reduced by exploiting the kinematics of the decay. The ratio of the K∗0 and the dielectron
momentum components transverse to the B0 direction of flight is expected to be unity,
unless the electrons have lost some energy due to bremsstrahlung that was not recovered (see figure 3). In the approximation that bremsstrahlung photons do not modify the dielectron direction significantly, which is particularly valid for low dilepton masses, this ratio can be used to correct the momentum of the dielectron pair. The invariant mass of the signal candidate calculated using the corrected dielectron momentum, mcorr, has
a poor resolution that depends on χ2
VD. Nevertheless, since the missing momentum of
background candidates does not originate from the dielectron pair, mcorr still acts as a
useful discriminating variable. Signal and partially reconstructed backgrounds populate different regions of the two-dimensional plane defined by mcorr and χ2VD (see figure 4).
The requirements in this plane and on the classifier response are optimised simultaneously, but separately for each q2 region. The optimisation maximises a figure of merit defined as
NS/
√
NS+ NB, where the expected signal yield, NS, is evaluated by scaling the observed
number of B0→ K∗0J/ψ (→ `+`−) candidates by the ratio of the branching fractions of
the nonresonant and resonant modes, and the expected background yield, NB, is obtained
by fitting the mass sidebands in data.
After the full selection, 1 to 2% of the events contain multiple candidates. This fraction is consistent between the resonant and nonresonant modes, and between final states with electrons and muons. About half of the multiple candidates are due to cases where the kaon is misidentified as the pion and vice versa. In all cases only one candidate, chosen randomly, is retained.
6
Exclusive backgrounds
Specific requirements are applied to reject backgrounds from b-hadron decays, while ensuring a negligible loss of signal, as verified using simulation. In the low-q2 region, the
size of the contamination from B0→ K∗0V (→ `+`−) decays, where V is a ρ, ω or φ meson,
is evaluated in Refs. [48, 49]. The contamination due to direct decays or interference with the signal channel is found to be smaller than 2% and similar for muons and electrons. As a consequence, the residual effect in the double ratio is expected to be very small and can therefore be safely neglected.
Misreconstructed B0→ K∗0J/ψ (
→ µ+µ−) and B0→ K∗0ψ(2S)(
Primary Vertex B 0Vertex p^ ( e +e −) p^ (K *0) B0Direction of Flight p^ ( g )
Figure 3: Sketch of the topology of a B0→ K∗0e+e− decay. The transverse momentum lost via bremsstrahlung is evaluated as the difference between the pT of the K∗0 meson and that of the dielectron system, where both are calculated with respect to the B0 meson direction of flight. Bremsstrahlung photons that are not recovered by the reconstruction are assumed to follow the dielectron momentum direction.
] 2 c ) [MeV/ − e + e − π + K ( corr m 2000 4000 6000 8000 ) VD 2 χ ln( 4 6 8 10 12 14 16 5 − 10 4 − 10 3 − 10 LHCb ] 2 c ) [MeV/ − e + e − π + K ( corr m 2000 4000 6000 8000 ) VD 2 χ ln( 4 6 8 10 12 14 16 5 − 10 4 − 10 3 − 10 LHCb
Figure 4: Distribution of χ2VD as a function of mcorr for (left) B0→ K∗0e+e− and (right) B→ X(→ Y K∗0)e+e− simulated candidates. The distributions are normalised to the same number of candidates.
contaminate the signal region if the identities of one of the hadrons and one of the muons are swapped. To avoid this, the invariant mass of the hadron candidate (under the muon mass hypothesis) and the oppositely charged muon is required to be outside of a 60 MeV/c2
interval around the known J/ψ or the ψ(2S) masses.
A large, nonpeaking background comes from the B0→ D−`+ν decay, with
D−→ K∗0`−ν, which has a branching fraction four orders of magnitude larger than
that of the signal. In the rare case where both neutrinos have low energies, the signal selec-tion will be less effective at rejecting this background. This decay can be separated from the signal by exploiting the angular distribution of the dilepton pair. For B0→ D−`+ν
decays, the angle θ` between the direction of the `+ in the dilepton rest frame and the
direction of the dilepton in the B0 rest frame tends to be small. This background is
suppressed by requiring | cos θ`| < 0.8.
When combined with a low-momentum π− meson from the rest of the event,
region that is used to represent the combinatorial background for the training of the neural-network classifiers. Such decays are vetoed by requiring the invariant mass of the K+`+`− combination to be less than 5100 MeV/c2. Candidates where the π− from the
K∗0 is misidentified as a kaon and paired with a π+ are similarly rejected. To suppress
background from B0
s→ φ`+`
− decays, with φ
→ K+K− where one of the kaons is
misiden-tified as a pion, the invariant mass of the two hadrons computed under the K+K− mass
hypothesis is required to be larger than 1040 MeV/c2.
7
Fits to the K
+π
−`
+`
−invariant mass distributions
The signal yields are determined using unbinned extended maximum likelihood fits to the four-body invariant mass, m(K+π−`+`−), of the selected candidates in each q2 interval
and for each lepton type. The reconstructed invariant mass is calculated using a kinematic fit with a constraint on the vertex that requires the B0 candidate to originate from the
PV. In order to improve the quality and stability of the results, the fits are performed simultaneously on the nonresonant and resonant modes, and some parameters are shared.
For the muon channel, the fit is performed in an invariant mass window of 5150–5850 MeV/c2. The low edge is chosen to reject the partially reconstructed
back-ground that populates the low mass region. The probability density function (PDF) for the signal is defined by a Hypatia function [50], where the parameters are fixed from simulation. However, in order to account for possible residual discrepancies with data, the mean and width are allowed to vary freely in the fit, independently for the resonant and nonresonant modes and in each q2 region. The combinatorial background is parameterised
using an exponential function, which has a different slope in the resonant and nonresonant modes, and in each q2 region, that is free to vary in the fit. For the resonant mode, two
additional sources of background are included: Λ0
b→ K+pJ/ψ (→ µ+µ
−) decays, where
the p candidate is misidentified as a π− meson, and B0
s→ K
∗0
J/ψ (→ µ+µ−
) decays. The former are described using a kernel estimation technique [51] applied to simulated events for which the K+π− invariant mass distribution has been matched to data from Ref. [52].
The latter are modelled using the same PDF as for the signal, but with the mean value shifted by the known difference between the B0 and the B0
s masses. The equivalent
backgrounds to the nonresonant mode are found to be negligible.
For the electron channel, due to the limited resolution on the K+π−e+e− invariant
mass, a wider window of 4500–6200 MeV/c2 is used. The resolution on the reconstructed
invariant mass of the B0and the background composition depends on the kinematics of the
decay, as well as on the trigger category. For this reason, simultaneous fits to the four-body invariant mass of the B0→ K∗0J/ψ (
→ e+e−) and B0→ K∗0e+e− channels are performed
separately in the three trigger categories. Following the strategy of Ref. [6], the K+π−e+e−
signal PDF is observed to depend on the number of calorimeter clusters that are added to the dielectron candidate in order to correct for the effects of bremsstrahlung. Three bremsstrahlung categories are considered, depending on whether zero, one or more clusters are recovered. The PDF is described by the sum of a Crystal Ball function [53] (CB) and a wide Gaussian function. The CB function accounts for FSR and bremsstrahlung that is not fully recovered, and corresponds to over 90% of the total signal PDF. Cases where bremsstrahlung clusters were incorrectly associated are accounted for by the Gaussian function. The shape parameters and the fraction of candidates in each bremsstrahlung
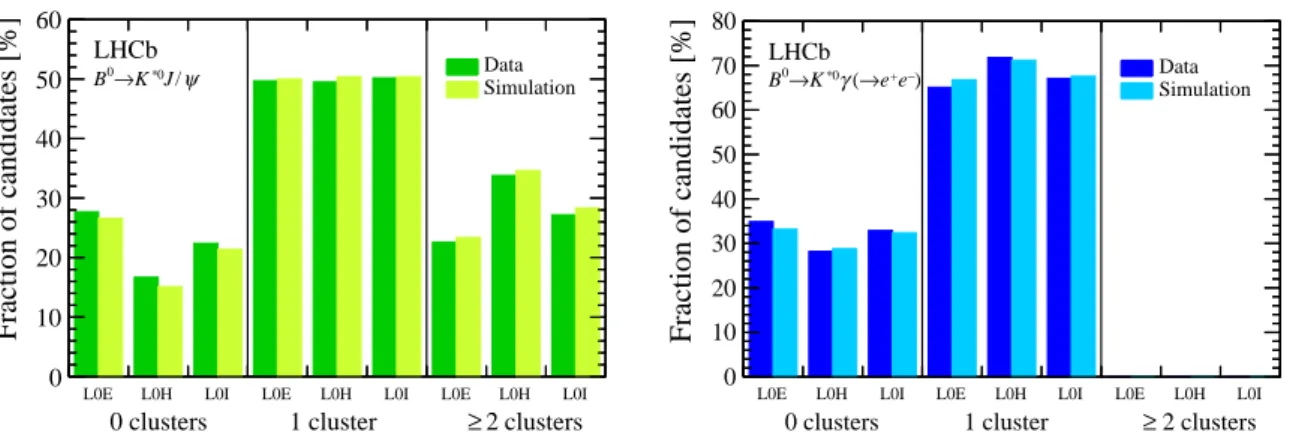
L0E L0H L0I L0E L0H L0I L0E L0H L0I Fraction of candidates [%] 0 10 20 30 40 50 60
0 clusters 1 cluster ≥2 clusters LHCb ψ / J 0 * K → 0 B DataSimulation
L0E L0H L0I L0E L0H L0I L0E L0H L0I
Fraction of candidates [%] 0 10 20 30 40 50 60 70 80
0 clusters 1 cluster ≥ 2 clusters LHCb ) − e + e → ( γ 0 * K → 0 B DataSimulation
Figure 5: Fraction of (left) B0→ K∗0J/ψ (→ e+e−) and (right) B0→ K∗0γ(→ e+e−) candidates (in percent) with zero, one, and two or more recovered clusters per trigger category. The numbers are from (darker colour) data and (lighter colour) simulation. Due to the very low opening angle of the two electrons in B0→ K∗0γ(→ e+e−) decays, the bremsstrahlung photon energy deposits overlap and only one bremsstrahlung cluster at most is resolved.
category are taken from simulation, the latter having been checked on data control channels (see figure 5). In order to account for possible data-simulation discrepancies, the mean (width) of the PDF for each trigger category is allowed to shift (scale). These shift and scale factors are common between the nonresonant and resonant PDFs. An additional scale factor is also applied to the parameter describing the tail of the CB functions. The combinatorial background is described by an exponential function with different slope parameters for the resonant and nonresonant modes, and in each trigger category and q2
region, that are free to vary in the fit. The shape of the partially reconstructed hadronic background, B→ X(→ Y K∗0)e+e− (where the decay product Y is not reconstructed), is
obtained from simulation using a sample that includes decays of higher kaon resonances, X, such as K+
1 (1270) and K ∗+
2 (1430). The mass distribution is modelled using a kernel
estimation technique separately in each trigger category and q2 region. The fraction
of this background is free to vary in both q2 intervals. Due to the requirement on the
four-body invariant mass with a J/ψ mass constraint (see section 5), there is no partially reconstructed background left to contaminate B0→ K∗0J/ψ (→ e+e−) candidates. Due to
the long radiative tail of the dielectron invariant mass, B0→ K∗0J/ψ (→ e+e−) decays can
contaminate the central-q2 region and an additional background component is considered
(see figure 2), however this contribution does not peak at the nominal B0 mass. The
distribution is modelled using simulated events, while the normalisation is constrained using a mixture of data and simulation. The contributions to the resonant modes from Λ0
b→ K+pJ/ψ (→ e+e
−) and B0
s→ K∗0J/ψ (→ e+e−) decays are treated following the same
procedure as for the muon channel. The normalisations are fixed to the yields returned by the muon fit after correcting for efficiency differences between the two final states.
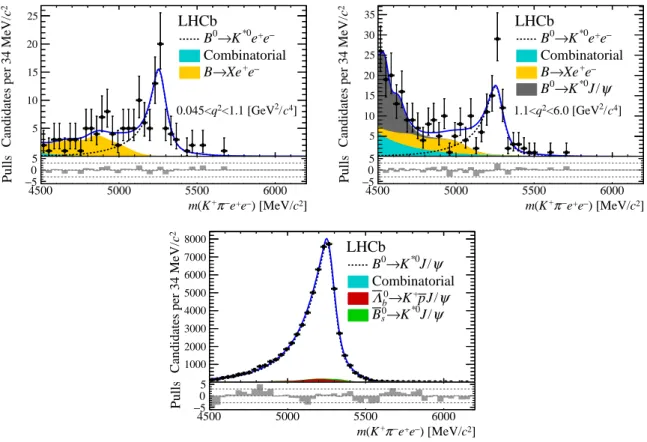
The results of the fits to the muon channels are shown in figure 6, while figure 7 displays the fit results for the electron channels, where the three trigger categories have been combined. The distribution of the normalised fit residuals of the B0→ K∗0J/ψ (
→ µ+µ−)
mode shows an imperfect description of the combinatorial background at high mass values, although the effect on the signal yield is negligible. The resulting yields are listed in table 2.
] 2 c ) [MeV/ − µ + µ − π + K ( m 5200 5400 5600 5800 2 c
Candidates per 10 MeV/ 10 20 30 40 50 60 70 80 90 LHCb − µ + µ 0 * K → 0 B Combinatorial ] 4 c / 2 <1.1 [GeV 2 q 0.045< ] 2 c ) [MeV/ − µ + µ − π + K ( m 5200 5400 5600 5800 Pulls −5 0 5 5 ] 2 c ) [MeV/ − µ + µ − π + K ( m 5200 5400 5600 5800 2 c
Candidates per 10 MeV/ 10
20 30 40 50 60 70 80 LHCb − µ + µ 0 * K → 0 B Combinatorial ] 4 c / 2 <6.0 [GeV 2 q 1.1< ] 2 c ) [MeV/ − µ + µ − π + K ( m 5200 5400 5600 5800 Pulls −5 0 5 5 ] 2 c ) [MeV/ − µ + µ − π + K ( m 5200 5400 5600 5800 2 c
Candidates per 10 MeV/ 10
20 30 40 50 60 3 10 × LHCb ψ / J 0 * K → 0 B Combinatorial ψ / J p + K → 0 b Λ ψ / J 0 * K → 0 s B ] 2 c ) [MeV/ − µ + µ − π + K ( m 5200 5400 5600 5800 Pulls −5 0 5 5
Figure 6: Fit to the m(K+π−µ+µ−) invariant mass of (top) B0→ K∗0µ+µ− in the low- and central-q2 bins and (bottom) B0→ K∗0J/ψ (→ µ+µ−) candidates. The dashed line is the signal PDF, the shaded shapes are the background PDFs and the solid line is the total PDF. The fit residuals normalised to the data uncertainty are shown at the bottom of each distribution.
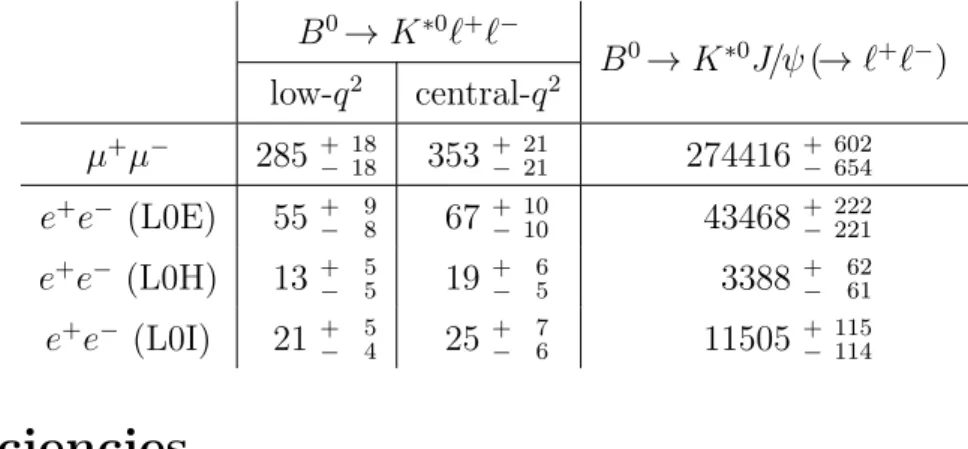
Table 2: Yields obtained from the mass fits to the muon and electron (in the three trigger categories) channels. The uncertainties are statistical only.
B0→ K∗0`+`− B0→ K∗0J/ψ ( → `+`−) low-q2 central-q2 µ+µ− 285 + 18 − 18 353 + 21− 21 274416+ 602− 654 e+e− (L0E) 55 + 9 − 8 67 + 10 − 10 43468 + 222− 221 e+e− (L0H) 13 + 5 − 5 19 + 6 − 5 3388 + 62 − 61 e+e− (L0I) 21 + 5 − 4 25 + 7 − 6 11505 + 115 − 114
8
Efficiencies
The efficiency for selecting each decay mode is defined as the product of the efficiencies of the geometrical acceptance of the detector, the complete reconstruction of all tracks, the trigger requirements and the full set of kinematic, PID and background rejection requirements. All efficiencies are determined using simulation that is tuned to data, as described in section 4, and account for bin migration in q2 due to resolution, FSR and
] 2 c ) [MeV/ − e + e − π + K ( m 4500 5000 5500 6000 2 c
Candidates per 34 MeV/ −2
10
1 −10
1
10
LHCb Signal Combinatorial − e + Xe → 0 B ] 2 c ) [MeV/ − e + e − π + K ( m 4500 5000 5500 6000 2 cCandidates per 34 MeV/
5 10 15 20 25 LHCb − e + e 0 * K → 0 B Combinatorial − e + Xe → B ] 4 c / 2 <1.1 [GeV 2 q 0.045< ] 2 c ) [MeV/ − e + e − π + K ( m 4500 5000 5500 6000 Pulls −5 0 5 5 ] 2 c ) [MeV/ − e + e − π + K ( m 4500 5000 5500 6000 2 c
Candidates per 34 MeV/ −2
10
1 −10
1
10
LHCbSignal Combinatorial ee ) 0 * YK → ( X → 0 B ee) → ( ψ / J 0 * K → 0 B ] 2 c ) [MeV/ − e + e − π + K ( m 4500 5000 5500 6000 2 cCandidates per 34 MeV/ 5
10 15 20 25 30 35 LHCb − e + e 0 * K → 0 B Combinatorial − e + Xe → B ψ / J 0 * K → 0 B ] 4 c / 2 <6.0 [GeV 2 q 1.1< ] 2 c ) [MeV/ − e + e − π + K ( m 4500 5000 5500 6000 Pulls −5 0 5 5 ] 2 c ) [MeV/ − e + e − π + K ( m 4500 5000 5500 6000 2 c
Candidates per 34 MeV/ −2
10
1 −10
1
10
210
310
LHCb ψ / J 0 * K → 0 B Combinatorial ψ / J p + K → 0 b Λ ψ / J 0 * K → 0 s B ] 2 c ) [MeV/ − e + e − π + K ( m 4500 5000 5500 6000 2 cCandidates per 34 MeV/1000
2000 3000 4000 5000 6000 7000 8000 LHCb ψ / J 0 * K → 0 B Combinatorial ψ / J p + K → 0 b Λ ψ / J 0 * K → 0 s B ] 2 c ) [MeV/ − e + e − π + K ( m 4500 5000 5500 6000 Pulls −5 0 5 5
Figure 7: Fit to the m(K+π−e+e−) invariant mass of (top) B0→ K∗0e+e− in the low- and central-q2 bins and (bottom) B0→ K∗0J/ψ (→ e+e−) candidates. The dashed line is the signal PDF, the shaded shapes are the background PDFs and the solid line is the total PDF. The fit residuals normalised to the data uncertainty are shown at the bottom of each distribution.
the low- and central-q2 regions, respectively.
The efficiency ratios between the nonresonant and the resonant modes, ε`+`−/εJ/ψ (`+`−),
which directly enter in the RK∗0 measurement, are reported in table 3. Besides a
depen-dence on the kinematics, the difference between the ratios in the two q2 regions is almost
entirely due to the different requirement on the neural-network classifier. The relative fraction of the electron trigger categories is checked using simulation to depend on q2 as
expected: the fraction of L0E decreases when decreasing in q2, while L0H increases; on
the other hand, the fraction of L0I only mildly depends on q2.
9
Cross-checks
A large number of cross-checks were performed before unblinding the result. The control of the absolute scale of the efficiencies is tested by measuring the ratio of the branching fractions of the muon and electron resonant channels
rJ/ψ = B(B
0→ K∗0J/ψ (
→ µ+µ−))
B(B0→ K∗0J/ψ (→ e+e−)) ,
which is expected to be equal to unity. This quantity represents an extremely stringent test, as it does not benefit from the large cancellation of the experimental systematic
Table 3: Efficiency ratios between the nonresonant and resonant modes, ε`+`−/εJ/ψ (`+`−), for the muon and electron (in the three trigger categories) channels. The uncertainties are statistical only. ε`+`−/εJ/ψ (`+`−) low-q2 central-q2 µ+µ− 0.679± 0.009 0.584 ± 0.006 e+e− (L0E) 0.539± 0.013 0.522 ± 0.010 e+e− (L0H) 2.252 ± 0.098 1.627 ± 0.066 e+e− (L0I) 0.789 ± 0.029 0.595 ± 0.020
effects provided by the double ratio. The rJ/ψ ratio is measured to be 1.043± 0.006 ± 0.045,
where the first uncertainty is statistical and the second systematic. The same sources of systematic uncertainties as in the RK∗0 measurement are considered (see section 10). The
result, which is in good agreement with unity, is observed to be compatible with being independent of the decay kinematics, such as pT and η of the B0 candidate and final-state
particles, and the charged-track multiplicity in the event.
The extent of the cancellation of residual systematics in RK∗0 is verified by
measur-ing a double ratio, Rψ(2S), where B0→ K∗0ψ(2S)(→ `+`−) decays are used in place of
B0→ K∗0`+`−. The R
ψ(2S) ratio, measured with a statistical precision of about 2%, is
found to be compatible with unity within one standard deviation.
The branching fraction of the decay B0→ K∗0µ+µ− is measured and found to be in
good agreement with Ref. [25]. Furthermore, the branching fraction of the B0→ K∗0γ
decay, where decays with a photon conversion are used, is determined with a statistical precision of about 7% and is observed to be in agreement with the expectation within two standard deviations. The B0→ K∗0γ(→ e+e−) selection and determination of the signal
yield closely follows that of the B0→ K∗0e+e− decay.
If no correction is made to the simulation, the ratio of the efficiencies changes by less than 5%. The relative population of the three bremsstrahlung categories is compared between data and simulation using both B0→ K∗0J/ψ (
→ e+e−) and B0→ K∗0γ(
→ e+e−)
candidates to test possible q2 dependence of the modelling. Good agreement is observed,
as shown in figure 5.
The sPlot technique [54], where m(K+π−`+`−) is used as the discriminating variable,
is adopted to subtract statistically the background from the B0→ K∗0`+`− selected data,
and test the agreement between muons and electrons, data and simulation, using several control quantities (see figure 8): the q2 distributions show good agreement in both q2
regions; a clear K∗0 peak is visible in the K+π− invariant mass distributions, and the
muon and electron channels show good agreement; while the distribution of the opening angle between the two leptons in the central-q2 region are very similar between the muon
and electron channels, this is not the case at low-q2 due to the difference in lepton masses;
the distribution of the distance between the K+π− and `+`− vertices shows that the pairs
] 4 c / 2 [GeV 2 q 0.5 1 Fraction of candidates [%] 0 0.1 0.2 0.3 0.4 0.5 LHCb − µ + µ 0 * K → 0 B Data Simulation − e + e 0 * K → 0 B Data Simulation ] 4 c / 2 <1.1 [GeV 2 q 0.045< ] 4 c / 2 [GeV 2 q 2 3 4 5 6 Fraction of candidates [%] 0 0.05 0.1 0.15 0.2 0.25 0.3 0.35 0.4 LHCb − µ + µ 0 * K → 0 B Data Simulation − e + e 0 * K → 0 B Data Simulation ] 4 c / 2 <6.0 [GeV 2 q 1.1< ] 2 c ) [MeV/ − π + K ( m 800 850 900 950 Fraction of candidates [%] 0 0.1 0.2 0.3 0.4 0.5 LHCb − µ + µ 0 * K → 0 B Data Simulation − e + e 0 * K → 0 B Data Simulation ] 4 c / 2 <1.1 [GeV 2 q 0.045< ] 2 c ) [MeV/ − π + K ( m 800 850 900 950 Fraction of candidates [%] 0 0.05 0.1 0.15 0.2 0.25 0.3 0.35 0.4 0.45 0.5 LHCb − µ + µ 0 * K → 0 B Data Simulation − e + e 0 * K → 0 B Data Simulation ] 4 c / 2 <6.0 [GeV 2 q 1.1< [mrad] lepton θ 0 0.02 0.04 0.06 0.08 0.1 Fraction of candidates [%] 0 0.1 0.2 0.3 0.4 0.5 0.6 LHCb − µ + µ 0 * K → 0 B Data Simulation − e + e 0 * K → 0 B Data Simulation ] 4 c / 2 <1.1 [GeV 2 q 0.045< [mrad] lepton θ 0 0.05 0.1 0.15 0.2 Fraction of candidates [%] 0 0.05 0.1 0.15 0.2 0.25 0.3 0.35 0.4 0.45 0.5 LHCb − µ + µ 0 * K → 0 B Data Simulation − e + e 0 * K → 0 B Data Simulation ] 4 c / 2 <6.0 [GeV 2 q 1.1< [mm] vertex z ∆ 10 − −5 0 5 10 Fraction of candidates [%] 0 0.1 0.2 0.3 0.4 0.5 0.6 0.7 LHCb − µ + µ 0 * K → 0 B Data Simulation − e + e 0 * K → 0 B Data Simulation ] 4 c / 2 <1.1 [GeV 2 q 0.045< [mm] vertex z ∆ 10 − −5 0 5 10 Fraction of candidates [%] 0 0.1 0.2 0.3 0.4 0.5 0.6 0.7 0.8 LHCb − µ + µ 0 * K → 0 B Data Simulation − e + e 0 * K → 0 B Data Simulation ] 4 c / 2 <6.0 [GeV 2 q 1.1<
Figure 8: (hatched) Background-subtracted distributions for (darker colour) B0→ K∗0µ+µ− and (lighter colour) B0→ K∗0e+e− candidates, compared to (full line) simulation. From top to bottom: q2, K+π− invariant mass, m(K+π−), opening angle between the two leptons, θlepton, and projection along the beam axis of the distance between the K+π− and `+`− vertices,
∆zvertex. The distributions are normalised to unity. The hatched areas correspond to the
Table 4: Systematic uncertainties on the RK∗0 ratio for the three trigger categories separately (in percent). The total uncertainty is the sum in quadrature of all the contributions.
∆RK∗0/RK∗0 [%]
low-q2 central-q2
Trigger category L0E L0H L0I L0E L0H L0I Corrections to simulation 2.5 4.8 3.9 2.2 4.2 3.4 Trigger 0.1 1.2 0.1 0.2 0.8 0.2 PID 0.2 0.4 0.3 0.2 1.0 0.5 Kinematic selection 2.1 2.1 2.1 2.1 2.1 2.1 Residual background – – – 5.0 5.0 5.0 Mass fits 1.4 2.1 2.5 2.0 0.9 1.0 Bin migration 1.0 1.0 1.0 1.6 1.6 1.6 rJ/ψ ratio 1.6 1.4 1.7 0.7 2.1 0.7 Total 4.0 6.1 5.5 6.4 7.5 6.7
10
Systematic uncertainties
Since RK∗0 is measured as a double ratio, many potential sources of systematic uncertainty
cancel. The remaining systematics and their effects on RK∗0 are summarised in table 4
and are described below.
Corrections to simulation: the uncertainty induced by the limited size of the simulated sample used to compute the efficiencies is considered; an additional systematic uncertainty is determined using binned corrections instead of interpolated ones; finally, since the data samples used to determine the corrections have a limited size, particularly for the electron hardware trigger, a systematic uncertainty is assessed with a bootstrapping technique [55].
Trigger efficiency: for the hardware triggers, the corrections to the simulation are determined using different control samples and the change in the result is assigned as a systematic uncertainty; for the software trigger, the corrections to the simula-tion do not show dependences on the kinematic of the decays, and therefore only the statistical uncertainty on the overall correction is considered as a systematic uncertainty.
Particle identification: the particle identification response is calibrated using data; a systematic uncertainty due to the procedure and kinematic differences between these control samples and the signal modes is included; the effects due to the identification of leptons and hadrons are considered; however, discrepancies in the description of the latter are small and further cancel in the double ratio.
Kinematic selection: a systematic uncertainty due to the choice of the mass fit range and to the two-dimensional requirement on χ2 and m
by comparing the efficiencies in simulation and background-subtracted samples of B0→ K∗0J/ψ (
→ µ+µ−) or B0→ K∗0J/ψ (
→ e+e−) decays.
Residual background: background due to B0→ K∗0J/ψ (→ e+e−) decays where one of
the hadrons is misidentified as an electron and vice versa is studied; using simulation that is tuned to data (see section 4) this contribution is estimated to be small; however, a few candidates with one electron of the dilepton pair having a low probability to be genuine are observed in background subtracted data; a systematic uncertainty is assigned based on the distribution of the PID information of these candidates.
Mass fit: the systematic uncertainty due to the parameterisation of the signal invariant mass distributions is found to be negligible for the muon channel; for the elec-tron channel, the signal PDF is changed from the sum of a CB and a Gaussian function to the sum of two CB functions, where the mean parameter is shared and, additionally, the mass shift and the width scale factors are constrained using the B0→ K∗0γ(→ e+e−) decay mode instead of B0→ K∗0J/ψ (→ e+e−); the
rela-tive fractions of the three bremsstrahlung categories are measured in data using B0→ K∗0J/ψ (
→ e+e−) and the observed differences with respect to simulation are
used in the mass fit (see figure 5); for the backgrounds, a component that describes candidates where the hadron identities are swapped is added both to the muon and electron B0→ K∗0J/ψ (
→ `+`−) modes, and constrained to the expected values
observed in simulation; the kernel of the nonparametric models is also varied, as well as the mixture of the K+
1 (1270) and K ∗+
2 (1430) components that is constrained
using data [56]; the contributions to the systematic uncertainty from these sources are evaluated using pseudoexperiments that are generated with modified parameters and fitted with the PDFs used to fit the data.
Bin migration: for the electron channel, the degraded q2 resolution due to
bremsstrahlung emission causes a nonnegligible fraction of signal candidates to migrate in and out of the given q2 bin; the effect is included in the efficiency
determination, but introduces a small dependence on the shape of the differen-tial branching fraction that no longer perfectly cancels in the ratio to the muon channel; pseudoexperiments are generated, where the parameters modelling the dΓ(B0→ K∗0e+e−)/dq2 distribution are varied within their uncertainties [34]; the
maximum spread of the variation in RK∗0 is taken as a systematic uncertainty;
furthermore, the q2 resolution is smeared for differences between data and simulation
that are observed in the resonant mode.
rJ/ψ ratio: the ratio of the efficiency-corrected yield of the resonant modes (see section 9)
is expected to be unity to a very high precision; deviations from unity are therefore considered to be a sign of residual imperfections in the evaluation of the efficiencies; the rJ/ψ ratio is studied as a function of various event and kinematic properties of
the decay products, and the observed residual deviations from unity are used to assign a systematic uncertainty on RK∗0.
For the RK∗0 measurement, all the uncertainties are treated as uncorrelated among
*0 K R 0 0.5 1 1.5 2 ) best L ln − L (ln − 0 1 2 3 4 5 6 7 8 LHCb L0E L0H L0I Combined Comb. (stat) ] 4 c / 2 <1.1 [GeV 2 q 0.045< *0 K R 0 0.5 1 1.5 2 ) best L ln − L (ln − 0 1 2 3 4 5 6 7 8 LHCb L0E L0H L0I Combined Comb. (stat) ] 4 c / 2 <6.0 [GeV 2 q 1.1<
Figure 9: Distributions of the RK∗0 delta log-likelihood for the three trigger categories separately and combined.
selection criteria, to the residual background, to the fit to the invariant mass and to bin migration.
11
Results
The determination of RK∗0 exploits the log-likelihoods resulting from the fits to the
invariant mass distributions of the nonresonant and resonant channels in each trigger category and q2 region. Each log-likelihood is used to construct the PDF of the true
number of decays, which is used as a prior to obtain the PDF of RK∗0. The true number
of decays is assumed to have a uniform prior. The three electron trigger categories are combined by summing the corresponding log-likelihoods. Uncorrelated systematic uncertainties are accounted for by convolving the yield PDFs with a Gaussian distribution of appropriate width. Correlated systematic uncertainties are treated by convolving the RK∗0 PDF with a Gaussian distribution. The one, two and three standard deviation
intervals are determined as the ranges that include 68.3%, 95.4% and 99.7% of the PDF. In each q2 region, the measured values of R
K∗0 are found to be in good agreement among
the three electron trigger categories (see figure 9). The results are given in table 5 and presented in figure 10, where they are compared both to the SM predictions (see table 1) and to previous measurements from the B factories [4, 5].
The combined RK∗0 PDF is used to determine the compatibility with the SM
ex-pectations. The p-value, calculated by integrating the PDF above the expected value, is translated into a number of standard deviations. The compatibility with the SM expectations [26–35] is determined to be 2.1–2.3 and 2.4–2.5 standard deviations, for the low-q2 and the central-q2 regions, respectively, depending on the theory prediction used.
12
Conclusions
This paper reports a test of lepton universality performed by measuring the ratio of the branching fractions of the decays B0→ K∗0µ+µ− and B0→ K∗0e+e−. The K∗0 meson is
reconstructed in the final state K+π−, which is required to have an invariant mass within
Table 5: Measured RK∗0 ratios in the two q2 regions. The first uncertainties are statistical and the second are systematic. About 50% of the systematic uncertainty is correlated between the two q2 bins. The 95.4% and 99.7% confidence level (CL) intervals include both the statistical and systematic uncertainties.
low-q2 central-q2 RK∗0 0.66 + 0.11− 0.07± 0.03 0.69 + 0.11− 0.07± 0.05 95.4% CL [0.52, 0.89] [0.53, 0.94] 99.7% CL [0.45, 1.04] [0.46, 1.10] 0 1 2 3 4 5 6 q2[GeV2/c4] 0.0 0.2 0.4 0.6 0.8 1.0 RK ∗ 0 LHCb LHCb BIP CDHMV EOS flav.io JC 0 5 10 15 20 q2[GeV2/c4] 0.0 0.5 1.0 1.5 2.0 RK ∗ 0 LHCb LHCb BaBar Belle
Figure 10: (left) Comparison of the LHCb RK∗0 measurements with the SM theoretical predic-tions: BIP [26] CDHMV [27–29], EOS [30, 31], flav.io [32–34] and JC [35]. The predictions are displaced horizontally for presentation. (right) Comparison of the LHCb RK∗0 measurements with previous experimental results from the B factories [4, 5]. In the case of the B factories the specific vetoes for charmonium resonances are not represented.
of 3 fb−1 of pp collisions, recorded by the LHCb experiment during 2011 and 2012, are used. The RK∗0 ratio is measured in two regions of the dilepton invariant mass squared
to be
RK∗0 =
(
0.66 + 0.11
− 0.07(stat)± 0.03 (syst) for 0.045 < q2 < 1.1 GeV2/c4,
0.69 + 0.11
− 0.07(stat)± 0.05 (syst) for 1.1 < q2 < 6.0 GeV2/c4.
The corresponding 95.4% confidence level intervals are [0.52, 0.89] and [0.53, 0.94]. The results, which represent the most precise measurements of RK∗0 to date, are compatible
with the SM expectations [26–35] at 2.1–2.3 standard deviations for the low-q2 region
and 2.4–2.5 standard deviations for the central-q2 region, depending on the theoretical
prediction used.
Model-independent fits to the ensemble of FCNC data that allow for NP contribu-tions [27–35] lead to prediccontribu-tions for RK∗0 in the central-q2 region that are similar to the
value observed; smaller deviations are expected at low-q2. The larger data set currently
being accumulated by the LHCb collaboration will allow for more precise tests of these predictions.
Acknowledgements
We would like to thank F. Le Diberder for many interesting and helpful discussions on statistics. We express our gratitude to our colleagues in the CERN accelerator departments for the excellent performance of the LHC. We thank the technical and administrative staff at the LHCb institutes. We acknowledge support from CERN and from the national agencies: CAPES, CNPq, FAPERJ and FINEP (Brazil); MOST and NSFC (China); CNRS/IN2P3 (France); BMBF, DFG and MPG (Germany); INFN (Italy); NWO (The Netherlands); MNiSW and NCN (Poland); MEN/IFA (Romania); MinES and FASO (Russia); MinECo (Spain); SNSF and SER (Switzerland); NASU (Ukraine); STFC (United Kingdom); NSF (USA). We acknowledge the computing resources that are provided by CERN, IN2P3 (France), KIT and DESY (Germany), INFN (Italy), SURF (The Netherlands), PIC (Spain), GridPP (United Kingdom), RRCKI and Yandex LLC (Russia), CSCS (Switzerland), IFIN-HH (Romania), CBPF (Brazil), PL-GRID (Poland) and OSC (USA). We are indebted to the communities behind the multiple open source software packages on which we depend. Individual groups or members have received support from AvH Foundation (Germany), EPLANET, Marie Sk lodowska-Curie Actions and ERC (European Union), Conseil G´en´eral de Haute-Savoie, Labex ENIGMASS and OCEVU, R´egion Auvergne (France), RFBR and Yandex LLC (Russia), GVA, XuntaGal and GENCAT (Spain), Herchel Smith Fund, The Royal Society, Royal Commission for the Exhibition of 1851 and the Leverhulme Trust (United Kingdom).
References
[1] G. Hiller and F. Kr¨uger, More model-independent analysis of b → s processes, Phys. Rev. D69 (2004) 074020, arXiv:hep-ph/0310219.
[2] C. Bobeth, G. Hiller, and G. Piranishvili, Angular distributions of ¯B → ¯K ¯`` decays, JHEP 12 (2007) 040, arXiv:0709.4174.
[3] C. Bouchard et al., Standard Model predictions for B → K`+`− with form factors
from lattice QCD, Phys. Rev. Lett. 111 (2013) 162002, arXiv:1306.0434.
[4] BaBar collaboration, J. P. Lees et al., Measurement of branching fractions and rate asymmetries in the rare decays B → K(∗)`+`−, Phys. Rev. D86 (2012) 032012,
arXiv:1204.3933.
[5] Belle collaboration, J.-T. Wei et al., Measurement of the differential branching fraction and forward-backward asymmetry for B → K(∗)`+`−, Phys. Rev. Lett. 103 (2009)
171801, arXiv:0904.0770.
[6] LHCb collaboration, R. Aaij et al., Test of lepton universality using B+→ K+`+`−
decays, Phys. Rev. Lett. 113 (2014) 151601, arXiv:1406.6482.
[7] BaBar collaboration, B. Aubert et al., Measurements of the semileptonic decays B → Dl¯ν and B → D∗l¯ν using a global fit to DXl¯ν final states, Phys. Rev. D79
[8] Belle collaboration, M. Huschle et al., Measurement of the branching ratio of ¯B → D(∗)τ−ν¯
τ relative to ¯B → D(∗)`−ν¯` decays with hadronic tagging at Belle, Phys. Rev.
D92 (2015) 072014, arXiv:1507.03233.
[9] LHCb collaboration, R. Aaij et al., Measurement of the ratio of branching frac-tions B(B0 → D∗+τ−ν
τ)/B(B0 → D∗+µ−νµ), Phys. Rev. Lett. 115 (2015) 111803,
arXiv:1506.08614.
[10] LHCb collaboration, R. Aaij et al., Differential branching fractions and isospin asymmetries of B → K∗µ+µ− decays, JHEP 06 (2014) 133, arXiv:1403.8044.
[11] LHCb collaboration, R. Aaij et al., Angular analysis and differential branching fraction of the decay B0
s → φµ+µ
−, JHEP 09 (2015) 179, arXiv:1506.08777.
[12] LHCb collaboration, R. Aaij et al., Differential branching fraction and angular anaysis of Λ0
b → Λµ+µ− decays, JHEP 06 (2015) 115, arXiv:1503.07138.
[13] LHCb collaboration, R. Aaij et al., Angular analysis of the B0 → K∗0µ+µ− decay
using 3 fb−1 of integrated luminosity, JHEP 02 (2016) 104, arXiv:1512.04442. [14] Belle collaboration, S. Wehle et al., Lepton-flavor-dependent angular analysis of
B → K∗`+`−, Phys. Rev. Lett. 118 (2017) 111801, arXiv:1612.05014.
[15] S. Descotes-Genon, J. Matias, and J. Virto, Understanding the B → K∗µ+µ−anomaly,
Phys. Rev. D88 (2013) 074002, arXiv:1307.5683.
[16] R. Gauld, F. Goertz, and U. Haisch, An explicit Z0-boson explanation of the B → K∗µ+µ− anomaly, JHEP 01 (2014) 069, arXiv:1310.1082.
[17] A. J. Buras, F. De Fazio, J. Girrbach, and M. V. Carlucci, The anatomy of quark flavour observables in 331 models in the flavour precision era, JHEP 02 (2013) 023, arXiv:1211.1237.
[18] W. Altmannshofer and D. M. Straub, New physics in B → K∗µµ?, Eur. Phys. J.
C73 (2013) 2646, arXiv:1308.1501.
[19] W. Altmannshofer, S. Gori, M. Pospelov, and I. Yavin, Quark flavor transitions in Lµ− Lτ models, Phys. Rev. D89 (2014) 095033, arXiv:1403.1269.
[20] W. Altmannshofer, S. Gori, S. Profumo, and F. S. Queiroz, Explaining dark matter and B decay anomalies with an Lµ− Lτ model, JHEP 12 (2016) 106, arXiv:1609.04026.
[21] D. Beˇcirevi´c, S. Fajfer, N. Koˇsnik, and O. Sumensari, Leptoquark model to ex-plain the B-physics anomalies, RK and RD, Phys. Rev. D94 (2016) 115021,
arXiv:1608.08501.
[22] A. Crivellin, D. M¨uller, and T. Ota, Simultaneous explanation of R(D(∗)) and
b → sµ+µ−: the last scalar leptoquarks standing, arXiv:1703.09226.
[23] G. Hiller and M. Schmaltz, Diagnosing lepton-nonuniversality in b→ s``, JHEP 02 (2015) 055, arXiv:1411.4773.

![Table 1: Recent SM predictions for R K ∗0 . q 2 range [ GeV 2 /c 4 ] R SM K ∗0 References](https://thumb-eu.123doks.com/thumbv2/123doknet/14117778.467190/5.892.223.668.150.490/table-recent-sm-predictions-range-gev-sm-references.webp)