HAL Id: tel-01282457
https://tel.archives-ouvertes.fr/tel-01282457
Submitted on 3 Mar 2016HAL is a multi-disciplinary open access archive for the deposit and dissemination of sci-entific research documents, whether they are pub-lished or not. The documents may come from teaching and research institutions in France or abroad, or from public or private research centers.
L’archive ouverte pluridisciplinaire HAL, est destinée au dépôt et à la diffusion de documents scientifiques de niveau recherche, publiés ou non, émanant des établissements d’enseignement et de recherche français ou étrangers, des laboratoires publics ou privés.
Mariam Samir Ahmed
To cite this version:
Mariam Samir Ahmed. Relaxation-cycle power generation systems control optimization. Electric power. Université de Grenoble, 2014. English. �NNT : 2014GRENT019�. �tel-01282457�
Sp´ecialit´e: G´enie ´Electrique
Arrˆet´e minist´eriel : 7 aoˆut 2006
Pr´esent´ee par
Mariam Samir AHMED
Th`ese dirig´ee parProf. Seddik BACHA et
coencadr´ee parDr. Ahmad HABLY
pr´epar´ee au sein du
Grenoble G´enie ´Electrique Laboratoire (G2ELAB) En collaboration avec
Grenoble Images Parole Signal Automatique Laboratory (GIPSA-Lab) dans l’´Ecole Doctorale:Electronique, Electrotechnique, Automatique, T´el´ecommunication et Signal
Optimisation de Contrˆ
ole Commande des Syst`
emes
de G´
en´
eration d’´
Electricit´
e `
a Cycle de Relaxation
Th`ese soutenue publiquement le 28 F´evrier 2014, devant le jury compos´e de:
M. Brayima DAKYO
Professeur `a l’Universit´e du Havre, France, Pr´esident
M. Mohamed BENBOUZID
Professeur `a l’Universit´e de Brest, Rapporteur
M. Rachid OUTBIB
Professeur `a l’Universit´e d’Aix-Marseille, France, Rapporteur
M. Lorenzo FAGIANO
Scientist at ABB Corporate Research, Switzerland, Examinateur
M. Garrett SMITH
Pr´esident et COO de Cosmica Spacelines, Examinateur
M. Seddik BACHA
Professeur `a l’Universit´e Joseph Fourier, Directeur de th`ese
M. Ahmad HABLY
Three years of my life went by, three years that shaped a new future for me, a future I didn’t know is been waiting for me. More than a scientific research trip, these years were a journey full of emotions, happiness, stress, homesickness and love. The journey wouldn’t have end successfully without the support, directly or indirectly, of many people that I would like to thank here.
Firstly, I would like to thank the thesis jury members I was honored to have to help con-clude this work: Mr.Dakyo the president of the jury, and Mr.Benbouzid and Mr.Outbib for their feedback and proofreading of the manuscript. Also I would like to thank Mr.Fagiano for making part of the jury and offering his expertise in a the novel field of kite-based systems, as well as Mr.Smith for the passionate discussions on renewable energy we had. Back to 2010, For my master internship I was honored to work under the guidance of Professor Seddik BACHA, Professor Daniel Roye and Mathieu Hauk a PhD student at the time in the Electrical Engineering Laboratory G2ELAB. They introduced me to a very innovative interesting subject! Using Kites to generate electricity! I was completely concurred and when a PhD was proposed to continue on the same idea I jumped at the opportunity. I’m very grateful to having worked with M.Bacha et M.Ahmad Hably during my PhD, who I thank for their guidance and patience.
My gratitude goes to the staff of G2ELAB and GIPSA-Lab for the scientific friendly environment they offer, in addition to their help and guidance in the administration work. Further, I would like to thank M.G´erard Meunier for welcoming me and helping me join the Master 2R - G´enie Electrique in INP, as well as my master friends who helped me catch up with them (being 2 months late for the course), we spent a great time preparing for exams, eating and partying together: Ionela, Minh, Christina, Julian, Luiz, Lyubo, Soul, Loic, thanh, and Hai, thank you so much. I won’t talk about this period without having a thought for my friend Moustafa to whom I own my deepest gratitude, he helped me settle down in Grenoble and taught me about adminstration work, university system among other things. Thank you Moustafa for everything.
I spent a great year organizing activities in the lab, as well as the ZIK music group that was a relaxing escape during the hardest times. The thesis brought me also a great group of friends that I’m counting on keeping them forever: Nathalie, Raha, Angelina, Soulafa, Rachelle, Sinan, Antony, Bibi, and many other.
The best that the thesis has done was allowing me to meet my colombian soul mate Jos´e, something I wasn’t expecting at all when I first arrived to France. He was always there for me during both the happy and the sad moments. I would never be where I am now without you by my side. Thank you Josito for introducing me to your lovely family that I’m so proud to call mine.
My heart goes to my parents in Aleppo. My father who walked me, a little girl of five years old, and pointed stars to me and explain how the universe works in simple inspiring words. He would hand me over scientific books and teach me about electricity and statistics when I was eight. He implanted the passion for science in my heart and always encouraged me to follow this passion. Thank you mom for your encouragement and patience, I remember when I tried to help her with the house work she would always tell me to concentrate on my studies and that I ”will have the time to worry about these stuff later” even though she would have used some help being a working mom of four children, I wish to have half the energy you have when I become a mother. This work is dedicated to you dad and mom. Thank you my little brothers: Ahmad, Obada and Amr, for always supporting my decisions and enforcing my confidence by looking up to me and making me feel specially perfect for them.
Acknowledgment 5
List of Acronyms xi
List of Notations xiii
General Introduction 1
I Relaxation Cycle Renewable Energy Systems 3
I.1 Introduction . . . 5
I.2 Renewable Energy . . . 6
I.2.a Global Energy Situation and Expectations . . . 7
I.2.b Renewable Energy Evolution . . . 9
I.3 Wind Energy . . . 10
I.3.a Conversion Technologies . . . 11
I.3.a-i Wind Turbines . . . 11
I.3.a-ii High Altitude Wind Energy Technologies . . . 13
I.3.a-iii Comparison between Different Technologies . . . 14
I.3.b Flexible Power Kites . . . 15
I.3.b-i Crosswind Kite Power . . . 16
I.3.b-ii Energy Generation . . . 18
I.3.c Kite-based System vs Classic Wind Turbine . . . 21
I.4 Wave Energy . . . 22
I.4.a Wave Average Power . . . 23
I.4.b Wave Energy Conversion Technologies . . . 24
I.4.b-i Near-shore WEC Systems . . . 24
I.4.b-ii Off-shore WEC Systems . . . 25
I.4.b-iii Comparison between Different Technologies . . . 26
I.4.c Vertically Oscillating Point Absorber Systems . . . 27
I.4.c-i Wave Energy Extraction . . . 27
I.4.c-ii Energy Generation Concept. . . 28
I.5 Relaxation Cycle Systems . . . 29
I.5.a Kite-based System’s Relaxation Cycle . . . 31
I.5.b Heaving Point-Absorber’s Relaxation Cycle . . . 32
I.6 Problem Statement and Objectives . . . 33
II Relaxation Cycle Systems: Structure and Modeling 35
II.1 Introduction . . . 37
II.2 Kite Generator System . . . 37
II.2.a KGS Structure . . . 38
II.2.a-i The Kite . . . 38
II.2.a-ii Kite Orientation . . . 40
II.2.a-iii The Tethers . . . 41
II.2.b KGS Modeling . . . 41
II.2.b-i Kite Dynamics . . . 43
II.2.b-ii Machine Applied Traction. . . 46
II.2.c Wind Speed Estimation . . . 47
II.3 Heaving Point-Absorber System . . . 47
II.3.a HPS Structure . . . 48
II.3.b HPS Modeling . . . 49
II.3.b-i Hydrodynamics Study . . . 49
II.3.c Power Maximization Techniques . . . 52
II.3.c-i Optimal Amplitude Control. . . 52
II.3.c-ii Optimal Phase Control . . . 53
II.3.c-iii Reactive Control . . . 53
II.3.c-iv Comparison. . . 53
II.4 Conclusion . . . 56
IIIKite Generator System: Supervision 59 III.1 Introduction . . . 61
III.2 Nonlinear Model Predictive Controller . . . 62
III.2.a Methodology . . . 63
III.2.a-i Primary Orbit Choice . . . 63
III.2.a-ii Orbit Optimization . . . 64
III.2.a-iii Orbit Period . . . 65
III.2.a-iv NMPC Design . . . 66
III.2.b Application. . . 67
III.3 Virtual Constraints-based Controller . . . 71
III.3.a Methodology . . . 75
III.3.a-i KGS Under-actuated Model . . . 75
III.3.a-ii Reduced Dynamics system . . . 76
III.3.a-iii Partial feedback linearization . . . 78
III.3.a-iv Controller Design . . . 79
III.3.b Application. . . 80
III.4 Conclusion . . . 83
IV Kite Generator System: Grid Integration and Validation 85 IV.1 Introduction . . . 87
IV.2 Power Transformation System . . . 87
IV.2.a Torque Transmission between the Kite and the PMSM . . . 88
IV.2.c Power Electronics Interface. . . 89
IV.3 Control Scheme . . . 90
IV.3.a Grid-connected operation . . . 91
IV.3.a-i Low Level Control . . . 91
IV.3.a-ii Intermediate Level Control . . . 92
IV.3.a-iii High Level Control. . . 93
IV.3.a-iv Maximum Power Cycle Tracking . . . 94
IV.3.b Stand-alone Operation . . . 95
IV.4 KGS Control Validation . . . 96
IV.4.a Real-time Hybrid Simulation Systems . . . 97
IV.4.b Power Hardware In the Loop Simulator . . . 97
IV.4.c KGS Implementation on the PHIL Simulator . . . 98
IV.4.c-i KGS Scaling . . . 98
IV.4.c-ii KGS Torque Emulation . . . 99
IV.4.c-iii Experimental Set-up . . . 101
IV.4.d Validation . . . 102
IV.5 Conclusion . . . 106
General Conclusions 109 V R´esum´e Fran¸cais 111 V.1 Introduction . . . 111
V.2 Histoire . . . 112
V.2.a Energie Eolienne . . . 113
V.2.b Energie Eolienne A´eroport´ee . . . 114
V.3 Syst`eme G´en´eratrice de Cerf-volant . . . 116
V.3.a Structure . . . 117
V.3.b Mod´elisation . . . 118
V.4 Optimisation et Contrˆole . . . 119
V.4.a Commande Pr´edictive . . . 119
V.4.b Les Contraintes Virtuelles . . . 121
V.5 Int´egration au R´eseaux . . . 126
V.5.a L’Interface de Transformation de Puissance . . . 126
V.5.b Validation . . . 128
V.6 Conclusion . . . 128
Bibliography 138
I.1 Norias on the Orontes river in Syria. . . 6
I.2 Important events in the history of energy. . . 6
I.3 CO2emissions evolution since 1965. . . 8
I.4 Energy production history and expectations. . . 8
I.5 Main renewable energy cumulative installed evolution between 1995 and 2012 (excluding hydro and bio-fuels). . . 9
I.6 Heron’s wind wheel used to supply an organ[Dra61]. . . 10
I.7 A 1.5-MW wind turbine installed in a wind farm[TRV07]. . . 11
I.8 Wind speed evolution with altitude above a flat open coast (γ = 0.4).. . . 12
I.9 Off-shore wind turbine for the great lakes in Ontario-Canada [Flo10]. . . 12
I.10 The balloon of Magenn Power Inc. . . 13
I.11 Airborne wind turbines Imagined by Joby energy . . . 13
I.12 Imagined laddermill of Delft University of Technology . . . 14
I.13 Wright brothers Glider 1900. . . 15
I.14 The Laddermill concept proposed by W.J. Ockels [MOS99]. . . 16
I.15 Airborne wind energy research and development activities by country and by group as shown in the Airborne Wind Energy book [ADS13]. . . 17
I.16 Refined crosswind law. . . 17
I.17 An example of the pumping mode. . . 19
I.18 An imagined Rotokite system used to pump water. . . 19
I.19 Closed-orbit mode.. . . 20
I.20 Simplified presentation of the carousel of Kite-GEN . . . 20
I.21 Wave energy annual potential (kW/m) [Atl]. . . 22
I.22 Regular wave parameters. . . 23
I.23 Power per meter front for a regular wave. . . 24
I.24 WAVEGEN simplified structure [BWF02]. . . 25
I.25 TAPCHAN: Tapered Channel wave energy. . . 25
I.26 PELAMIS wave energy system. . . 25
I.27 Wave Dragon simplified structure [TPK09]. . . 26
I.28 SEAREV basic principal [CBG05]. . . 26
I.29 Imagined CETO submerged farm[Car]. . . 27
I.30 A point-absorber system anchored to sea bed. . . 28
I.31 A stable limit cycle . . . 30
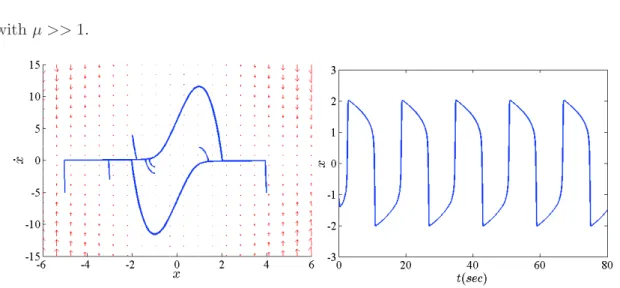
I.32 The relaxation limit cycle solution of the Van-der-Pol equation with µ = 4. . . 30
I.33 Example of power profile of a limit-cycle system. . . 31
I.34 The pumping wing [LJADH12].. . . 32
II.1 Kite generator system structure. . . 38
II.2 Kite’s main parameters and forces. . . 39
II.3 Multiple-kite proposed structures [HD06]. . . 40
II.4 The peter Lynn Bomba kite. . . 40
II.5 The kite power region. . . 41
II.6 Presentation of the kite’s multi-body model [WLRO08]. . . 42
II.7 Lumped mass tether model [WLO07a]. . . 43
II.8 Kite’s main forces. . . 44
II.9 Kite’s attached coordinates. . . 45
II.10Definition of ψ and η angles. . . 46
II.11The HPS simplified structure. . . 48
II.12The upper bound of the possible absorbed energy from a sinusoidal wave.. . . 49
II.13Cartesian coordinates linked to a floating body with 6 degrees of freedom. . . 50
II.14An irregular wave is the superposition of regular waves with random amplitudes and periods. 52 II.15Floating body parameters, added mass mr and radiation parameter Rr. . . 54
II.16The resulted excitation force as a function of the wave parameters. . . 54
II.17Comparing generated Power in the case of a regular wave (H = 1.25m, T = 6.5sec). . . . 55
II.18Jonswap spectrum of wave in Fig.II.14. . . 55
II.19Average power for regular (marked line) and irregular waves by applying reactive and optimal amplitude control. . . 56
II.20Absorbed energy without phase control (lower broken curve), with latching phase control (fully drawn curve) and with theoretically ideal optimum control (broken wavy curve). The curves show the wave energy (in joule) accumulated during 5 seconds. . . 56
III.1 Illustration of model predictive control output. . . 63
III.2 Initial orbit parameters. . . 64
III.3 NMPC-based control strategy. . . 67
III.4 Test orbits: Reference orbit (1) in continuous line, amplified orbits (2,3) in dotted line, and rotated orbits (4,5) in dashed line. . . 68
III.5 Normalized and time dependent radial velocity in upper and lower figure respectively. Reference orbit (1): continuous, orbit (2): dotted, orbit (3): dashed. . . 69
III.6 Normalized and time dependent radial velocity in upper and lower figure respectively. Reference orbit (1): continuous, orbit (4): dotted, orbit (5): dashed. . . 70
III.7 KGS energy generation. Reference orbit (1): continuous. Upper plot: orbit (2) energy profile in dotted line, orbit (3): dashed. Lower plot: orbit (4) energy profile in dotted line, orbit (5): dashed. . . 70
III.8 Starting from upper plot: The average mechanic power as a function of the kite surface A, the inclination angle θ0; and the orbit rotation Rot.. . . 71
III.9 Tracking orbit 1 using optimal predictive control . . . 71
III.10Some motion and balance control problems solved using VC. . . 72
III.11Example of a virtually constrained Two joint arm.. . . 73
III.12From the left: The indoors tethered-wing prototype of GIPSA-Lab and its representation. 75 III.13The reduced system periodic orbits.. . . 77
III.14Control block diagram. . . 79
III.16The partial linear system closed loop evolution. . . 81
III.17Evolution of state variables (θ, ˙θ, r, ˙r) of the KGS. . . 82
III.18The applied control for the studied KGS. . . 82
IV.1 Kite Generator System Block diagram. . . 88
IV.2 Modeling of the mechanic connection between the kite and the electrical machine. . . 88
IV.3 PMSM’s Behn-Eschenburg equivalent electrical model. . . 89
IV.4 Electric representation of the PMSM-side converter. PMSM is presented by Behn-Eschenburg model. Cdc is DC-bus filtering capacitor. . . 90
IV.5 Electric representation of the Grid-side converter. Rf and Lf represent loss and filtering components. . . 90
IV.6 General control scheme of the KGS power transformation system. Two control tracks applied depending whether the system is grid connected or in a stand-alone operation. . 91
IV.7 Low level control scheme for the machine-side converter. . . 92
IV.8 Low level control scheme for the grid-side converter. . . 93
IV.9 Intermediate level control scheme for the machine-side converter: Machine velocity control. 93 IV.10Intermediate level control scheme for the grid-side converter: DC-bus voltage control. . . 93
IV.11Optimal radial velocity as a function to time and wind speed. . . 94
IV.12Inserting the MPCT algorithm in the NMPC-based proposed control strategy. . . 95
IV.13Average output power of a 4-kite-based system. . . 95
IV.14Load-connected converter low level control scheme. . . 96
IV.15Machine-connected converter Intermediate level control scheme. . . 96
IV.16PHIL Simulator . . . 98
IV.17Representation of the Mechanic connection in the case of the KGS and the DCM. . . 100
IV.18KGS replication using the DCM. . . 100
IV.19KGS replication using the DCM. . . 101
IV.20KGS real-time test platform scheme. . . 101
IV.21KGS test bench control scheme. . . 102
IV.22Optimal normalized radial velocity. . . 103
IV.23Orbit Tracking using optimal predictive control. In green: Traction phase, in red: Recov-ery phase. . . 104
IV.24Application of MPCT algorithm on the rotation velocity when wind speed changes from 4 to 5m/s at instant 40sec. Upper plot: In dashed red, the optimization resulted rotation velocity, in continuous blue, the MPPT rotation velocity. Center plot: The resistive torque (CR), in dashed red, at wind speed 4m/sec, in continuous blue, at 5m/sec. Lower plot: The average mechanic power. . . 104
IV.25Starting from the upper plot: The PMSM rotation velocity (ΩS), PMSM phase current (IaS), DC bus voltage (UDC). . . 105
IV.26Starting from upper figure: Grid voltages, grid current (IaG), its frequency analysis.. . . 105
IV.27Starting from the upper plot: DCM torque (CDCM), PMSM rotation velocity (Ωs), PMSM phase current (Isa), and DC bus voltage (UDC). . . 106
IV.28Starting from the upper plot: PMSM rotation velocity (Ωs), grid phase current (Isa), and grid phase voltage (VGa). . . 107
IV.29Zoom into the grid voltage and current changes when the PMSM changes its rotation direction. . . 107
V.1 The HPS simplified structure. . . 112
V.2 Eolienne verticale `a Nishtafun en Iran (600 AD). . . 113
V.3 Consommation mondiale d’´energie par type de ressource. . . 113
V.4 Capacit´e install´ee mondiale. . . 114
V.5 Eolienne classique `a trois pales. . . 115
V.6 Vitesse de vent en fonction de l’altitude. . . 115
V.7 A gauche : Le prototype de Joby, `a droite : Le Makani M1 prototype. . . 116
V.8 A gauche : Un cerf-volant de SkySails , `a droite : Un prototype de KiteGen. . . 116
V.9 La g´en´eration d’´energie `a bord (Mode de train´ee) vs la g´en´eration d’´energie au sol (Mode de portance). . . 117
V.10Structure simplifi´ee de KGS. . . 117
V.11Les forces du cerf-volant. . . 119
V.12A gauche : l’angle de roulis, `a droite : l’angle d’attaque. . . 119
V.13Strat´egie de contrˆole utilisant la commande pr´edictive.. . . 120
V.14Initial orbit parameters. . . 120
V.15En haut : La puissance m´ecanique moyenne en fonction de l’angle d’inclination θ0, en bas : En fonction de la rotation d’orbite Rot. . . 121
V.16Orbite param´etriques de teste. . . 122
V.17La vitesse radial optimale correspondante.. . . 122
V.18KGS en mode pompage en deux dimensions. . . 123
V.19Diagramme de la m´ethodologie VCC. . . 123
V.20Le phase plot. . . 125
V.21D´eveloppement des variables du syst`eme. . . 125
V.22Evolution des variables du syst`eme. . . 126
V.23Repr´esentation ´electrique de la machine synchrone `a aimants permanents et les conver-tisseurs AC/DC et DC/AC. . . 126
V.24Chemin de contrˆole g´en´erale de l’interface de transformation de puissance. . . 127
V.25Repr´esentation du banc exp´erimental.. . . 128 V.26Validation des chemins de contr ˆoles: A gauche en simulation, A droite sur le HIL simulateur.129
I.1 Energy consumption development by region: OECD and Non-OECD
(Mil-lion tons oil equivalent) . . . 9
I.2 Enercon E33 main characteristics . . . 22
II.1 Test sea states . . . 56
III.1 Kite generator system parameters. . . 68
III.2 Testing orbits parameters and optimized orbits’ period, mean mechanical power and performance . . . 69
III.3 Coefficients for the simulation study. . . 80
IV.1 Kite Generator System Parameters . . . 103
V.1 Les param`etres du syst`eme cerf-volant KGS . . . 121
AWE Airborne Wind Energy DCM Direct Current Machine
HPS Heaving Point-absorber System HAWE High Altitude Wind Energy KGS Kite Generator System
NMPC Nonlinear model predictive Control
OECD Organization for Economic Co-operation and Development PHIL Power Hardware In the Loop
PA Point Absorber
SM-PM Synchronous Machine with Permanent Magnets VCC Virtual Constraints-based Control
Kite Generator System
A Kite’s area
Ac Tether crosswind area
CL Lift coefficient
CD Drag coefficient
Cdt Tether’s drag coefficient
CR Kite’s resistive torque
~er Unit vector in the kite’s tether direction
(~er, ~eθ, ~eφ) Kite spherical coordinates
~ep Unit vector following ~Wep
~eo Perpendicular on (~er, ~ep) plan
Fgravt Tether’s weight Faert Aerodynamic force Fc,trc Tether’s traction force
~
Fgrav Gravity force ~
Fapp Apparent force
~
Faer Aerodynamic force ~
FL Lift force
~
FD Drag force
~
Fc,trc Tether traction force
γ Surface friction coefficient g Gravity acceleration ~γ Kite acceleration
Ge Kite aerodynamic efficiency coefficient
J0 Normalized mean generated power
L W~ep amplitude
µ Mass per length unit
m Kite’s mass
ΩS Rotor rotational velocity
ψ Kite’s roll angle PM Mean generated power
R Rotor diameter r0 Initial tether’s length
ρa Air density
T Orbit’s period
θ Tethers inclination angle
v Normalized tether radial velocity V Wind speed
VL Radial velocity
V|| Crosswind speed ~
We Effective wind speed
~
Wep Effective wind projection on (~eθ, ~eφ) plan
w|| Normalized crosswind velocity
x Kite’s state vector
~xw Unit vector carried on the kite longitudinal axis
~yw Unit vector carried on the line connecting the kite’s tips
~zw Perpendicular on the kite surface and directed upwards
z Altitude
Heaving Point-absorber System ρ Water density
H Wave amplitude
T Wave period
h Sea depth
Si(w) Wave power spectrum
λ Wave length
d Point-absorber diameter Ew Wave energy
V Point-absorber volume Pav Average power
Pmax Maximum power
CG Generator torque
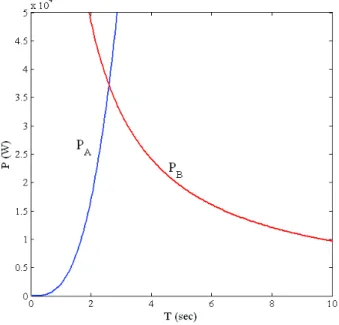
PA Optimum destructive interference power
PB Budal upper limit power
P Pressure on the floating point-absorber B Fluid’s external acceleration
µ Fluid’s viscosity coefficient V Fluid velocity field
φI Wave proper potential
φD Diffraction scalar potential
φR Radiation scalar potential
~n Unit normal vector on the floating body surface S Body’s surface
m Floating body mass mr Added mass
Rr Radiation damping coefficient
z Point-absorber translation
v Point-absorber translation velocity Fex Excitation force
Z(t) Sea surface elevation ˆ
An Normal distribution random wave amplitude
Tn Normal distribution random wave period
S Power spectrum
RP T O Power take-off
Power Transformation Chain
CG Generator torque
CDC DC-bus filtering capacitor
D Damping factor estimation
esk : k = a, b, c Electromagnetic force voltage source in Behn-Eschenburg machine model
¯
φf s Induced flow vector
¯
is Stator currents’ vector
¯
iG Grid currents’ vector
IDCREC Machine converter output current
IDC DC bus current
J Total inertia of kite, drum; and machine’s rotor
K Gearbox factor
Kp Proportional gain
Ki Integral gain
Ls Inductance in Behn-Eschenburg machine model
ω Machine’s electric pulsation ωG Electric grid pulsation
ωn Resonant pulse of the injected currents harmonies
p Poles’ pairs number
Rs Resistance in Behn-Eschenburg machine model
Rf, Lf Loss and filtering components
RDC DC-bus resistance
Ti Corrector time constant
UDC DC bus voltage
¯
vs Stator voltages’ vector
Power Hardware-In-the-Loop CDCM DC-Machine torque
Ccor Correction torque
JE Total inertia of the DCM and PMSM rotor
DE Damping factor estimation between DCM and PMSM
Answering for the growing demand for energy and the expectations of oil depletion, as well as, reducing the negative effects of human’s industrial and technological advance on earth’s climate are some of the most important issues facing us at present. One of the major challenges is how to decarbonize the electric grid by eliminating fuel-based electricity generators, and replacing them, preferably, by green and publicly accepted resources. That is where renewable energy resources rise as a promising solution.
Lately, renewable energy has been undergoing a lot of research and development, that aims at solving renewable resources problems such as efficiency and grid integration, and exploring new methods and structures to exploit them. The later research axis led to the birth of relaxation-cycle renewable energy systems. Those have a periodic power cycle with two phases:
• A generation phase during which the system is working in its “power” region, and this enables it to generate electricity until it reaches its boundaries.
• A recovery phase that resets the system’s state to start a new generation phase, and consumes energy while doing so.
Hence, an optimization operation is required to insure the consumed energy’s minimiza-tion and the generated energy’s maximizaminimiza-tion.
Relaxation-cycle renewable energy systems are the interest of this thesis. In particular, two examples of those are considered case studies. The first is the kite generator system (KGS). It is a solution proposed to extract energy from the steady and strong wind found in high altitudes. Its operation principle is to mechanically drive a ground-based elec-tric generator using one or several tethered kites. The second case study is the heaving point-absorber system (HPS), which is a floating wave energy system that employs wave oscillations to turn an electric generator and generate electricity.
In addition to the classic problems accompanying renewable energy resources, those with relaxation-cycles are a very interesting field of open challenges, such as finding solutions to multi-dimensional optimization problems, and grid integration of their alternating out-put power. Those challenges are addressed in this thesis realized in Grenoble Electrical Engineering laboratory (G2ELab) with collaboration with Grenoble Image Parole Signal Automatique laboratory (GIPSA-Lab). The thesis is organized in four chapters:
The first chapter presents the Relaxation Cycle Renewable Energy Systems. It introduces the thesis subject and key words. It includes a brief overview on energy history, current situation and expectations, in addition to presenting the new technologies in the field of wind and wave energy while concentrating on those with relaxation cycles. The chapter also states the problems handled and the challenges confronted in the thesis, in addition to listing the objectives.
The second chapter handles the Structure and Modeling of two relaxation-cycle systems. Those are the kite generator system and the heaving point-absorber system. Simplified structures of both systems are presented and modeled. Their relaxation cycle is defined and methods to maximize their generated power are listed. A comparison shows the re-semblance between both, and only the KGS is considered in the rest of the thesis.
The third chapter deals with the Kite Generator System Supervision. Here, two strategies to optimize and to control the KGS are proposed. Those strategies are based on a nonlin-ear model predictive controller (NMPC) and virtual constraints-based controller (VCC). The last chapter is about the Kite Generator System Grid Integration and Control Val-idation. The topology applied to grid integrate the KGS or use it to supply an isolated load is modeled and controlled. Afterwards, the proposed control functioning is insured through simulations and experimental validation. It is achieved via testing on a power hardware-in-the-loop simulator which is real-time hybrid simulation system.
Contents
I.1 Introduction. . . 5
I.2 Renewable Energy. . . 6
I.2.a Global Energy Situation and Expectations . . . 7
I.2.b Renewable Energy Evolution . . . 9
I.3 Wind Energy. . . 10
I.3.a Conversion Technologies . . . 11
I.3.b Flexible Power Kites . . . 15
I.3.c Kite-based System vs Classic Wind Turbine . . . 21
I.4 Wave Energy. . . 22
I.4.a Wave Average Power . . . 23
I.4.b Wave Energy Conversion Technologies . . . 24
I.4.c Vertically Oscillating Point Absorber Systems . . . 27
I.5 Relaxation Cycle Systems . . . 29
I.5.a Kite-based System’s Relaxation Cycle . . . 31
I.5.b Heaving Point-Absorber’s Relaxation Cycle . . . 32
I.6 Problem Statement and Objectives. . . 33
I.7 Conclusion . . . 33
Abstract
Triggered by the fear of oil depletion and dependence, an intensive research on alter-native to fossil fuels is going on recently. A huge part of this research is concerning renewable energy resources, and looks for new methods and technologies to improve their integration. An interesting and particular group of renewables assembles systems with relaxation cycles. Such systems need to regain periodically a state that allows energy production, which results in a recovery phase that consumes energy, hence a generation-consumption cycle is created and should be optimized to maximize the sys-tem’s average produced power.
This first chapter presents the thesis main key words: Renewable energy, in partic-ular wind and wave energy, and relaxation cycle systems. It introduces, as well, the problems handled and the objectives of this PhD dissertation.
I.1
Introduction
Modern civilization is very energy dependent, especially on its non-renewable resources that are expected to run out sooner or later, and shortly will not be able to satisfy the growing energy demand. The global demand in 2010, of which 86.5% is covered by fossil fuels [Pet10], is expected to increase by 40% in 2030. An increase that will not be ac-companied by a similar growth in fossil fuels production, and even if it does, new fossil fuels fields will be much harder to be dug out and exploited thus much more expensive. Thereby, demand increase must be covered by other energy sources.
In addition, fossil fuels consumption should be limited as their usage is accompanied by emitting huge amounts of Carbon Dioxide CO2 which endangers the earth climate by its
greenhouse effect [IEA11].
Renewable energy resources, such as solar, wind and tidal1 systems, rise as a very promis-ing ideal clean solution to cover for fossil fuels decline. Nonetheless, renewable energy generation is accompanied with a lot of scientific challenges, such as substitutability and intermittency [Fri10].
The major interest in sustainable development and the continuous research for new re-newable energy exploitation systems have led to the birth of a new family of systems: Those with relaxation-cycles. A relaxation-cycle system produces energy until it reaches certain limits after which it must recover a state that allows it to reproduce, this recovery operation could consume energy. Examples of those are: Kite-based traction and tidal systems that uses waves or swell energy.
All renewable energy systems are more or less intermittent, but do not have major issues in terms of control. The problem is rather in improving their integration into the electric grid technically and economically. However, when considering power generation system with relaxation periodic phases, new difficulties are added. Firstly, providing the needed power during the recovery phase, and secondly, controlling the system’s generation/consumption cycle in order to recover the maximum possible energy. This should be achieved while considering the constraints on the system itself, the primary source of energy, and grid loads.
In this first chapter, the thesis subject and objectives are introduced. It starts by an intro-duction on renewable energy history and expectations. Among the different investigated renewable resources, a couple is addressed in detail in Sections.I.3and I.4: Wind Energy and Wave Energy. Classic and innovative methods to extract these energies are presented and compared, and examples of structures that employ the notion of relaxation cycles are as well introduced.
Section.I.5 presents the relaxation-cycle system’s concept supported by some examples. Next, the problem’s statements and challenges, and the work objectives are addressed in Section.I.6.
I.2
Renewable Energy
Figure I.1: Norias on the Orontes river in Syria
Renewable energy is the oldest exploited form of energy, starting from using wind energy to drive sail boats along the Nile more than 7500 years ago, and replacing man and animal effort by vertical wind mills in the middle east in 200BC, and by Norias2 (Fig.I.1) in Syria in 469AD [Bur63]. In Europe, windmills were the es-sential energy resource that supplied indus-try in the 12th century. Fig.I.2 displays a
time chart of some of the important events in the history of energy.
!"#$%&'()&
!"#$%"&&'()*+')",),-%') *+%#,-&.#"$+$&& /$+&,0&1"2'&+2+#34& &&%,&'#"5+&$6"7$&
8,(-&*+(9&
!"#$%&1"2'&%:#;"2+& <=>?&
?@@@&A&B@@@&C8&
DD@@&C8&
E")7-+&1"2'&)"--$&"2&.6"2(&&F&G+#%".(-&(H"$&)"--$&"2&*+#$"(& I@@&C8
&
J"-&F&2(%:#(-&3($&+)+#3+'&
($&+2+#34&#+$,:#.+$
&
<K@@&
<K>?
&
<K>@&
!"#$%&1"2')"--&%,&&3+2+#(%+&+-+.%#"."%4
&
<==>&
8,(-&#+7-(.+&,%6+#&&0,#)$&,0&+2+#34
&
<>@@
&
L"2')"--$&"2&M:#,7+&
<<=D&
E,-(#&0(#)$
&
<K=@&
N6+,#4&,0&,"-&7+(9&
<KDO&
*#+$+2%&
Figure I.2: Important events in the history of en-ergy.
The development in renewable energy systems stopped and renewable resources became secondary in the 17th century,
be-cause of the arrival and the domination of coal. Coal was the main reason for the in-dustrial revolution in Europe around 1760. It fed steam machineries and trains at the time, and later, in 1881, was used in first electrical power generation plants3.
The “Coal peak”, in 1873, created a fear of coal depletion, which regained renewable energy attention back. The years 1883 to 1891 witnessed many discoveries that con-tributed to solar energy evolution, and in 1891 the first solar cell appeared and the first solar heater was introduced. Further-more, in 1887 a windmill was used to pro-duce electricity for the first time.
Renewable energy resources were di-minished again by the arrival of oil and natural gas at the beginning of the 20th
century. Since then, fossil fuels are being heavily exploited in order to keep pace with the huge technological and industrial de-velopment the twentieth century had wit-nessed.
The problem is that fossil resources have
2Comes from the Arabic word Naaurah meaning the first water machine
been generated and stored underground since the birth of earth, billions of years ago, and are decreasing very fast that they will soon come to an end. This issue, in addition to some governments taking advantage of their fossil fuels and using it as a pressure to control international policy, has encouraged research to reconsider renewable energy as the future energy resource in fear of oil depletion and dependence.
In the following, the current and future energy situation and the results of the current energy policy are discussed. As well as, some statistics on renewable and non-renewable energy evolution are presented.
I.2.a Global Energy Situation and Expectations
Many studies are carried on to predict future energy situation, and answer the questions: • How long oil will be able to satisfy its demand?
• Will this demand continue to grow?
Those studies take into account many different variables [Fin08], such as proved reserve, expected population growth and economy evolution. They all agree on two points: First, the oil peak, or what is referred to as “Peak of the Oil Age”, if has not already occurred, it will very soon, some claims before 2020 [AHJ10]. Secondly, oil will become much more expensive, as it will be much deeper and more difficult to be extracted [HR11], and its production will not meet the demand level.
In addition to limited future availability, fossil fuels are endangering the earth’s climate, because of their CO2 emissions. The emissions have already changed the earth climate
dramatically during the last ten years due to global warming effect [IEA11]. Fig.I.3shows how CO2 emissions have increased in the last two decades [Pet10]. Moreover, they are
expected to grow 26% in 2030, according to the BP 2013 report, if the current global energy strategy were still adapted.
The use of fossil fuels is a serious problem, not only economically and climate wise; but on the humanitarian side as well, as its lack has and will enhance wars. These threats to our earth have led to research replacing fossil fuels dependent machinery to electricity dependent ones; an electricity that is produced in a nature-friendly procedure.
One non-fossil energy resource once considered very promising for future energy, is nu-clear energy. This resource, however, is facing many accusations considering its safety and cleanness. These accusations are now more intense after the recent Fukushima Daiichi nuclear disaster on March 2011 [Str11], which raised serious doubts about the future of nuclear energy.
All mentioned points led to considering renewable energy resources, such as biomass, geothermal, solar photo-voltaic, solar thermodynamic, wind and tidal systems, as they offer the safest and cleanest type of energy.
Fig.I.4shows the evolution of energy production distribution by energy resource according to the BP4 energy outlook released in 2011[Pet10]. Though fossil fuels are expected to
Figure I.3: CO2 emissions evolution since 1965.
continue to supply the majority of energy demands in 2030, renewable resources (wind, biofuels, hydroelectricity,...) are expected to witness a huge relative increase in the coming decade. For instance, renewable energy share in global energy consumption is estimated to have risen from 11.78% in 2011 to 13.20% in 2012, which means an 11.74% rise, of which, renewables’, other than hydro and bio-fuels, rise is estimated to 16.56% and have contributed 12.7% of world energy growth according to the latest statistics published by the BP society.
Moreover, extensive studies are ongoing on how to extract energy from natural renewable resources and transform and inject it in the electric grid in order to increase renewable energy partition in future energy.
0 2000 4000 6000 8000 10000 12000 14000 16000 18000 1990 1995 2000 2005 2010 2015 2020 2025 2030 M il li o n t o n n es o il e q u iv a le n t
Oil Natural Gas Coal Nuclear Energy
Hydroelectricity Biofuels Other Renewables 2012
Figure I.4: Energy production history and expectations.
Another objective is to increase investments and awareness on this field of energy should be achieved, mainly in the Non-OECD (Organization for Economic Co-operation and De-velopment) countries, whose share of energy demand is the largest according to Table.I.1.
This can be achieved through collaboration between OECD and non-OECD countries via sharing information and advancements in renewable energy extraction technologies. Table I.1: Energy consumption development by region: OECD and Non-OECD (Million tons oil equivalent)
Year 1995 2000 2005 2010 2015 2020 2025 2030
Total Energy Demand 8578 9382 10801 12002 13360 14627 15635 16632
OECD 4992 5435 5667 5568 5571 5679 5729 5765
Non-OECD 3586 3947 5134 6434 7789 8948 9906 10867
It may be somehow late to provide the needed energy using only non-fossil energy re-sources, but it worth working on to minimize the disastrous results of fossil fuels draining off.
I.2.b Renewable Energy Evolution
When electricity was first being produced in the late 19th century [Mar13], a huge part was due to renewable energy resources, mainly hydroelectric facilities. Apart from hydro-electricity, renewable resources provided expensive electricity compared to fossil fuels based generators. For instance: In 1940 in the USA, one kW h of wind-based generated electricity cost 12 to 30 cents, while a fossil fuel-based generated electricity cost only 3 to 6 cents/kW h [KS46], this price even declined to below 3 cents/kW h in 1970. The big difference in prices led to ignore renewable energy resources for the sake of fossil fuels and very limited improvement was done in this field.
0 50000 100000 150000 200000 250000 300000 350000 400000 450000 1995 2000 2001 2002 2003 2004 2005 2006 2007 2008 2009 2010 2011 2012 M eg a w a tt s
Geothermal Photovoltaic (PV) Wind turbine
Figure I.5: Main renewable energy cumulative installed evolution between 1995 and 2012 (excluding hydro and bio-fuels).
another, forced politicians to adapt new policies to limit fossil fuels dependence, which gained back attention to renewable resources and nuclear plants. Since then, huge effort, development and research in the field were achieved. Cost was reduced and renewable energy share in power consumption has grown 5 folds from 0.43% in 1990 to 4.7% in 2012. As shown in Fig.I.5, wind energy contributed to the most substantial increment. During the last decade, wind energy global capacity increased more than nine-fold, growing from 17.4 GW in 2000 to 158.6 GW in 2009 [AWE10]. That makes wind, not only the fastest growing renewable energy resource, but also the fastest growing electric power resource of all [AJ05].
In the following, wind energy is addressed, as well as wave energy. Though wave energy does not represent a significant resource at present, it is believed to hold an important part in the future energy as it offer a dense and a vastly available storage of energy, and can be exploited without scenery negative effects.
I.3
Wind Energy
Human efforts to harness wind energy date back to the ancient times. This energy was employed to sail ships, grind grains, and pump water thousands of years ago. The first time man thought about using wind for mechanical power is believed to be during the seventeenth century B.C when the Babylonian emperor Hammurabi planned to use wind power for an ambitious irrigation project. However, the earliest documented design of using wind’s mechanical power to feed a machine is the wind wheel of the Greek engineer Heron of Alexandria (Fig.I.6) in the first century AD.
Figure I.6: Heron’s wind wheel used to supply an organ[Dra61].
Wind is considered an ideal renewable energy resource, since it is infinitely sustainable and clean, which explains the global interest in exploiting its energy. In the following, wind power conversion technologies are briefly presented and compared.
I.3.a Conversion Technologies
In addition to classic wind turbines, other solutions are proposed to harness wind power, including floating turbines that aims at capturing the strong offshore wind and structures that works at high altitude where strong stable wind is available continually.
I.3.a-i Wind Turbines
Traditionally, wind energy is exploited using a wind turbine (See Fig.I.7). Wind turbines technologies has evolved an varied greatly during the last 3 decades, however, a conven-tional turbine is a two/three-blade rotor, that captures wind’s kinetic energy. This is done by a direct, or through a gearbox, coupling with an electric generator. The turbine is con-nected to the electric grid directly or via a power-electronics interface. The turbine power is controlled by commanding the pitch and yaw blades angles. Notice that the eventual power electronics interface is exploited for this reason as well. The whole conversion chain and the blades’ control unit are placed up next to the rotor hub, on the turbine’s tower.
Figure I.7: A 1.5-MW wind turbine installed in a wind farm[TRV07].
Wind energy is written in eq.I.1, where ρ is the air density, A is the considered cross-sectional wind area, and V is wind speed.
P = 1 2ρAV
3 (I.1)
Hence, following the development of wind turbine’s industry, a trend to increase the size of the turbine is particularly clear. One aim of this increase is to reach higher altitudes where winds are supposed to be stronger and more stable since the aerodynamic friction of the earth surface slows down low altitude wind speed. This can be shown via the dependency function of wind speed V on altitude z:
V (z) = v0( z
z0
)γ (I.2)
The other objective is to increase the blades size thus the turbine working area, thus A, with which the available wind power increases linearly (eq.I.1).
Figure I.8: Wind speed evolution with altitude above a flat open coast (γ = 0.4).
Nevertheless, turbine size is not expected to grow as dramatically in the future as it has in the past without significant technological advancement and change in the design [TRV07]. As well as, despite the improvements of wind turbines efficiency, according to Betz limit [Gam07], it can only extract a maximum 59% of the available energy in an air stream with the same area as its working area. Moreover, although modern turbines are designed to capture 80% of this maximum limit, in reality their efficiency is about 40 − 50%. Besides, the turbine does not produce its rated power continuously, due to wind irregularity. To overcome these limitations, new axes of research have started. One solution is building “Floating turbines” that take advantage of strong and regular open-sea wind (See Fig.I.9). The down point of this solution is that it does not solve the problem of costly construction and maintenance. The other solution looks for new flying structures able to extract wind energy at high altitudes (HAWE) of about 400 − 2000m.
I.3.a-ii High Altitude Wind Energy Technologies
Several designs are proposed to harness HAWE, such as Air Rotor Systems, Airborne wind turbines and tethered airfoils (kites).
The principle of the air rotor systems developed by Magenn (MARS) Power Inc[Meg], shown in Fig.I.10, is as follows: a helium-filled balloon stationary at an altitude between 200m and 350m rotates around a horizontal axis [OS92] in response to wind because of the magnus effect, generating electrical energy via a generator connected to its horizontal axis. The energy produced is then transmitted to the ground by a conductive cable. Magenn Inc. tested a 2kW prototype in 2008, and in 2010 has started manufacturing and commercializing a 100KW balloon.
Figure I.10: The balloon of Magenn Power Inc.
The second solution adapted by Sky WindPower [Skya], Joby energy [JE], and Makani Power [mak] is to use airborne wind turbines to harness energy directly in high altitude winds and send it to the ground through conductive cables. Fig.I.11shows the airborne wind turbines proposed by Joby energy. This solution has some technical complexities, high cost and heavy structures. Only Makani Inc., acquired by Google.org as part of GoogleX, has passed to the production phase. They have already started producing a 1M W airborne wind turbine named “Makani M1”.
The third option is to use power kites as renewable energy generators such as the “Kite Wind Generator” of Politecnico di Torino, and the “Laddermill” of the Delft University of Technology shown in Fig.I.12. In this case, mechanical power is generated when the kites are pulled by wind, transformed then into an electrical one using an on-ground generator. This allows the flying part of the system to be much lighter and avoid using conducting cables. This technology is expected to produce huge amounts of power using a much simpler and safer structure.
Figure I.12: Imagined laddermill of Delft University of Technology
I.3.a-iii Comparison between Different Technologies
After introducing the different proposed solutions to capture wind energy, in the follow-ing, the advantages and disadvantages of each solution are discussed. They are classified in three categories: Conventional wind turbines, airborne wind turbines and kite-based systems.
From the grid connection point of view, wind turbines are not able to produce their rated power continuously, due to wind irregularity at their working altitudes, a problem that is less significant in the case of HAWE systems which are supposed to be working at an altitude higher than 400m where the winds are more regular.
Concerning the quality of generated power, it depends whether the system returns power to the energy source or not, meaning whether it has a recovery phase or not. In general, a classic turbine has only one phase of functioning that is generation, which means that while generating, the resulted power is continuous as long as the turbine is in the power region limited by its cut-in speed and cut-out-speed. This is the case of stationary air rotor systems also. Meanwhile, kite-based systems and airborne wind turbines have a recovery phase whose goal is to maximize the average generated power and the respect of the systems constraints, but reflects negatively on the generated power which becomes intermittent. This, however, may be balanced out by the high reversibility of these systems that allows using two or more system with a suitable choice of the kite’s orbits to filter the resulted generated power.
Furthermore, HAWE systems offer mobility and can be invested hugely as it works at a high altitude where strong wind could be present with little or no wind at low altitudes. Besides, they offer a very high adaptivity, as their rated power, as well as, generation/consumption phases, can be modified by changing the orbit the kite is following e.g. size, rotation
and/or inclination, or changing the altitude. Notably, a kite-based system rated power can also be adjusted by changing the kite surface. These adjustments are important to optimize the system’s generated power for changing conditions and constraints on it, e.g. Wind speed and direction.
Cost-wise, HAWE systems economize the manufacturing, transportation and construction cost compared to a wind turbine, e.g. they eliminate the turbine mast cost.
Finally, a kite-based System backs down when it comes to the real-time control issue. That is due to the complexity of the system’s behavior, a matter that will not be a problem thanks to the rapid development in computer and information technology, allowing to have fast and reliable real-time data processing.
We are interested in HAWE relaxation-cycle systems, and particularly in kite-based sys-tem due to the advantages that can be obtained using it. This is the focus of the next section.
I.3.b Flexible Power Kites
Kites were used in China approximately 2,800 years ago. Apart from being child-toys, their early uses involved measuring distances, testing the wind, lifting men, signaling, and communication for military operations. After spreading in Asia, kites were brought to Eu-rope by Marco Polo at the end of the 13th century [Gom]. In the 18th and 19th centuries, in addition to military operations, kites were used to tow buggies in races against horse carriages in the country side [Gri09], and researchers like Alexander Graham Bell and the Wright Brothers invested kites in their development of the airplane, such as the Wright’s Glider 1900 shown in Fig.I.13. At the beginning of the 20th century, interest in kites was diminished by the invention of airplane [Sch12]. Kites drew back attention in 1972 when Peter Powell introduced a steerable dual lines kite, and flying kites became a sport. Af-terwards, in 1979, M.Loyd wrote a paper [Loy80] on how to use an airplane connected by a tether to generate huge amounts of energy. Though his paper was completely ignored at the time, it is now considered a revolutionary idea that will compute hugely in the future of renewable energy.
Figure I.13: Wright brothers Glider 1900.
It is not until 1996, however, that the idea was proposed again when W.J. Ockels regis-tered his Laddermill patent [Ock96] proposing the usage of kites connected in a cycle to turn an electric machine and generate electricity. Fig.I.14shows the proposed Laddermill
Figure I.14: The Laddermill concept proposed by W.J. Ockels [MOS99].
structure of Ockels’s patent. Since then, few groups around the world have been working on this concept including Ockels team in T.U.Delft, Netherlands. For example, an Italian project named “Kitegen” was launched in 2007 in the Politecnico di Torino. A prototype was built and tested, but the project has unfortunately slowed down recently due to lack of investment and the division into two companies: KiteGen and EnerKite.
Other university groups are carrying out these research, like for instance: K.U.Leuven in Belgium [FHGD11], the university of Heidelberg in Germany [DBS05] [HD07], the uni-versity of Oulu in Finland [AS13]; and the uniuni-versity of Grenoble in France [AHB11a] [AHB11b] [LJADH12].
In the industry sector, using flexible kites for towing ships is already in the market by Skysails GmbH Company in Hamburg, Germany [Skyb]. In fact, installing kites on huge ships proved to reduce their fuel consumption up to 30%, and now the company is study-ing the possibility of installstudy-ing floatstudy-ing kite-based system in the sea to extract energy from off-shore strong winds. Some other companies’ names in the field include: Makani Power Company in the USA [mak], Windlift [Win], SwissKitePower [Swi], and Worcester Polytechnic Institute (WPI) project #DJO-0408 [Bal08]. Fig.I.15 lists some of the main projects in kite power field.
New fabrication technologies permitted providing strong and light tethered kites, as well as, the huge development in electronics, communication, and computer sciences allows a fast and robust real-time optimization and control.
I.3.b-i Crosswind Kite Power
In his paper [Loy80], Loyd analyzed three ways by which the kite can generate energy. Two are significantly more effective:
• The The drag power that can be exploited by having air turbines on the kite. This idea was employed in the Air Rotor system and the airborne wind turbines presented in section.I.3.a-ii.
• The crosswind power. Loyd showed that by neglecting the kite’s weight and the tether effect, and considering the kite motion to be directly in crosswind5; then the
Figure I.15: Airborne wind energy research and development activities by country and by group as
shown in the Airborne Wind Energy book [ADS13].
kite’s speed is increased significantly above the wind speed, which leads to increasing the can-be-generated power.
It is, however, not possible to let the kite fly always in a crosswind direction. In [ARS09], the refined crosswind motion low is found and expressed in eq.I.3. In the case of a small kite and a constant tether length, the refined crosswind formula is:
~
Wep = W~e− (~er. ~We).~er,
|Wep| = GeV||
(I.3)
where ~We is the effective wind speed, that is the difference between the wind velocity ~W
and the kite’s velocity ~Vk, (~er. ~We).~er is its projection on the tether direction, V|| is the
crosswind speed and Ge is the aerodynamic efficiency.
Figure I.16: Refined crosswind law.
wind blowing against the kite, and ensures the non-tangling of its tethers. But it should be mentioned that, according to [HD06], a circular trajectory will provide a 0.9% to 1.3% higher traction force than that of an eight-shaped one, in addition to ignoring the wind direction that may affect the system’s safety and control complexity [AC09]. Still, tethers tangling and coiling remain a serious problem and render the eight-shaped trajectory preferable.
I.3.b-ii Energy Generation
The concept is to mechanically drive a ground-based electric generator using one or several tethered kites6. Energy is extracted from high altitudes by controlling the kite to fly with a high crosswind speed. This develops a large pulling force that turns the generator, thus generating electricity. However, due to limitation in the tether’s length and the power region, the tether must be reeled in to its initial position, consuming energy as doing so. The system optimization will aim at maximizing the generated power and minimizing the consumption. The kite-based system should offer the tethered kite the flexibility to change its flying direction following the wind direction.
In general, kite-based systems are classified in three groups according to the energy gen-eration concept:
The Pumping System7
It is largely adapted by several research teams. The system has two operation phases: • Traction phase, in which the kite is pulled by the wind, unrolling the tether which
turns the ground-based machine
• Recovery phase, that begins when the tether reaches its predefined maximum length or height, and needs to be reeled in, an operation that consumes energy.
To minimize this consumption the KiteGen project has presented two methods [FMP10]: • Low power recovery maneuver: The kite is driven to the borders of the “power zone”
defined later in Sec.II.2.a-i, where the aerodynamic forces become much weaker, and it can be recovered with low energy expense. One down point of this maneuver is that it occupies a huge space, which is a problem when it comes to considering a kite-farm for example.
• Wing glide maneuver: Here the kite is controlled to be parallel to the tether, thus it loses its aerodynamic lift and can return fast with low energy losses. Nonetheless, this maneuver, subject the system to instability and difficulty to restart its cycle. Other than sequent eight-shaped orbits with increasing altitude that are usually adapted in the traction phase (see Fig.I.17) [AS10b], [LO05], [PO07a], [HD10], [CFM10], other ideas are also investigated. In GIPSA-Lab of Grenoble university, France, researchers are
6The generated mechanical power can be used directly to pump water or to tow a ship
Figure I.17: An example of the pumping mode.
working on a pumping kite in which the kite’s tether has a constant flight angle and the kite is controlled by its attack angle and traction force [LJADH12].
Apart from this, another idea started in SEQUOIA Company is the Rotokite. The idea proposes having two opposed kites connected to a single tether [Ver]. They are controlled to rotate around the tether, generating a lift force that will pull out the tether, and when the maximum height is reached, they are warped to minimize the aerodynamic lift and then pulled down.
Figure I.18: An imagined Rotokite system used to pump water.
The Closed-Orbit System
In this system, the kite is kept on a single eight-shaped orbit. During one orbit, two regions can be distinguished: A high and a low crosswind region. In the high crosswind region, the kite pulls out the tether which forms the “traction phase”, and in the low cross-wind region, the tether is reeled in, and that is the “recovery phase”.
This mode may not generate as much energy as the pumping mode [AS10a], but it is easier to be stabilized and controlled, as it needs only one controller compared to at least two controllers in the pumping mode, as well as it occupies a small space [LW06]. Moreover,
its production can be optimized by a careful choice of the orbit and adding the possibility to control the aerodynamic coefficients through control of the kite’s attack angle [AS10a].
Figure I.19: Closed-orbit mode.
The closed-loop approach is principally used to tow boats and minivans [Bra10]. The Carousel System
This system, proposed by M.Ippolito [Ipp08], suggests placing several tethered-kites with their control units on vehicles moving along a circular rail path. Fig.I.20shows a simplified presentation for the system.
Vehicles’ speed is kept constant using electric machines on their wheels, while the kites tether’s length might be fixed or have a rolling/unrolling motion [CFM10]. For the first case, when the kite is in its power zone, it pulls the vehicle which presents the traction phase, and when the kite is out of the power zone it is moved back into it by the vehicle and that is the recovery phase. According to [FMP11], this complex structure generates the same power that can be produced using a simple pumping kite.
Although by applying a rolling/unrolling (pumping) motion of the kite to compensate the consumed energy during the recovery phase, a highly efficient system can be obtained, it is still economically and technically very challenging. This proposed system is able to extract
huge amounts of energy, but it does not satisfy that a kite-based system is supposed to be largely lighter and cheaper than a classic turbine.
I.3.c Kite-based System vs Classic Wind Turbine
An example to compare a kite-based system to a classic turbine from the generated power point of view, is given in [Fag09]: A 2M W wind turbine, the weight of the rotor and the tower is typically about 300 tons, while a pumping kite-based system of the same rated power is estimated to be obtained using a 500m2 airfoil and 1000m long tethers, with a total weight of about 2 tons only.
Practically, we mention here two examples of early trials in the field. In T.U.Delft, a one-tether kite control is tested in simulation; the kite surface is 25m2with a mass of 50kg and the tether average length is 1000m. An optimal control is used to command the roll angle, attack angle, and the tether length variations rate. It uses different random guesses because there is no guarantee that the obtained solution is a global one. The average power generated depends on the orbit period, for example, a 60 sec period orbit yields in 75 kW [WLO07b].
The KiteGEN team has chosen a two-tether kite for their prototype, with control of the tether length variations rate and the roll angle. For simulation, a kite of 10m2 and 4 kg of mass; and maximum 800m long tethers. A nonlinear predictive control, without a pre-computed trajectory, is applied. It maximizes the average generated power directly. Besides, a sampling time of 0.2 sec is obtained by applying a fast nonlinear model predic-tive control (NMPC), for the sake of real time control computations. With a wind-speed of about 7.7m/s at 300m altitude, the average generated power is 5 kW [Fag09].
Furthermore, the following comparison is proposed to compare the efficiency of a kite-based system adopted in the next chapters and named Kite Generator System (KGS) compared to a classic wind turbine.
Discussion A small Enercon wind turbine (E33) has the main characteristics of Ta-ble.I.2. Its rated power of 330kW can be obtained using the closed-orbit KGS described in Sec.IV.4.d but with a kite surface A = 300m2= 30m × 10m. The flying part of such a
system, including: the kite and the orientation mechanism will have a mass of less than 1t compared to about 18.7t for the E33 turbine’s on-tower mass, eg: excluding the tower and the turbine foundation. This fact makes the KGS easier to be transferred and maintained. On the other hand, both wind system occupy theoretically the same ground area. But when it comes to aerial area, the KGS’s power per unit area for this example seems to be about 60 times less than that of the E33, the same system can be used to produce more power by simply changing the kite’s altitude. As well, working at high altitude ensures a constant high wind speed hence constant power generation.
Using a closed-orbit KGS is not suitable to compare the potential of using kites to produce electrical power to that of classical wind turbines, as its energy efficiency is small compared to the pumping KGS or a closed-orbit configuration with a variable aerodynamic efficiency Ge.
Table I.2: Enercon E33 main characteristics
Rated Power 300 kW
Hub height 50 m
Rotor diameter 33.4 m Rated wind speed 11.7 m/s
I.4
Wave Energy
Oceans store a tremendous amount of energy and are close to many concentrated popu-lations. This energy is stored in many forms. Most importantly in the form of flow, like tidal and marine currents, and waves and swells8.
Wave power is receiving a particular attention lately due to its great potential, since waves are more constant and predictable than other types of renewable energy, as well as, their stored energy is very dense compared to that of wind and solar [BVJH09]. According to World Energy Council, wave energy technically available for extraction can satisfy 10% of the world electricity demand. In metropolitan France, this proportion is a little less, it is estimated to 40T W h, that is 7.27% of the 550T W h consumed per year in France [LP08].
Figure I.21: Wave energy annual potential (kW/m) [Atl].
France is a pioneer in the wave energy field. Historically, in 1799, in Paris, Girard and his son filled the first known patent to use energy from ocean waves, and in 1910, Bochaux-Praceique built an oscillating water-colomn device to employ wave power to supply elec-tricity to his house at Royan, in France.
Wind waves are caused by the wind blowing over the surface of the ocean. They range between small ripples with approximately 10Hz frequency, that disappear once the wind
8The only difference between waves and swells is the distance from the source that has generated them,
either local wind for waves or non-local for swells . For this reason, the word wave is used here to describe both.
stops, and 3.3mHz swells which are gravity propagated from wind-generated waves. Wind waves are distinct from longer wavelength waves caused by storms, earthquakes, e.g. Tsunamis, and those result from the Sun and Moon gravity, e.g. Tides.
Since sea water density at the surface is about 1020kg.m−3 and that of air is 1.27kg.m−3 , waves travel much slower than the wind that created them, and the energy they can provide is compacted about 800 times. In fact, a wave power available for exploitation, given per wave front length unit, reaches a few tens of kW/m. For instance, wave annual average power on the Atlantic coasts is between 15 and 80kW/m [Mul03] which explains the particular interest in wave energy in the western coast European countries.
Nevertheless, taking into account the difficulties facing wave energy development, including for example waves irregularity and weather conditions, a wave energy exploitation system will be a complex sophisticated one [CMF02].
I.4.a Wave Average Power
Sea level oscillations, just as wind, are stochastic space-time random phenomena. A sea wave can be approximated by a sine wave with both stochastic variable amplitude and period. Fig.I.22 presents the parameters of such a wave. Based on this wave definition,
Figure I.22: Regular wave parameters.
one can find the wave front average power per meter [Fal07] in the case of deep water9 (See Fig.I.23):
Pdp =
ρg2 16πH
2T (W/m) (I.4)
and in the case of shallow water: Psh=
1 p(36π)ρg
3/2H2h1/2 (W/m) (I.5)
where g is gravity acceleration, ρ is water density, H and T are the wave amplitude and period respectively, and h denotes the sea depth.
The previous wave definition considers a pure sinusoidal wave with no obstacles, while in fact, a wave is irregular and defined as a superposition of multiple waves with random
Figure I.23: Power per meter front for a regular wave.
amplitudes and periods, as explained later in sectionII.3.b-i. In [GHG10], sea behavior is defined as a group of sea states, where each state i has an average power given by:
Pirri = Z ∞
0
Pi(H, w)Si(w)dw (W/m) (I.6)
where Si(w) is the power spectrum of the wave at the state i for the frequency w, and
Pi(H, w) is the average power of a regular wave with (H, w) as parameters.
The irregularity and the slowness of waves oscillations, make transforming their energy into an electrical form, that can be later commercialized, very challenging.
I.4.b Wave Energy Conversion Technologies
Several solutions are proposed to extract wave energy and convert it into electricity [Fal10] are proposed [AMCHB12] [BEBC07]. Wave energy conversion (WEC) systems can be categorized based on the location and the depth they are designed to work at, i.e. Near-shore and off-Near-shore systems.
I.4.b-i Near-shore WEC Systems
They are mainly turbine-based structures; their operating principal is to employ waves oscillations to generate a current of water or air that turns a turbine coupled with an electric machine, thus generating electricity. As examples of these systems one can cite:
• WAVEGEN (4 MW)10In this system, an air turbine is turned by the air current gen-erated by waves oscillations (Fig.I.24). It has been already installed and connected to the Spanish electric grid in 2009.
• TAPCHAN (Tapered Channel) Wave Energy (rated output about 350 kW) [Tju94]. Shown in Fig.I.25: This construction canalizes sea water to turn a turbine, then water flows from the basin back to the ocean by gravity. It was first constructed in 1985 and installed in Norway.


![Figure I.9: Off-shore wind turbine for the great lakes in Ontario-Canada [Flo10].](https://thumb-eu.123doks.com/thumbv2/123doknet/14743458.755507/35.892.315.537.855.1091/figure-shore-wind-turbine-great-lakes-ontario-canada.webp)
![Figure I.15: Airborne wind energy research and development activities by country and by group as shown in the Airborne Wind Energy book [ADS13].](https://thumb-eu.123doks.com/thumbv2/123doknet/14743458.755507/40.892.157.789.148.576/figure-airborne-research-development-activities-country-airborne-energy.webp)
![Figure II.6: Presentation of the kite’s multi-body model [WLRO08].](https://thumb-eu.123doks.com/thumbv2/123doknet/14743458.755507/65.892.258.588.307.661/figure-ii-presentation-kite-multi-body-model-wlro.webp)