RESEARCH OUTPUTS / RÉSULTATS DE RECHERCHE
Author(s) - Auteur(s) :
Publication date - Date de publication :
Permanent link - Permalien :
Rights / License - Licence de droit d’auteur :
Bibliothèque Universitaire Moretus Plantin
Institutional Repository - Research Portal
Dépôt Institutionnel - Portail de la Recherche
researchportal.unamur.be
University of Namur
Community composition modifies direct and indirect effects of pesticides in freshwater food webs
Zhao, Qinghua ; DE LAENDER, Frederik; Van den Brink, Paul J. Published in:
Science of the Total Environment
DOI:
10.1016/j.scitotenv.2020.139531
Publication date:
2020
Document Version
Peer reviewed version
Link to publication
Citation for pulished version (HARVARD):
Zhao, Q, DE LAENDER, F & Van den Brink, PJ 2020, 'Community composition modifies direct and indirect effects of pesticides in freshwater food webs', Science of the Total Environment, vol. 739, 139531.
https://doi.org/10.1016/j.scitotenv.2020.139531
General rights
Copyright and moral rights for the publications made accessible in the public portal are retained by the authors and/or other copyright owners and it is a condition of accessing publications that users recognise and abide by the legal requirements associated with these rights. • Users may download and print one copy of any publication from the public portal for the purpose of private study or research. • You may not further distribute the material or use it for any profit-making activity or commercial gain
• You may freely distribute the URL identifying the publication in the public portal ?
Take down policy
If you believe that this document breaches copyright please contact us providing details, and we will remove access to the work immediately and investigate your claim.
1
Community composition modifies direct and indirect effects of pesticides in freshwater 1
food webs 2
Quinghua Zhaoa*, Frederik De Laenderb and Paul J. Van den Brinka,c
3
a Aquatic Ecology and Water Quality Management group, Wageningen University and
4
Research, P.O. Box 47, 6700 AA Wageningen, The Netherlands
5
b Research Unit of Environmental and Evolutionary Biology, Namur Institute of Complex
6
Systems, and Institute of Life, Earth, and the Environment, University of Namur, Rue de
7
Bruxelles 61, 5000,Namur, Belgium
8
c Wageningen Environmental Research, Wageningen University and Research, P.O. Box 47,
9
6700 AA Wageningen, The Netherlands
10
*Corresponding author, Email: [email protected]
11 12
Abstract 13
For environmental risk assessment, the effects of pesticides on aquatic ecosystems are often
14
assessed based on single species tests, disregarding the potential influence of community
15
composition. We, therefore, studied the influence of changing the horizontal (the number of
16
species within trophic levels) and vertical composition (number of trophic levels) on the
17
ecological effects of the herbicide linuron and the insecticide chlorpyrifos, targeting producers
18
and herbivores, respectively. We tested how adding, to a single primary producer, 4 selected
19
competing producer species, 0-1-4 selected herbivore species, and one selected predator
20
species resulting in 1, 2 and 3 trophic levels, changes the effects of the two pesticides.
21
Linuron decreased producer biovolume less (17%) when the 4 producers were added,
22
because insensitive producers compensated for the loss of sensitive producers. However,
23
linuron decreased producer biovolume 42% and 32% more as we increased the number of
2
herbivore species from 0 to 4 and as we increased trophic levels from 1 to 3, respectively. The
25
indirect negative effect of linuron on herbivore biovolume was 11% and 15% lower when more
26
producer and herbivores were added, respectively. Adding a predator increased this indirect
27
negative effect by 22%.
28
Chlorpyrifos decreased herbivore biovolume about 10% less when adding multiple herbivore
29
or producer species. However, adding a predator magnified the direct negative impact on
30
herbivores (13%). Increasing the number of producer, herbivore species and adding trophic
31
levels increased the indirect positive impact on producer biovolume (between 10% and 35%).
32
Our study shows that changing horizontal composition can both increase and decrease the
33
effects of the selected pesticides, while changing vertical composition by adding number of
34
trophic levels always increased these effects. Therefore, single species sensitivity will not
35
always represent a worst case estimate of ecological effects. Protecting the most sensitive
36
species may not ensure protection of ecosystems.
37
Keywords: 38
Producers, Herbivores, Vertical composition, Linuron, Chlorpyrifos
39
40
1. Introduction 41
Ecological risk assessment of chemicals is mainly based on the results of single-species
42
laboratory tests performed with algae, daphnia and fish, representing a limited set of standard
43
test species (Artigas et al., 2012; Brock et al., 2006; Rohr et al., 2016). However, community
44
composition in natural ecosystems often is more complex and how to address this difference
3
in community composition is considered one of the most difficult challenges in ecotoxicology
46
(De Laender and Janssen, 2013; Rohr et al., 2016; Van den Brink et al., 2018). Community
47
composition in natural systems can be characterised in two dimensions:the number of species
48
within trophic levels (horizontal composition) and number of trophic levels (vertical
49
composition). Both dimensions of composition could influence the effects of chemicals on
50
aquatic communities (Baert et al., 2016; De Laender et al., 2015; Zhao et al., 2019). Recent
51
work showed that the two dimensions had contrasting effects on the short-term stability of
52
whole food webs (using total biomass as a proxy) after pesticide exposure (Zhao et al., 2019).
53
However, how the two dimensions influence direct and indirect effects of chemicals after
54
prolonged exposure is at present unknown.
55
The direct negative effects of herbicides on population size of primary producers (hereafter
56
named ‘producers’) can be smaller when more producer species are added (Baert et al., 2016).
57
A more diverse producers’ community can include both sensitive and tolerant producers
58
(Baert et al., 2016). When environmental stressors reduce the population of sensitive
59
producers, negative interactions among producers result in competitive release, so that
60
reductions in populations of sensitive species can be compensated by an increase of tolerant
61
species (Baert et al., 2016; De Laender et al., 2016; Gonzalez and Loreau, 2009). In contrast,
62
the direct negative effects of herbicides on producer populations can be larger as more
63
herbivore species are added, because herbicides and herbivore grazing could interact to
64
aggravate the herbicide effects (Halstead et al., 2014; Rohr et al., 2006; Rohr and Crumrine,
65
2005). Conversely, the presence of a predator could suppress the herbivore population
66
(Anderson et al., 1996; Pace et al., 1999), and the resulting decrease in grazing pressure could
67
alleviate the direct negative effects of herbicides on producers.
4
The direct negative effects of insecticides on herbivores (population size) can be smaller as
69
more herbivore species are added, again due to compensation. A more diverse herbivores’
70
community can include both sensitive and tolerant herbivores, while more intolerant
71
herbivores have larger probability to be included (Becker and Liess, 2017). Insecticides
72
decrease the populations of sensitive herbivores, resulting in its resource (producers) being
73
released from grazing, which in turn can result in an increase of tolerant herbivores via an
74
increase of food resources (Rohr and Crumrine, 2005). The indirect benefit of insecticides on
75
tolerant herbivores can thus compensate the decline of sensitive herbivores .The insecticide
76
can also be hypothesized to affect herbivores less when more producer species are added,
77
because of an increased probability that an edible producer would occur that promotes
78
herbivore growth (Haddad et al., 2011). However, the insecticide could affect herbivore
79
population size more severely when a predator is present, because of synergistic interactions
80
between the insecticide and predation (Beketov and Liess, 2006; Relyea and Mills, 2001;
81
Trekels et al., 2013). For example, Relyea and Mills (2001) reported that the pesticide carbaryl
82
was 4 times more toxic to the prey (tadpoles) when a predator (Ambystoma maculatum) was
83
present. Some studies, however, showed that interactions between insecticides and presence
84
of a predator on herbivores can be additive or antagonistic (Campero et al., 2007; Janssens
85
and Stoks, 2017, 2013; Trekels et al., 2011).
86
The indirect effects of pesticides are also expected to depend on horizontal and vertical
87
composition. Herbicides could indirectly decrease herbivore population size, due to a
88
decrease in edible producer biomass (Bracewell et al., 2019; Fleeger et al., 2003; Preston,
89
2002). We expect that the herbicides could decrease herbivores even more when a predator
90
is present, due to an increase of both bottom-up and top-down control (Clements and Rohr,
91
2009; Rohr et al., 2006; Rohr and Crumrine, 2005). In addition, insecticides could, indirectly,
5
induce an increase of producer population size, because of the top-down induced release of
93
producers (Clements and Rohr, 2009; Halstead et al., 2014; Rohr et al., 2006; Rohr and
94
Crumrine, 2005). It is thus expected that the release of producers could be stronger when a
95
predator is present as this will serve as an extra top-down effect.
96
To test these hypotheses, we conducted microcosm experiments mimicking planktonic food
97
webs in which we added 4 selected competing producer species to a single producer, 0, 1 or
98
4 selected herbivore species, and one selected predator species. By doing so we also changed
99
vertical composition (1, 2 and 3 trophic levels). We then tested whether horizontal and vertical
100
composition influences either the effects of the herbicide linuron or the effect of insecticide
101
chlorpyrifos
102 103
2. Materials and Methods 104
2.1. Experimental conditions
105
We experimentally tested the effect of horizontal and vertical composition on simple food
106
webs exposed to pesticides. The experiments, which lasted for 21 days, were performed in
107
900 mL glass jars, filled with 500 ml WC medium and contained in a water bath at constant
108
temperature (19.9 °C ± 0.8 °C) and a light regime of 12h: 12h (light: dark). The light intensity
109
at the surface (measured with a LI-COR LI-250A, LI-COR Biosciences, Lincoln, USA) was 120
110
μmol m−2 s−1, and was created using Ceramalux® Phillips 430 Watt High Pressure Sodium
Non-111
Cycling Lamps.
112
2.2. Organisms
6
We obtained all producers and herbivores from cultures present at the Aquatic Ecology and
114
Water Quality Management group of Wageningen University. Five green alga (Scenedesmus
115
acutus, Chlorella vulgaris, Desmodesmus pannonicus, Raphidocelis subcapitata and
116
Scenedesmus obliquus) were randomly selected as producers while four cladoceran (Daphnia
117
magna, Daphnia pulex, Daphnia lumholtzi and Moina macrocopa) species were randomly
118
selected as herbivores. All these organisms were collected from Dutch lakes or ditches and
119
then cultivated in the lab. The algae were cultured in WC medium under continuous light. The
120
herbivores were cultured in RT medium using a natural day/night light rhythm (Tollrian, 1993)
121
and fed with algae C. vulgaris at 10-5 cell ml-1 day-1. One individual of Chaoborus obscuripes
122
was selected as a predator. C. obscuripes was collected from Sinderhoeve Experimental
123
Station (www.sinderhoeve.org; Renkum, The Netherlands). Before addition, C. obscuripes was
124
kept in a 5 L plastic bucket with 1.5 L pond water and 1.5 L WC medium, stored in a fridge
(4-125
7 °C) to slower the moulting and fed with cladocerans every three days. Before the
126
experiments started, herbivores and predators were separately moved into WC medium to
127
starve for 24 h, so that their guts were cleared of pre-fed food.
128
2.3. Experimental setup
129
To a single randomly selected primary producer (R. subcapitata), we added 4 producers, 0, 1,
130
or 4 selected herbivores, and one selected predator resulting in 1, 2 and 3 trophic levels
131
(vertical composition). The other four producers were S. acutus, C. vulgaris, D. pannonicus and
132
S. obliquus. The single herbivore was M. macrocopa (randomly assigned). The other three
133
herbivores were D. magna, D. pulex, and D. lumholtzi. The predator was C. obscuripes.
134
We adopted a design where we manipulated horizontal and vertical composition, as well as
135
the exposure to contaminants. To manipulate composition, we crossed horizontal
7
composition of the producers (two levels; 1 or 5 species) and horizontal composition of the
137
herbivores (three levels; 0, 1 or 4 species), resulting in 6 food-web structures. When
138
consumers were present, we also manipulated the presence of a predator (absent or present),
139
resulting in 4 more food-web structures. We therefore also manipulated vertical composition
140
(1, 2 and 3 trophic levels). This gives a total of 10 different food-web structures (Table S1). To
141
manipulate exposure to contaminants, we either exposed these compositions to the
142
insecticide chlorpyrifos (0 and 1 μg l-1), or the herbicide linuron (0 and 100 μg l-1). The 0 μg l-1
143
linuron and chlorpyrifos treatments served as controls. The nominal concentration of 100 μg
144
l-1 linuron was chosen because it is higher than the 72d EC
50 for relative growth inhibition of 6
145
μg l-1 for Scenedesmus acutus (Snel et al., 1998) and lower than the 21 days NOEC value (180
146
μg l-1) for reproduction of D. magna (Crane et al., 2007). It was expected that the
147
concentration had no direct toxic effect on herbivores but only on producers (Cuppen et al.,
148
1997; Slijkerman et al., 2005). The nominal chlorpyrifos concentration of 1 µg l-1 is the 48h LC 50
149
value for D. magna (Kersting and van Wijngaarden, 1992), so that treatment effects were
150
supposed to not completely eliminate the herbivores and allow recovery (Daam et al., 2008;
151
Van den Brink et al., 1996).
152
We replicated each treatment four times, leading to 10 food web structures x 2 contaminants
153
x 2 treatments (control and contaminant treatment) x 4 replicates = 160 vessels in total. The
154
initial total biovolume of producer and herbivores was always 25 mm3 and 0.2 mm3,
155
respectively, regardless of producer and herbivores richness. For the systems with all three
156
trophic levels, we added one individual of the predator C. obscuripes to each system. We made
157
sure the predators used in the experiments had a mean (±SD) individual body length of 10.46
158
± 0.11 mm to avoid a bias introduced by body size-dependent feeding rates.
8
2.4. Chemical application and analysis
160
All stock solutions for linuron and chlorpyrifos were created in a same way that 5 mL of stock
161
solution was diluted with WC medium to reach the desired concentration. For the stock
162
solution of linuron, we diluted the commercial product Afalon® Flow with a linuron
163
concentration of 450 mg ml-1 to 10 μg ml-1. The stock solution of chlorpyrifos was achieved by
164
diluting a commercial formulation Dursban® 4E, with a chlorpyrifos concentration of 480 mg
165
ml-1 to 0.1 μg ml-1. Then 5 mL of stock solution was added into the system. Each system was
166
filled WC medium up to 500 ml and stirred 15 seconds immediately before the start of the
167
experiment.
168
To monitor the chemical degradation during the experiment samples were taken after 1h, 2,
169
4, 6, 14 and 21 days of exposure. In order to analytically verify the linuron concentration of
170
each experimental jar, 2 mL of water sample was added to 0.5 ml methanol. The chemical
171
concentration was analysed according to Van den Brink et al. (1997), through Agilent
172
Technologies LC-QQQ Mass spectrometer with a binary pump, Bin Pump, model G1312A, with
173
MilliQ + 0.1% fatty acid as solvent A and methanol + 0.1 % fatty acid as solvent B with a ratio
174
of 20:80. For the chlorpyrifos analysis, 8 mL samples were taken from each system and then 2
175
ml n-hexane was added, followed by vortex for 1 minute under 1000 revolution per second. A
176
1mL subsample was transferred to a GC vial, then followed by GC and electron capture
177
detection to determine the exact concentration of chlorpyrifos (Rubach et al., 2011).
178
2.5. Ecological endpoints
179
We estimated the biovolume and composition of producers and herbivores, and biovolume of
180
predators in each replicate on day 2, 4, 6, 14 and 21 day after the beginning of the experiment.
181
At each sampling day, we first sampled the controls followed by the exposure jars to prevent
9
cross contamination. Producer biovolume (mm3 l−1) was measured with a CASY® Cell Counter
183
model TT (innovates AG CASY®- Technology). In order to estimate algae composition, 900 µl
184
algae samples were stained with 100 µl lugol preservative for microscopic enumeration of
185
algal cells using an inverted light-microscope (Nikon Eclipse E100 microscope with a
DS-2Mv-186
L2 camera; Nikon Corp., Tokyo, Japan) at 200 magnification. Herbivore biovolume (mm3 l−1) in
187
each replicate was calculated as abundance (individual l-1) times individual biovolume (mm3
188
individual−1). The individual biovolume (mm3 individual−1) of herbivores and predators were
189
measured by a formula 0.074 ∗ 𝐿2.92 (L is length in mm) (Horn, 1991), where the body length
190
was estimated using light microscopy Olympus szx10 (Olympus Corp, Tokyo, Japan) at 10
191
magnification. Abundance and composition was recorded after sucking all individuals into an
192
inverted 10 mL serological pipette to put into 50 ml culture dish that filled with 20 ml WC
193
medium. Afterwards herbivores and predators were put back in their beakers for next
194
sampling.
195
2.6. Data analyses
196
Biovolume or abundance were used to calculate the effect sizes for the producers, herbivores
197
and the predator, while chlorophyll a was used to compute effect size for photosynthetic
198
capacity. Effects sizes were calculated by dividing the value for the treatment by the mean of
199
control so that an effect size smaller than 1 indicates a negative impact of the chemical on the
200
producers, herbivores or the predator, a 1 no effect, while effect sizes larger than 1 indicates
201
a positive impact. To each of chemicals, three-way ANOVA’s were used to estimate the effects
202
of the horizontal composition of producers and herbivores, the vertical composition and with
203
all combination of interactions on the effect sizes of producers (abundance, biovolume,
204
chlorophyll a) and herbivores (abundance or biovolume) on sampling days 2, 4, 6, 14 and 21,
10
respectively, yielding 50 three-way ANOVA’s (5 response variables × 5 sample days × 2
206
pesticides). We adopted the same approach for the effect sizes of predator biovolume.
207
However, note that by definition, in the case of the presence of a predator, the vertical
208
composition was always three, so we could only analyse the effects of horizontal composition,
209
yielding 10 two-way ANOVA’s (1 response variables × 5 sample days × 2 pesticides).Normality
210
of model residuals was verified by the QQ-plot (Fig. S1–S2).
211
The effects of herbicide (insecticide) on producers (herbivores) were the largest on day 6 (see
212
results section). We used raw data (biovolume, density or chlorophyll a) on this day to
213
understand the interactions between treatments. The raw data were natural log-transformed
214
prior to analysis. For each pesticide data set, we applied four-way ANOVA’s to estimate the
215
effect of horizontal composition of producers and herbivores, vertical composition, pesticide
216
and their pairwise interactions, on (1) producers (abundance, biovolume and chlorophyll a)
217
and (2) herbivores (abundance and biovolume), respectively, yielding 10 four-way ANOVA’s (5
218
response variables × 2 pesticides). Normality of model residuals was verified by the QQ-plot
219
(Fig. S3–S4). We adopted the same statistical approach for the effect on predator biovolume.
220
However, note that by definition, vertical composition is always three when a predator is
221
present, so we could only analyse the effects of horizontal composition, yielding 2 three-way
222
ANOVA’s (1 response variable × 2 pesticides). Normality of model residuals was again verified
223
by the quantile–quantile (QQ) plot (Fig. S3–S4). Finally, to evaluate the effects on community
224
composition on day 6, the day with the maximum effects, we again used four-way ANOVA’s
225
to test the effect of horizontal composition of producers, herbivores and vertical composition,
226
pesticide and their pairwise interactions, on ln(biovolume) of (1) the producer species (R.
227
subcapitata, i.e. the single producer treatment) and (2) the herbivore species (M. macrocopa,
228
i.e. the single herbivore treatment). For the other four producer species (S. acutus, C. vulgaris,
11
D. pannonicus and S. obliquus), a three-way ANOVA’s was used to test the effect of horizontal
230
composition of herbivores, vertical composition, pesticides and their pairwise interactions on
231
ln(biovolume), because the horizontal composition of producers was always five. Similarly, we
232
used three-way ANOVA’s to test the effect of horizontal composition of producers, vertical
233
composition, pesticide and their pairwise interactions on ln(biovolume) of each of the rest
234
three herbivore species (D. magna, D. pulex, and D. lumholtzi), because the horizontal
235
composition of herbivores was always four. The analysis of community composition yielded
236
18 ANOVA’s (9 response variables × 2 pesticides). Normality of model residuals was again
237
verified by the quantile–quantile (QQ) plot (Fig. S5–S6).
238 239
3. Results and discussion 240
3.1. Pesticide concentration
241
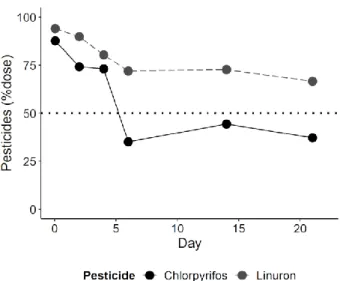
The mean start concentrations for linuron and chlorpyrifos in the experimental systems were
242
94.2 (± 8.4)% and 87.8 (± 9.4)% of the nominal concentrations, respectively (Fig 1). The
243
dissipation half-life (DT50) for linuron could not be calculated (> 21 d; Fig 1), while the DT50
244
of chlorpyrifos was between 5-8 days. The observed persistence of linuron and chlorpyrifos
245
were in line with those observed in other planktonic systems by Daam et al. (2008, 2009) and
246
Daam and Van den Brink (2007)who reported DT50 values of > 21 days for linuron and 6-10 d
247
for chlorpyrifos.
248
3.2. Effect of linuron
249
3.2.1 Influence of community composition on direct effects
12
Throughout experiments, the direct negative effect of the herbicide linuron on producer
251
biovolume was, on average, 17% smaller when the 4 producer species were added (Fig. 2a).
252
However, this direct negative effect was 42% larger when the number of herbivore species
253
was increased from 0 to 4 and 32% larger when vertical composition was changed from 1 to 3
254
(Fig. 2b-c). On day 6, linuron had its maximum effect on producer biovolume (Fig. 2a-c). The
255
negative effect of linuron on producer biovolume was larger when adding more herbivore
256
species and when vertical composition was higher, regardless of the composition of the
257
producer community (Fig. 3a-b). The negative effects were strongest when the number of
258
producer species was lowest, the number of herbivore species highest, and vertical
259
composition equal to 2 (Fig. 3a). These trends were similar when using chlorophyll a
260
(photosynthetic capacity) as an endpoint (Fig S7. a-c; Fig S8. a-b).
261
Adding producers decreased the direct negative effect on producer biovolume (Fig. 2a) and
262
chlorophyll a (Fig S7. a-c), due to the decrease of sensitive chlorophytes biovolume (e.g. R.
263
subcapitata and C. vulgaris) compensated by other tolerant chlorophytes (e.g. S. obliquus) (Fig.
264
4a). R. subcapitata, previously known as Selenastrum capricornutum and Pseudokirchneriella
265
subcapitata, has a 5d EC50 of 67 µg l-1 based on abundance (USEPA, 2020), explaining its
266
decrease in biovolume (Fig. 4a). C. vulgaris and to a lesser extent S. acutus also show a
267
decrease in biovolume, which can be explained by their 7d EC50 of 50 µg l-1 also based on
268
abundance and 3d EC50 of 8.9 µg l-1 based on population growth rate, respectively (Stephenson
269
and Kane, 1984; USEPA, 2020). The other two species, D. pannonicus and S. obliquus, showed
270
no response or an increase in biovolume (Fig. 4a) and, unfortunately, no sensitivity data is
271
available, but S. obliquus became relatively abundant in small plankton dominated
272
microcosms stressed by 150 µg l-1 linuron (Daam and Van den Brink, 2007). Some semi-field
273
experiments also showed that linuron had both positive and negative effects on Chlorophytes
13
(Daam et al., 2009; Slijkerman et al., 2005; Van den Brink et al., 1997). For example, Daam et
275
al. (2009)reported that some of chlorophytes (e.g., Coelastrum cambricum and Pediastrum
276
duplex) decreased in population size, which was compensated by increases of other
277
chlorophytes (e.g., Ankistrodesmus falcatus, Oocystis pusilla and Oocystis lacustris).
278
In contrast, the negative impact of linuron on producers was larger when more herbivores
279
were added (Fig. 2b), due to a larger suppression of producer biovolume (e.g. C. vulgaris) (Fig.
280
4a) when multiple herbivores were present. Multiple herbivore species more effectively
281
reduce producer population sizes than a single herbivore species because of larger
282
consumption rates (Duffy et al., 2003; Naeem and Li, 1998).
283
The presence of a predator (C. obscuripes) decreased the biovolume of the herbivores (Fig.
3c-284
d; Fig. 4b), as has also been reported by Black and Dodson (1990) and Hebert and Grewe
285
(1985), due to predation. The presence of the predator hence alleviated the grazing pressure
286
on producers, which made the direct negative effect of linuron on producers smaller than the
287
treatments with producers and herbivores only, i.e. vertical composition=2, (Fig. 2c). However,
288
the presence of the predator did not eliminate all herbivores. Thus, the herbivores still
289
consumed producers (e.g., especially small sized C. vulgaris) (Fig. 4a). Hence, the presence of
290
a predator and herbivores still made the negative effect of linuron on producers larger than
291
the negative effect of linuron on producers in treatments where only producers were present,
292
i.e. when vertical composition was equal to 1, (Fig. 2c).
293
3.2.2 Influence of community composition on indirect effects
294
The herbicide-induced decrease of producers led to indirect negative effects on herbivore
295
biovolume (Fig. 2d-f). Some semi-field experiments found both negative and positive impacts
296
of linuron on herbivores (Cuppen et al., 1997; Daam et al., 2009). For example, Cuppen et al.
14
(1997) reported negative effects of linuron on Rotatoria but positive effects on Copepoda.
298
They attributed these negative and positive linuron effects to the preferred resources of these
299
herbivores, i.e. diatoms for Rotatoria and Chlamydomonas for Copepoda, respectively, the
300
latter showing a large increase in the linuron stressed systems (Van den Brink et al., 1997).
301
Here, we only found negative effects of linuron on herbivores, which can be attributed to
302
herbivores consuming all producer species and the overall decrease in biovolume of the algae
303
species (Fig. 4a) as no adaptation was found like as by Van den Brink et al. (1997).
304
In addition, the indirect negative effect of linuron on herbivore biovolume was 11% smaller
305
when 4 producers were added and 15% smaller when the number of herbivore species was
306
increased from 1 to 4 (Fig. 2d-e). This was because adding more producers and herbivores
307
caused an increase of the absolute biovolume of herbivores on day 6 (Fig. 4b). However, the
308
indirect negative effect of linuron on herbivores was 22% larger when vertical composition
309
was changed from 2 to 3 (Fig. 2f), because predation decreased the absolute biovolume of
310
each herbivore species (Fig. 4b). On day 6, linuron also had its maximum effect on herbivore
311
biovolume (Fig. 2d-f). The negative effect of linuron on herbivore biovolume was smaller when
312
more producers and herbivores were present, independent of vertical composition (Fig 3c-d).
313
The negative effects were smallest when the number of producer species was highest, the
314
number of herbivore species highest and the vertical composition equal to 2 (Fig 3c). We
315
detected qualitatively identical results (single and interactive effects) using abundance as a
316
proxy (Fig S7d–7i; Fig. S8), even though the magnitude of decreases and increases was smaller.
317
We did not detect significant effect of composition on the predator biovolume (Table S2).
318
3.3. Effect of chlorpyrifos
319
3.3.1 Influence of community composition on direct effects
15
As found for linuron, the direct effect of chlorpyrifos also depended on horizontal and vertical
321
composition. The direct negative effect on herbivore biovolume was, on average, 7% smaller
322
when the number of herbivore species was increased from 1 to 4 and 12% smaller when 4
323
producers were added, while the negative direct effect was 13% larger when vertical
324
composition was changed by adding a predator (Fig. 5a-c). On day 6, chlorpyrifos also had its
325
maximum effect on herbivore biovolume (Fig. 5a-c). The negative effect of chlorpyrifos on
326
herbivore biovolume was smaller with adding more producers and more herbivores across
327
any level of vertical composition (Fig 6a-b). The negative effects were smallest when the
328
number of producer species was highest, the number of herbivore species highest, and the
329
vertical composition equal to 2 (Fig 6a).
330
The negative direct effect of chlorpyrifos on herbivores was smaller when adding more
331
herbivores (Fig. 5b), which was associated with the loss of sensitive herbivores (e.g. M.
332
macrocopa, D. magna and D. pulex) being compensated by other more tolerant herbivores
333
(e.g. D. lumholtzi) (Fig, 7a). Only for D. magna, M. macrocopa and D. pulex, single species
334
toxicity values could be found with 2-6d EC50 values of 0.20, 0.27 and 0.21 µg l-1, respectively
335
(Na et al., 2012; USEPA, 2020), explaining their decrease. The compensation of sensitive
336
species by more tolerant ones has been shown previously (Daam et al., 2008; Van Wijngaarden
337
et al., 2005). For example, Daam et al. (2008) showed that the decrease of Cladocera (e.g.
338
Streblocerus pygmaeus) by chlorpyrifos was compensated by other tolerant Cladocera (e.g.
339
Dunhevedia crassa).
340
In addition, we found that the direct negative effect of chlorpyrifos on the herbivore
341
population was smaller when adding more of its resource (i.e. producer) (Fig. 5a), due to
342
higher producers increasing the biovolumes of herbivores (e.g. D. lumholtzi) (Fig. 7a). However,
16
the presence of a predator C. obscuripes made the negative effect of chlorpyrifos on
344
herbivores larger (Fig. 5c; Fig. 6a-b), as expected (Relyea and Mills, 2001; Van den Brink et al.,
345
2017). For example, Relyea and Mills (2001) showed that, if a predator (Ambystoma
346
maculatum) was present, the pesticide carbaryl was 4 times more toxic to the prey (tadpoles).
347
Predation and chlorpyrifos has similar effects, and can produce synergistic effects when
348
combined (Relyea and Mills, 2001).
349
3.3.2 Influence of community composition on indirect effects
350
The chlorpyrifos-induced decrease of herbivores resulted in indirect positive effects on
351
producer biovolume (Fig. 5d-f), as found by Daam and Van den Brink (2007). This indirect
352
positive effect was 10% stronger when 4 producers were added (10% stronger), the number
353
of herbivore species was increased from 1 to 4 (35% stronger) and vertical composition was
354
changed from 1 to 3 (33% stronger) (Fig. 5d-f). On day 6, chlorpyrifos also had a maximum
355
effect on producer biovolume (Fig. 5d-f). The positive effect of chlorpyrifos on producer
356
biovolume was highest when the number of producer species was highest, more trophic levels
357
were present and the number of herbivore species equal to 1 (Fig 6c-d). The indirect positive
358
effect on chlorophyll a was qualitatively similar (Fig. S9a-9c; Fig. S10a-b), but no significant
359
effect of composition on predator biovolume was detected (Table S3). Again, we found
360
qualitatively identical results (single and interactive effects) using abundance as proxy (Fig.
361
S9d–9i; Fig. S10c-f).
362
The positive effect on producer biovolume (and chlorophyll a) can be understood from the
363
release of grazing. The decrease of herbivores especially promoted the growth of its producer
364
food source (e.g. D. pannonicus) (Fig. 7b). The increase was reinforced by adding producers,
365
herbivores and trophic levels (Fig. 7b), making the positive effect on producer biovolume (and
17
chlorophyll a) larger (Fig. 5d-f; Fig. S9). Previous studies only reported chlorpyrifos-induced
367
increase of producers (Daam et al., 2008; Daam and Van den Brink, 2007). For example, Daam
368
and Van den Brink (2007) showed that chlorpyrifos application decreased herbivore
369
abundances (Cladocera) and consequently caused an increase in chlorophyll a levels. We
370
further showed that the increase of producers could be reinforced by both horizontal and
371
vertical composition, as explained above.
372
3.4. Compositional and diversity effects
373
It should be noted that the compositional effects we report on here cannot be readily
374
translated to diversity effects. In order to directly test for horizontal and vertical diversity
375
effects, composition should be replicated within each diversity level, as done in
biodiversity-376
ecosystem function research (De Laender et al., 2016). Instead, our design should be
377
understood as a test of the effects of embedding a reference set of selected single producer
378
and consumer species (R. subcapitata and M. macrocopa respectively) into a community of
379
increasing complexity. While we selected this reference set randomly, future works could base
380
this selection on occurrence frequency. C. vulgaris and D. pulex, for example, are dominant
381
green alga and Cladocera in many natural lakes and ponds, and could therefore have been
382
chosen as our reference set (Cohen and Post, 1993; Hassan and Alkam, 2008; Hebert and
383
Finston, 2001; Steiner, 2002; Sze, 1980; Tiwari and Chauhan, 2006; Wen et al., 2005).
384
Speculating how such an alternative selection of the reference set would have changed our
385
results is not straightforward, as this will depend on both the sensitivity and the ecology of
386
the species (Baert et al., 2017). When based solely on sensitivity arguments, we do not expect
387
selecting this different reference set would have changed our results considerably. Indeed,
388
toxicity data suggest that the consumers D. pulex and M. macrocopa have similar sensitivities
18
for the chlorpyrifos, as do the producers R. subcapitata and C. vulgaris herbicide linuron (Table
390
S4). We further expect that, again based on sensitivity arguments only, our conclusions
391
regarding composition effects will also be valid when we should have selected other species
392
(i.e. the producer S. acutus and the herbivore D. magna), as their sensitivity is similar to that
393
of our chosen reference set (Table S4).
394 395
5. Conclusions 396
Our experiment and analyses demonstrate that the direct and indirect effect of pesticides on
397
aquatic ecosystems depends on horizontal and vertical composition. From these results, the
398
following main conclusions can be drawn: (1) changing horizontal composition by adding
399
species to our reference species increased or decreased the (in)direct effect of pesticides,
400
depending on the type of pesticide used; (2) changing vertical composition by adding trophic
401
levels always made (in)direct effects larger, regardless of the type of pesticide used. One
402
important implication of our results is that the effects of pesticides on single species do not
403
always correspond to worst-case scenarios and that protecting the most sensitive species does
404
not protect the whole ecosystem. Given that community composition of natural systems
405
widely varies between and within systems, we call for more research on how horizontal and
406
vertical composition and diversity affect food-web resistance and resilience. Such studies will
407
improve our understanding of the interaction between toxicological and ecological
408
mechanisms, which is greatly needed to improve our understanding of the environmental
409
impacts of chemicals and their risk assessment (Van den Brink et al., 2018).
410
19 Declaration of Competing Interest
412
The authors declare that we have no conflicts of interest to this work and there are no
413
competing financial interests. We declare that all authors agreed to the contents in
414
manuscript.
415
Acknowledgement 416
We thank Silke Vollbrecht, Frits Gillissen and Marlies Vollebregt for their assistance during the
417
experiments. We thank Sanne van den Berg, Anna Huang, Lara Schuijt, Markus Hermann and
418
Annika Mangold-Döring for valuable suggestions. We also thank the cooperation of all other
419
participants in this study. QHZ is supported by the China Scholarship Council (No.
420
201606190229).
421
References 422
Anderson, J.S., Teutsch, M., Dong, Z., Delgado-lo, F., Nu-, F., Vera, J.C., Hajra, A., Schro, E.,
423
Ried, T., Liu, P.P., Collins, F.S., 1996. A meta-analysis of the freshwater trophic cascade.
424
Proc. Natl. Acad. Sci. 93, 7723–7726.https://doi.org/10.1073/pnas.93.15.7723
425
Artigas, J., Arts, G., Babut, M., Caracciolo, A.B., Charles, S., Chaumot, A., Combourieu, B.,
426
Dahllöf, I., Despréaux, D., Ferrari, B., Friberg, N., Garric, J., Geffard, O., Gourlay-Francé,
427
C., Hein, M., Hjorth, M., Krauss, M., De Lange, H.J., Lahr, J., Lehtonen, K.K., Lettieri, T.,
428
Liess, M., Lofts, S., Mayer, P., Morin, S., Paschke, A., Svendsen, C., Usseglio-Polatera, P.,
429
Van den Brink, N., Vindimian, E., Williams, R., 2012. Towards a renewed research
430
agenda in ecotoxicology. Environ. Pollut. 160, 201–206.
431
https://doi.org/10.1016/j.envpol.2011.08.011
432
Baert, J.M., De Laender, F., Janssen, C.R., 2017. The Consequences of Nonrandomness in
433
Species-Sensitivity in Relation to Functional Traits for Ecosystem-Level Effects of
434
Chemicals. Environ. Sci. Technol. 51, 7228–7235.
435
https://doi.org/10.1021/acs.est.7b00527
436
Baert, J.M., De Laender, F., Sabbe, K., Janssen, C.R., 2016. Biodiversity increases functional
437
and compositional resistance, but decreases resilience in phytoplankton communities.
438
Ecology 97, 3433–3440. https://doi.org/10.1002/ecy.1601
439
Becker, J.M., Liess, M., 2017. Species Diversity Hinders Adaptation to Toxicants. Environ. Sci.
440
Technol. 51, 10195–10202. https://doi.org/10.1021/acs.est.7b02440
441
Beketov, M.A., Liess, M., 2006. The influence of predation on the chronic response of
442
Artemia sp. populations to a toxicant. J. Appl. Ecol. 43, 1069–1074.
443
https://doi.org/10.1111/j.1365-2664.2006.01226.x
444
Black, A.R., Dodson, S.I., 1990. Demographic costs of Chaoborus-induced phenotypic
20
plasticity in Daphnia pulex. Oecologia 83, 117–122.
446
https://doi.org/10.1007/BF00324642
447
Bracewell, S., Verdonschot, R.C.M., Schäfer, R.B., Bush, A., Lapen, D.R., Van den Brink, P.J.,
448
2019. Qualifying the effects of single and multiple stressors on the food web structure
449
of Dutch drainage ditches using a literature review and conceptual models. Sci. Total
450
Environ. 684, 727–740. https://doi.org/10.1016/j.scitotenv.2019.03.497
451
Brock, T.C., Arts, G.H., Maltby, L., Van den Brink, P.J., 2006. Aquatic risks of pesticides,
452
ecological protection goals, and common aims in European Union Legislation. Integr.
453
Environ. Assess. Manag. 2, e20–e46. https://doi.org/10.1002/ieam.5630020402
454
Campero, M., Slos, S., Ollevier, F., Stoks, R., 2007. Sublethal pesticide concentrations and
455
predation jointly shape life history: Behavioral and physiological mechanisms. Ecol.
456
Appl. 17, 2111–2122. https://doi.org/10.1890/07-0442.1
457
Clements, W.H., Rohr, J.R., 2009. Community responses to contaminants: using basic
458
ecological principles to predict ecotoxicological effects. Environ. Toxicol. Chem. 28,
459
1789–1800. https://doi.org/10.1897/09-140.1
460
Cohen, I., Post, A.F., 1993. The heterotrophic connection in a photoautotrophic chlorella
461
vulgaris dominant in wastewater oxidation ponds. Water Sci. Technol. 27, 151–155.
462
https://doi.org/10.2166/wst.1993.0546
463
Crane, M., Maycock, D., Watts, C.D., Atkinson, C., Johnson, I., 2007. Proposed EQS for Water
464
Framework Directive Annex VIII substances: 2,4- dichlorophenol.
465
Cuppen, J.G.M., Van den Brink, P.J., Hartgers, E.M., Fettweis, U., Crum, S.J.H., Van Donk, E.,
466
Brock, T.C.M., 1997. Sensitivity of macrophyte-dominated freshwater microcosms to
467
chronic levels of the herbicide linuron. Ecotoxicol. Environ. Saf. 38, 13–24.
468
https://doi.org/10.1006/eesa.1997.1555
469
Daam, M.A., Rodrigues, A.M.F., Van den Brink, P.J., Nogueira, A.J.A., 2009. Ecological effects
470
of the herbicide linuron in tropical freshwater microcosms. Ecotoxicol. Environ. Saf. 72,
471
410–423. https://doi.org/10.1016/j.ecoenv.2008.07.009
472
Daam, M.A., Van den Brink, P.J., 2007. Effects of chlorpyrifos, carbendazim, and linuron on
473
the ecology of a small indoor aquatic microcosm. Arch. Environ. Contam. Toxicol. 53,
474
22–35. https://doi.org/10.1007/s00244-006-0001-y
475
Daam, M.A., Van den Brink, P.J., Nogueira, A.J.A., 2008. Impact of single and repeated
476
applications of the insecticide chlorpyrifos on tropical freshwater plankton
477
communities. Ecotoxicology 17, 756–771. https://doi.org/10.1007/s10646-008-0227-8
478
Darbro, J.M., Johnson, P.H., Thomas, M.B., Ritchie, S.A., Kay, B.H., Ryan, P.A., 2012. Effects of
479
Beauveria bassiana on survival, blood-feeding success, and fecundity of Aedes aegypti
480
in laboratory and semi-field conditions. Am. J. Trop. Med. Hyg. 86, 656–664.
481
https://doi.org/10.4269/ajtmh.2012.11-0455
482
De Laender, F., Janssen, C.R., 2013. Brief communication: The ecosystem perspective in
483
ecotoxicology as a way forward for the ecological risk assessment of chemicals. Integr.
484
Environ. Assess. Manag. 9, e34–e38. https://doi.org/10.1002/ieam.1428
485
De Laender, F., Morselli, M., Baveco, H., Van den Brink, P.J., Di Guardo, A., 2015.
486
Theoretically exploring direct and indirect chemical effects across ecological and
487
exposure scenarios using mechanistic fate and effects modelling. Environ. Int. 74, 181–
488
190. https://doi.org/10.1016/j.envint.2014.10.012
489
De Laender, F., Rohr, J.R., Ashauer, R., Baird, D.J., Berger, U., Eisenhauer, N., Grimm, V.,
490
Hommen, U., Maltby, L., Meliàn, C.J., Pomati, F., Roessink, I., Radchuk, V., Van den
491
Brink, P.J., 2016. Reintroducing Environmental Change Drivers in Biodiversity–
21
Ecosystem Functioning Research. Trends Ecol. Evol. 31, 905–915.
493
https://doi.org/10.1016/j.tree.2016.09.007
494
Duffy, J.E., Cardinale, B.J., France, K.E., McIntyre, P.B., Thébault, E., Loreau, M., 2007. The
495
functional role of biodiversity in ecosystems: Incorporating trophic complexity. Ecol.
496
Lett. 10, 522–538. https://doi.org/10.1111/j.1461-0248.2007.01037.x
497
Duffy, J.E., Paul, J., Elizabeth, A., 2003. Grazer diversity effects on ecosystem functioning in
498
seagrass beds. Ecol. Lett. 6, 637–645.
499
Fleeger, J.W., Carman, K.R., Nisbet, R.M., 2003. Indirect effects of contaminants in aquatic
500
ecosystems. Sci. Total Environ. 317, 207–233.
https://doi.org/10.1016/S0048-501
9697(03)00141-4
502
Gonzalez, A., Loreau, M., 2009. The Causes and Consequences of Compensatory Dynamics in
503
Ecological Communities. Annu. Rev. Ecol. Evol. Syst. 40, 393–414.
504
https://doi.org/10.1146/annurev.ecolsys.39.110707.173349
505
Haddad, N.M., Crutsinger, G.M., Gross, K., Haarstad, J., Tilman, D., 2011. Plant diversity and
506
the stability of foodwebs. Ecol. Lett. 14, 42–46.
https://doi.org/10.1111/j.1461-507
0248.2010.01548.x
508
Halstead, N.T., Mcmahon, T.A., Johnson, S.A., Raffel, T.R., Romansic, J.M., Crumrine, P.W.,
509
Rohr, J.R., 2014. Community ecology theory predicts the effects of agrochemical
510
mixtures on aquatic biodiversity and ecosystem properties. Ecol. Lett. 17, 932–941.
511
https://doi.org/10.1111/ele.12295
512
Hassan, F.M., Alkam, F., 2008. Phytoplankton and related nutrients in sawa lake, iraq. J.
513
Dohuk Univ. 11, 67–76. https://doi.org/10.1016/B978-0-12-410416-7.00009-4
514
Hebert, P.D.N., Finston, T.L., 2001. Macrogeographic patterns of breeding system diversity in
515
the Daphnia pulex group from the United States and Mexico. Heredity (Edinb). 87, 153–
516
161. https://doi.org/10.1046/j.1365-2540.2001.00885.x
517
Hebert, P.D.N., Grewe, P.M., 1985. Chaoborus‐induced shifts in the morphology of Daphnia
518
ambigua. Limnol. Oceanogr. 30, 1291–1297.https://doi.org/10.4319/lo.1985.30.6.1291
519
Horn, W., 1991. The influence of biomass and structure of the crustacean plankton on the
520
water transparency in the Saidenbach storage reservoir. Hydrobiologia 225, 115–120.
521
https://doi.org/10.1007/BF00028390
522
Janssens, L., Stoks, R., 2017. Chlorpyrifos-induced oxidative damage is reduced under
523
warming and predation risk: Explaining antagonistic interactions with a pesticide.
524
Environ. Pollut. 226, 79–88. https://doi.org/10.1016/j.envpol.2017.04.012
525
Janssens, L., Stoks, R., 2013. Synergistic effects between pesticide stress and predator cues:
526
Conflicting results from life history and physiology in the damselfly Enallagma
527
cyathigerum. Aquat. Toxicol. 132–133, 92–99.
528
https://doi.org/10.1016/j.aquatox.2013.02.003
529
Kersting, K., van Wijngaarden, R., 1992. Effects of chlorpyrifos on a microecosystem. Environ.
530
Toxicol. Chem. 11, 365–372. https://doi.org/10.1002/etc.5620110310
531
Na, W., Lili, L., Kaifeng, S., Shunshan, D., 2012. Analysis of structure -activity relationship and
532
toxicity of organophosphorus pesticide to plankton. Ecol. Environ. Sci. 21, 118–123.
533
Naeem, S., Li, S., 1998. Consumer species richness and autotrophic biomass. Ecology 79,
534
2603–2615. https://doi.org/10.1890/0012-9658(1998)079[2603:CSRAAB]2.0.CO;2
535
Pace, M.L., Cole, J.J., Carpenter, S.R., Kitchell, J.F., 1999. Trophic cascades revealed in diverse
536
ecosystems. Trends Ecol. Evol. 14, 483–488.
537
Preston, B.L., 2002. Indirect effects in aquatic ecotoxicology: Implications for ecological risk
538
assessment. Environ. Manage. 29, 311–323.
22
1
540
Relyea, R.A., Mills, N., 2001. Predator-induced stress makes the pesticide carbaryl more
541
deadly to gray treefrog tadpoles (Hyla versicolor). Proc. Natl. Acad. Sci. U. S. A. 98,
542
2491–2496. https://doi.org/10.1073/pnas.031076198
543
Rohr, J.R., Crumrine, P.W., 2005. Effects of an herbicide and an insecticide on pond
544
community structure and processes. Ecol. Appl. 15, 1135–1147.
545
https://doi.org/10.1890/03-5353
546
Rohr, J.R., Kerby, J.L., Sih, A., 2006. Community ecology as a framework for predicting
547
contaminant effects. Trends Ecol. Evol. 21, 606–613.
548
https://doi.org/10.1016/j.tree.2006.07.002
549
Rohr, J.R., Salice, C.J., Nisbet, R.M., 2016. The pros and cons of ecological risk assessment
550
based on data from different levels of biological organization. Crit. Rev. Toxicol. 46,
551
756–784. https://doi.org/10.1080/10408444.2016.1190685
552
Rubach, M.N., Crum, S.J.H., Van den Brink, P.J., 2011. Variability in the dynamics of mortality
553
and immobility responses of freshwater arthropods exposed to chlorpyrifos. Arch.
554
Environ. Contam. Toxicol. 60, 708–721. https://doi.org/10.1007/s00244-010-9582-6
555
Slijkerman, D.M.E., Moreira-Santos, M., Jak, R.G., Ribeiro, R., Soares, A.M.V.M., Van Straalen,
556
N.M., 2005. Functional and structural impact of linuron on a freshwater community of
557
primary producers: The use of immobilized algae. Environ. Toxicol. Chem. 24, 2477–
558
2485. https://doi.org/10.1897/04-658R.1
559
Snel, J.F.H., Vos, J.H., Gylstra, R., Brock, T.C.M., 1998. Inhibition of photosystem II (PSII)
560
electron transport as a convenient endpoint to assess stress of the herbicide linuron on
561
freshwater plants. Aquat. Ecol. 32, 113–123. https://doi.org/10.1023/A:1009971930626
562
Srivastava, D.S., Bell, T., 2009. Reducing horizontal and vertical diversity in a foodweb
563
triggers extinctions and impacts functions. Ecol. Lett. 12, 1016–1028.
564
https://doi.org/10.1111/j.1461-0248.2009.01357.x
565
Steiner, C.F., 2002. Context-dependent effects of Daphnia pulex on pond ecosystem
566
function: Observational and experimental evidence. Oecologia 131, 549–558.
567
https://doi.org/10.1007/s00442-002-0934-4
568
Stephenson, R.R., Kane, D.F., 1984. Persistence and Effects of Chemicals in Small Enclosures
569
in Ponds R. Arch. Environ. Contam. Toxicol. 13, 313–326.
570
Sze, P., 1980. Seasonal succession of phytoplankton in Onondaga Lake, New York (USA).
571
Phycologia 19, 54–59.
572
Tiwari, A., Chauhan, S.V.S., 2006. Seasonal phytoplanktonic diversity of Kitham lake, Agra. J.
573
Environ. Biol. 27, 35–38.
574
Tollrian, R., 1993. Neckteeth formation in Daphnia pulex as an example of continuous
575
phenotypic plasticity: morphological effects of Chaoborus kairomone concentration and
576
their quantification. J. Plankton Res. 15, 1309–1318.
577
https://doi.org/10.1093/plankt/15.11.1309
578
Trekels, H., Van de Meutter, F., Stoks, R., 2013. Predator cues magnify effects of the
579
pesticide endosulfan in water bugs in a multi-species test in outdoor containers. Aquat.
580
Toxicol. 138–139, 116–122. https://doi.org/10.1016/j.aquatox.2013.04.008
581
Trekels, H., Van de Meutter, F., Stoks, R., 2011. Effects of species-specific interactions with
582
predation risk on the relative species sensitivities to a pesticide in water boatmen
583
(Corixidae). Oikos 120, 897–905. https://doi.org/10.1111/j.1600-0706.2010.18852.x
584
USEPA, 2020. Sustainable Materials Management: The Road Ahead;U.S., Environmental
585
Protection Agency: Washington, DC, June 2009. https://doi.org/10.1021/es202079y
23
Van den Brink, P.J., Boxall, A.B.A., Maltby, L., Brooks, B.W., Rudd, M.A., Backhaus, T.,
587
Spurgeon, D., Verougstraete, V., Ajao, C., Ankley, G.T., Apitz, S.E., Arnold, K., Brodin, T.,
588
Cañedo-Argüelles, M., Chapman, J., Corrales, J., Coutellec, M.A., Fernandes, T.F., Fick, J.,
589
Ford, A.T., Giménez Papiol, G., Groh, K.J., Hutchinson, T.H., Kruger, H., Kukkonen, J.V.K.,
590
Loutseti, S., Marshall, S., Muir, D., Ortiz-Santaliestra, M.E., Paul, K.B., Rico, A.,
Rodea-591
Palomares, I., Römbke, J., Rydberg, T., Segner, H., Smit, M., van Gestel, C.A.M., Vighi,
592
M., Werner, I., Zimmer, E.I., van Wensem, J., 2018. Toward sustainable environmental
593
quality: Priority research questions for Europe. Environ. Toxicol. Chem. 37, 2281–2295.
594
https://doi.org/10.1002/etc.4205
595
Van den Brink, P.J., Hartgers, E.M., Fettweis, U., Crum, S.J.H., Van Donk, E., Brock, T.C.M.,
596
1997. Sensitivity of macrophyte-dominated freshwater microcosms to chronic levels of
597
the herbicide linuron. Ecotoxicol. Environ. Saf. 38, 13–24.
598
https://doi.org/10.1006/eesa.1997.1555
599
Van den Brink, P.J., Klein, S.L., Rico, A., 2017. Interaction between stress induced by
600
competition, predation, and an insecticide on the response of aquatic invertebrates.
601
Environ. Toxicol. Chem. 36, 2485–2492. https://doi.org/10.1002/etc.3788
602
Van den Brink, P.J., Van Wijngaarden, R.P.A., Lucassen, W.G.H., Brock, T.C.M., Leeuwangh,
603
P., 1996. Effects of the insecticide Dursban® 4E (active ingredient chlorpyrifos) in
604
outdoor experimental ditches: II. Invertebrate community responses and recovery.
605
Environ. Toxicol. Chem. 15, 1143–1153. https://doi.org/10.1002/etc.5620150719
606
Van Wijngaarden, R.P.A., Brock, T.C.M., Douglas, M.T., 2005. Effects of chlorpyrifos in
607
freshwater model ecosystems: The influence of experimental conditions on
608
ecotoxicological thresholds. Pest Manag. Sci. 61, 923–935.
609
https://doi.org/10.1002/ps.1084
610
Wang, S., Brose, U., 2018. Biodiversity and ecosystem functioning in food webs: the vertical
611
diversity hypothesis. Ecol. Lett. 21, 9–20. https://doi.org/10.1111/ele.12865
612
Wen, Z., Mian-Ping, Z., Xian-Zhong, X., Xi-Fang, L., Gan-Lin, G., Zhi-Hui, H., 2005. Biological
613
and ecological features of saline lakes in northern Tibet, China. Hydrobiologia 541, 189–
614
203. https://doi.org/10.1007/s10750-004-5707-0
615
Zhao, Q., Van, P.J. den B., Carpentier, C., Wang, Y.X.G., Rodrıguez-Sanchez, P., Xu, C.,
616
Vollbrecht, S., Gillissen, F., Vollebregt, M., Wang, S., Laender, F. De, 2019. Horizontal
617
and vertical diversity jointly shape food web stability against small and large
618
perturbations. Ecol. Lett. 22, 1152–1162. https://doi.org/10.1111/ele.13282
619 620 621
24
622
Figures 623
624
Figure 1. Concentration of linuron and chlorpyrifos in systems on sample 1h and day 2, 4, 6, 625
14 and 21.
626 627 628
25
629
630
Figure 2. The effects of horizontal composition of producer and herbivore, and vertical 631
composition on effect sizes (biovolume as proxy) of producers (A-C), herbivores (D-F) after
632
exposure to linuron. Plotted are sample mean ± 1 SE. An effect size is 1 (treatment = control)
633
indicating no effect of linuron, smaller than 1 (treatment < control) indicating a negative effect
634
of linuron, and bigger than 1 (treatment > control) indicating a positive impact. The bigger
635
deviation from effect size 1 (dash line) indicates larger effect of linuron. The effect size with 1
636
and 5 producers (A and D) was visualized by averaging effect sizes of all treatments with 1 and
637
5 producers, respectively, similar manipulation for the effect size under 0, 1 and 4 herbivores
638
species (B and E) and for the effect size under 1, 2 and 3 vertical composition (C and F).
639
Detailed statistical results are listed in Table S5.1-S5.2. (*P< 0.05, ** P < 0.01, *** P < 0.001).
640 641
26
642 643
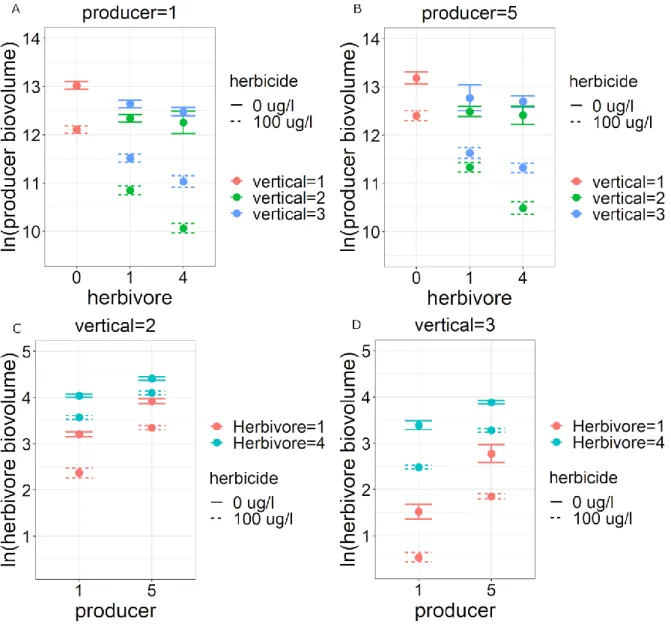
644
Figure 3. The interactive effects of horizontal (producers and herbivores) and vertical 645
composition, herbicide linuron on ln(producer biovolume) (a, b) and on ln(herbivore
646
biovolume) (c, d). Plotted are sample mean ± 1 SE. Solid error bars indicate linuron
647
concentration of 0 µg l-1, while dashed ones stand for linuron concentration of 100 µg l-1.
648
Detailed statistical results are listed in Table S6.
649 650 651 652 653
27
654
Figure 4. Species biovolume in the ten community types after linuron exposure on day 6. Con 655
represents control group, and Exp stands for exposure. Ten treatments include: s, single algae;
656
ss, single algae-single herbivore; sss, single algae-single herbivore-single predator; sm, single
657
algae-multiple herbivores; sms, single algae-multiple herbivores-single predator; m, multiple
658
algae; ms, multiple algae-single herbivore; mss, multiple algae-single herbivore-single
659
predator; mm, multiple algae-multiple herbivores; mms, multiple algae-multiple
herbivores-660
single predator). Detailed statistical results are listed in Table S7.1-7.2.
28
662
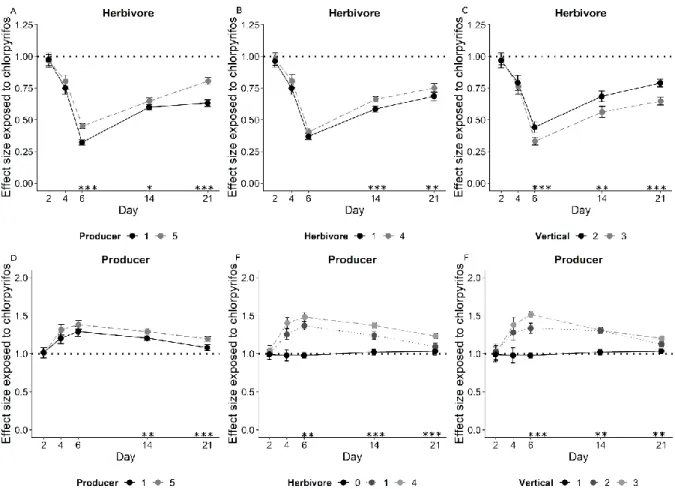
Figure 5. The effects of horizontal composition of producer and herbivore, and vertical 663
composition on effect sizes (biovolume as proxy) for herbivores (A-C), producers (D-F) after
664
exposure to chlorpyrifos. Plotted are sample mean ± 1 SE. An effect size is 1 (treatment =
665
control) indicating no effect of chlorpyrifos, smaller than 1 (treatment < control) indicating a
666
negative effect of chlorpyrifos, and bigger than 1 (treatment > control) indicating a positive
667
impact. The effect sizes with 1 and 5 produces (A and D) was visualized by averaging effect
668
size of all treatments with 1 and 5 producers, respectively, similar manipulation for the effect
669
size under 0, 1 and 4 herbivores (B and E) and for the effect size under 1, 2 and 3 vertical
670
composition (C and F). The bigger deviation from effect size 1 (dash line) indicates larger effect
671
of chlorpyrifos. Detailed statistical results are listed in Table S8.1-S8.2. (*P< 0.05, ** P < 0.01,
672
*** P < 0.001).
673 674
29
675
676
Figure 6. The interactive effects of horizontal (producer and herbivore) and vertical 677
composition, insecticide chlorpyrifos on ln(herbivore biovolume) (a, b) and on ln(producer
678
biovolume) (c, d). Plotted are sample mean ± 1 SE. Solid error bars indicate chlorpyrifos
679
concentration of 0 µg l-1, while dashed ones stand for chlorpyrifos concentration of 1 µg l-1.
680
Detailed statistical results are listed in Table S6.
681 682
30
683
Figure 7. Species absolute biovolume in the ten community types after chlorpyrifos exposure 684
on day 6. Con represents control group, and Exp stands for exposure. Ten treatments are same
685
as Figure 4. Detailed statistical results are listed in Table S9.1-9.2.
686 687