Air Traffic Management and Conflict Analysis for
Reusable Launch Vehicles
by
Kashif A. Khan
B.Sc. Mechanical Engineering
University of Engineering and Technology, Lahore, Pakistan, 1993 Submitted to the Department of Aeronautics and Astronautics
in Partial Fulfillment of the Requirements for the Degree of
MASTER OF SCIENCE IN AERONAUTICS AND ASTRONAUTICS
at the
Massachusetts Institute of Technology September 1998
© 1998 Massachusetts Institute of Technology. All rights reserved.
Signature of Author: "- - _ I
Department of Ajonautics and Astronautics June 26, 1998 Certified by: Accepted by: MASSACHUSETTS INSTITUTE OFTECHNOLOGY
SEP 2 2 1998
a frfwft. .
I
James K. Kuchar Assistant Professor of Aeronautics and AstronauticsI
I qais Supervisor\
r V - ime Peraire Associate Professor of Aer nautics and Astronautics Chairman, Department Graduate CommitteeAir Traffic Management and Conflict Analysis for
Reusable Launch Vehicles
by
Kashif A. Khan
Submitted to the Department of Aeronautics and Astronautics on June 26,1998 in Partial Fulfillment of the Requirements for the Degree of
Master of Science in Aeronautics and Astronautics
Abstract
Increasing demand for commercial utilization of space is accelerating the development of technologies that have the potential of providing safer and more economical access to space. Reusable Launch Vehicles (RLVs) are expected to take over a significant portion of the launch markets. Increased utilization of Spaceports will increase the frequency of interruptions to normal airspace operations and new methods of Aircraft-RLV separation need to be examined to reduce the impact of these operations on the National Airspace System. In this work, the issues relating to conflict detection and avoidance for mixed Aircraft-RLV operations were examined and compared with conventional special use airspace (SUA) operations.
The characteristics of RLVs such as performance and predictability were used in conjunction with conventional ATC separation standards and avoidance maneuvers to develop conflict avoidance procedures based upon Alert Zones. The geometry of the Alert Zone for a given avoidance strategy provides information on the sensing requirements, and other conflict metrics. Alert Zones for the expected types of intruders and their flight phases in the horizontal and vertical planes were determined, and parametric variations were examined to determine the sensitive variables. Limited probabilistic analysis for bounded uncertainties in intruder trajectories was performed. The maneuvering costs in time and distances associated with these avoidance maneuvers were discussed.
A strategy for comparing RLV operating modes employing SUA concepts, against tactical one-to-one avoidance mode concepts was formulated to evaluate the desirability of integrating RLV operations into the air traffic system. Conflict avoidance options using measures of Alert Zone size and deviation from track were compared. Preliminary analysis of required traffic deviation as a function of heading uncertainty was used to compare SUA to tactical conflict resolution for head-on conflicts. This allowed initial partitioning of when SUA is appropriate and when tactical separation is appropriate. For example, for equal speeds and uniform distributions of traffic, it was found that up to ±+24' heading uncertainty could be accepted for tactical resolution before a 60NM diameter SUA became the more efficient solution.
Thesis Supervisor: James K. Kuchar
Acknowledgements
I thank all the people whose contributions allowed this work to be completed:
My advisor, Professor James Kuchar who was the main motivator behind this thesis. His ideas, guidance, support, and encouragement were indispensable, as were his reviews of the thesis drafts.
Professors Amedeo Odoni and Walter Hollister who provided insightful input and encouragement; Professors John Deyst, John Hansman, and Eric Feron, who were consulted from time to time; and Professor Robert Simpson, who initiated my interest in conflict avoidance problems and ATC.
All the ICAT members, who make the Aeronautical Systems Lab such a hotbed for ideas, and provide continuous support.
My dear parents, brothers and sister, and all my relatives.
My roommates Aiman and Gassan. My friends, Ahmed Yahia, Ammar, Babak, Farhan, Fouzi, Hassan, Jalal, Mohammad Ali, Mohammad Saeed, Sabbir, Samir, Yassir, and many others. My friends back home, Mohammad Ali, Omar, Khurrum, Asif, and Sohail.
Table of Contents
A B STRA C T ... 2 ACKNOWLEDGEMENTS ... 3 TABLE OF CONTENTS ... 4 TABLE OF FIGURES ... 5 CHAPTER 1:INTRODUCTION ... 7 1.1 L AYOUT ... ... ... 11 CHAPTER 2:BACKGROUND ... 13 2.1 RLV CHARACTERISTICS ... 132.2 AIR TRAFFIC CONTROL ISSUES... ... 18
2.3 PROTECTION ZONES... ... 20
2.4 CURRENT AIRCRAFT-RLV SEPARATION METHODS ... 21
2.5 POTENTIAL MODES OF OPERATION... ... ... 22
2.6 COMPARING M ODES ... ... 25
2.7 LITERATURE SURVEY ... 27
CHAPTER 3:CONFLICT AVOIDANCE ... 29
3.1 ALERT ZONE DEVELOPMENT... ... 31
3.2 AVOIDANCE MANEUVERS. ... ... 33
3.3 PARAM ETRIC E FFECTS ... ... 37
3.4 UNCERTAINTY... ... 52
3.5 ALERT ZONES IN THE VERTICAL PLANE... ... 56
CHAPTER 4:ALERT ZONE COMPARISONS ... 60
4.1 VERTICAL AVOIDANCE KINEMATICS ... ... ... 60
4.2 VERTICAL AVOIDANCE ALERT ZONES IN THE HORIZONTAL PLANE... ... 65
4.3 COMPARING HORIZONTAL AND VERTICAL ALERT ZONES... 67
4.4 TRADEOFFS COMPARING SUA AND TACTICAL AVOIDANCE MODES ... 68
CHAPTER 5:CONCLUSIONS ... 72
5.1 C O NTRIBUTIO N S ... 73
5.2 FUTURE W ORK ... ... 74
REFEREN CES ... 75
A PPENDIX ... 76
A. 1 MANEUVER BASED LIMITS: METHODS AND TOOLS ... 76
A.2 MODELING UNCERTAINTY ... ... 86
Table of Figures
Figure 1: Kennedy Space Center Special Use Airspace... 10
Figure 2: RLV Flight Phases ... ... 15
Figure 3: Space Shuttle Descent Profile [9]... .. ... ... 17
Figure 4: Space Shuttle landing track overlaid on Kennedy Space Center Region [9]... 17
Figure 5: Airspace Traffic System Drivers... 19
Figure 6: Alert Zone concept ... .. ... ... ... 30
Figure 7: Alert Zone concept, Straight or Left Turn... 31
Figure 8: Alert Zone concept, Straight, Left turn or Right turn... ... 33
Figure 9: Tools suite schematic ... ... ... 36
Figure 10: Baseline A lert Zone... . ... 38
Figure 11: Effect of Maximum Turning Angle... .. . . ... 39
Figure 12: Apex Distance vs. Turn Angle... ... 39
Figure 13: Effect of Turn Rate ... 41
Figure 14: Apex Distance vs. Turn Rate ... 41
Figure 15: Effect of Intruder Speed ... ... ... 42
Figure 16: Apex Distance vs. Intruder speed ... ... 43
Figure 17: Effect of Relative Heading Angles (300 turn) ... 44
Figure 18: Alert Zones where turn angle is equal to heading difference ... 45
Figure 19: Alert Zones where turn angle is greater than heading difference... ...46
Figure 20: Envelope of Alert Zones for different relative headings... ... 47
Figure 21: Relative headings where two different ownship velocities give same relative velocity angle... 49
Figure 22: Alert Zones for heading difference between angles C and B... ... 50
Figure 23: Maneuver combinations for different relative headings,... ... 51
Figure 24: Combined Error and Protected Zone... . .. ...52
Figure 25: 1800 +I0 Alert Zone compared with 1800 ±o0 Alert Zone... 54
Figure 26: Apex distance vs. intruder heading uncertainty (300 turns) ... 55
Figure 27: Maximum Deviation vs. Uncertainty (300 turns)... 55
Figure 28: Vertical Alert Zone for an intruder with zero vertical speed... 57
Figure 29: Alert Zone comparison, 10,000ft/min and Oft/min intruders ... 58
Figure 30: Vertical avoidance point of contact with the PZfor head-on conflicts ... 61
Figure 31: Vertical avoidance point of contact with the PZfor different relative headings... 62
Figure 32: Required altitude change for vertical avoidance with an intruder of equal speed, zero miss distance conflict ... ... ... ... ... ... 64
Figure 33: Required altitude change for vertical avoidance, V/Vo = 2 ... ... 64
Figure 34: Alert Zones for vertical avoidance for an intruder on nominal collision course, V/Vo = 1... 66
Figure 35: Alert Zones for vertical avoidance, V/Vo = 2 ... 66
Figure 36: Comparison between horizontal and vertical avoidance alert zones in the horizontal plane... 68
Figure 37: Maximum Deviation vs. Uncertainty (c.f Figure 27)... 71
Figure 38: SUA Tactical trade-off Example (head on) ... ... 71
Figure 40: VR Rotation D irection ... ... ... 78
Figure 41: Effectiveness of Speed Change, ° change in Vr per % change in speed ... 79
Figure 42: Notional Initial Delay Components ... ... 81
Figure 43: Determine the relative path... ... 84
Figure 44: Sweep PZ along relative path to get the boundary ... ... ... 85
Figure 45: Com bine the boundaries ... 86
Figure 46: 1700 swept areas... ... ... ... 88
Figure 47: 1900 swept areas... 88
Figure 48: Com bined swept areas ... ... ... 89
Figure 49: 1800+10 alert zone compared with 18000O alert zone... 89
Figure 50: Apex Distance vs. Uncertainty for Speed Ratios (head on, 450 maximum turn) ... 91
Figure 51: Apex Distance vs. Speed Ratio for heading uncertainty... ... 91
Chapter 1: Introduction
Since the beginning of the space age, 40 countries and international organizations have launched one or more satellites. As of June 17, 1998, 2,495 satellites of all kinds were in orbit around Earth, according to the U.S. Space Command [1]. An all-time record was set in 1997 with 150 payloads placed in orbit. The United States launched 68, Russia 50, Europe 19, China eight, Japan three, and India and Brazil one each [2]. More than 1200 satellite launches are planned for the next decade by civilian and other organizations [3, 4].
Because of recent advances in communications technologies, it is now possible to launch constellations of hundreds of communications satellites into low earth orbit (LEO). There are currently more than a dozen new low earth orbit mobile communications satellite networks in planning and development stages [5]. The Geosynchronous Earth Orbit (GEO) satellite markets are also undergoing rapid expansion with new services such as high power Digital Broadcast Systems (DBS), and Cellular Communications. The communications satellite replacement market and the second-generation communications satellite deployment market will also become more significant over the next decade. Communications satellites that are planned for launch during the next ten years will have relatively short lifetimes, an average of five years, and entire satellite constellations will have to be replaced every five to seven years. Consequently, the frequency of space launch and recovery operations will increase rapidly.
This increased demand for commercial utilization of space is a substantial driver for the development of new technologies to improve space vehicle economics. Reusable Launch
Vehicles (RLVs) have the potential to increase space launcher efficiencies far beyond those achieved by current systems, and once the basic technologies have been proven, their share in the launch market should increase rapidly.
Private enterprise in the space launch industry has been limited until the present, but is increasing, and should eventually overtake the share of government agencies and the military. To ensure 'fair use' of airspace by all these entities and the air transportation industry, strategies for air and space traffic management need to be developed. Simultaneously, safety must be maintained.
The future of the National Airspace System is currently under review through concepts such as free flight, which seek to leverage advancing technologies that will allow improved control of separation between vehicles. Advances in tracking, navigation, communications, and related technologies power these new concepts and it is worthwhile to examine what role they can play in streamlining the coexistence of aviation and space operations.
Current space operations occur at only a few sites in the world and are relatively infrequent. The existing US space launch sites are at Kennedy Space Center, FL; Cape Canaveral Air Station, FL; Wallops Island, VA; White Sands Missile Range, NM; Vandenberg Air Force Base, CA; Edwards Air Force Base, CA; and Kodiak Island, AK. Several commercial launch sites such as California Spaceport, Spaceport Florida Facility, Virginia Space Flight Center, and Alaska Spaceport will also be established, with launch pads for additional types of
launchers at the existing sites. Many existing and proposed non-U.S. launch sites will also have increased operations.
Use of these facilities causes some increase in air traffic delays and workload, but as space launch and reentry operations increase, these costs will rise. Currently, activation of the Space Launch facilities such as Kennedy Space Center lasts for up to 3/2 hours at a time. Although the launch itself lasts for only a few minutes, the early activation allows time for controllers to clear the airspace needed for launch operations [6, 7]. The number of flights affected depends upon the time of day, and aircraft traversing the area during these periods suffer deviations adding 8-10 minutes of flight time. The diverted aircraft have to be absorbed into the neighboring air routes, and the increased congestion leads to system-wide delays.
Unlike expendable launch vehicles that are typically non-recoverable once they leave the launch pad, RLVs will be designed for multiple missions with fail-safe modes allowing recovery to landing sites. New flexible procedures for short-notice reintroduction of RLVs into the air traffic system will hence be required to allow for the possibility of vehicle emergencies during launch, on-orbit, or reentry. Reexamination of the procedures through which air traffic is separated from RLV traffic is therefore necessary and new operational procedures and modes need to be found and evaluated.
Space operations and aircraft operations are currently separated by defining Special Use Airspace (SUA) for exclusive use of space operations, around the launch and recovery facilities, which forbid entry of unrelated aircraft during operations. The SUA geometry is
determined by the expected operational airspace usage requirements for the Space Vehicle, and provides an excess buffer in space and time. The margins are expected to provide acceptable physical separation of the different operations, and guarantee the required safety level. Figure 1 shows the Kennedy Space Center Special Use Airspace sectors over the Atlantic Ocean.
810 800 790 780 770
West Longitude
Figure 1: Kennedy Space Center Special Use Airspace
The current mode of operation transfers exclusive use of the SUA to space operations when requested. The SUA is depicted on aeronautical charts, and entry of all unrelated aircraft is prohibited when it is active. Activation of SUA therefore generates negative impact on air
300 290 -o 280 0 z 270
traffic flow depending upon its size, the usage requirements of conventional traffic, and the time of day and duration that it is in effect. The increasing frequency of space operations will cause greater impact on traffic in the National Airspace System. As effects on commercial air traffic increase, usage conflicts are likely to arise between the involved parties. It is therefore desirable to examine the potential for improving airspace utilization during space operations. Options such as mixed-mode airspace with tactical conflict resolution, where conventional and RLV traffic simultaneously use the same airspace, and are monitored and guided in real time, should be evaluated for benefits.
Each potential procedure or operating mode of airspace will entail requirements on technologies, equipment, and operator workloads. To determine whether a proposed concept is viable, these costs need to be balanced against the potential benefits of improved traffic flow and safety.
1.1 Layout
Current methods of RLV-aircraft separation in use at the US Launch Ranges are outlined in chapter 2. The characteristics of the likely potential modes of operation and airspace utilization for RLV operations are defined, using current requirements and procedures as guides. ATC derived requirements are noted. Mission profiles of some of the proposed RLVs and characteristics of the various flight phases are discussed briefly.
In chapter 3, methods for conflict avoidance are discussed. Conventional protection zones and basic avoidance maneuvers are used to develop Alert Zones. The effects of parametric
variations on Alert Zones are examined. The Computational Tools developed for this analysis are described.
Some metrics for comparing particular avoidance strategies are evaluated in chapter 4. Methods for optimization of avoidance based on the balance between safety and disruption cost for RLV operations are proposed. SUA and tactical conflict avoidance methods are
compared using maneuver penalties.
Chapter 2: Background
2.1 RLV Characteristics
Many RLV designs are in the concept and development stages. The major current and planned space launchers are listed in Table 1. A number of other studies not listed here are also underway. Current space vehicles are all vertically launched (VT) from launchpads, with the exception of Pegasus, which is an example of Horizontal Takeoff (HT) vehicles that are launched from horizontal runways. Similarly the landings may be classified according to whether they are horizontal (HL), as for the space shuttle, or vertical (VL) as for the DC-X. We include parachute-assisted landings in the VL classification, as a significant horizontal component of velocity is not always present.
Launch vehicle performance characteristics are markedly different from conventional aircraft, as their mission objectives are different. However, for some of the proposed RLVs in Table 1 there may be certain phases of flight with similarities to conventional flight.
Table 1: Space Vehicle Types [8]
Service
Vehicle Type Features Date
Conventional ELV Current launchers (Titan, Atlas,...) now
expendable
VT
EELV Proposed ELV replacement 2000
expendable
VT
Sea Launch VT Ocean launched Zenit 1998
expendable
Shuttle (STS) VT-HL Partially reusable now
X-33 VT-HL Test Vehicle 1998
Venture Star VT-HL SSTO, Potential Shuttle replacement 2003 Kistler K-1 VT-VL 2 stages, parachute + airbag recovery 1999
Roton VT-VL Rocket propeller N/A
Pegasus HT-HL Air launched, expendable now
Sanger HT-HL Study phase N/A
X-34 HT-HL Test vehicle, B-52/L-1011 launched 1998
Pioneer HT-HL Piloted, LOX refueled at altitude 1999
ELV: Expendable Launch Vehicle SSTO: Single Stage To Orbit
VT: Vertical Takeoff VL: Vertical Landing
HT: Horizontal Takeoff HL: Horizontal Landing
Flight Phases
Any RLV mission is composed of a number of flight phases (Figure 2). Multi-stage vehicles will have some phases occurring in parallel. For example, jettisoned stages will return to earth while the vehicle continues its ascent. Definitions of phases of flight are listed in Table 2.
Figure 2: RLV Flight Phases Table 2: RLV Flight Phases
Phase Definition
Takeoff Conventional, Aircraft-type horizontal launch on a runway
Liftoff Rocket-type vertical launch from a launch pad
Climb Flight with significant positive vertical velocity component
Cruise Flight at constant altitude or near-zero vertical velocity component
Staging Deliberate separation of vehicle components
Refueling Transfer of fuel or oxidant from one flight vehicle to another
Sub-orbit Cruise Free-fall trajectory of less than one orbit
Orbit Insertion Boost to orbit / exit atmosphere
De-orbit Removal from orbit, into re-entry trajectory
Re-entry Entry from space Into the atmosphere
Descent Flight with significant negative vertical velocity component
Horizontal landing Conventional, aircraft-type horizontal recovery on a runway
Although the Takeoff, Climb, Cruise, Descent, and Horizontal Landing phases are functionally similar to conventional air operations, the velocities and accelerations may be extreme in comparison. In addition, vehicle maneuverability beyond the nominal mission profile may have severe limits. While many of the RLVs may be able to perform maneuvers for conflict avoidance, such maneuvers may put the completion of the mission at risk, and may cause loss of vehicle in the worst case. The result is that, at least initially, RLVs cannot be expected to perform avoidance maneuvers, and conventional aircraft alone will have to
maneuver to resolve conflicts.
As an example, Figure 3 shows a typical unpowered landing profile of the space shuttle (STS) [9], compared to a 30 conventional descent profile. The Shuttle descends at vertical rates ranging from 20,000ft/min at 60,000ft to 11,000ft/min at 10,000ft, as compared to aircraft that are typically limited to ±4000ft/min. A typical descent is composed of a high speed, high altitude straight track segment from 80,000ft altitude, and then a 270' descending left turn segment to touch down as shown in Figure 4. The descent from 80,000 ft to touchdown takes approximately 6 minutes.
90,000 80,000- M. 70,000 60,000 50,000Mach 1 40,000 30,000 20,000 -30 slope 10,000 0 0.0 10.0 20.0 30.0 40.0 50.0 60.0 Distance, NM
Figure 3: Space Shuttle Descent Profile [9]
-81 -80.5"
Figure 4: Space Shuttle landing track overlaid on Kennedy Space Center
2.2 Air Traffic Control
Issues
Air Traffic Control (ATC) Systems provide separation assurance and traffic management functionality in the National Airspace System. How airspace is defined and used reflects the mixing between tradition and technological capabilities. The choice of operating mode determines a balancing point between competing demands. Any concept used will impact both air traffic flow and the ability of the competing operations to be performed when needed. With each concept, there are vehicle and ground equipment requirements, and safety and operator workloads will be affected. All these considerations should be considered together when examining future airspace concepts, because improving a single metric can negatively impact the others.
Traffic separation providing adequate safety margins is achieved by a number of control methods and procedures. To achieve the required safety, and provide protection against failure, control systems and procedures are layered whenever possible to provide redundancy, and are often at work simultaneously. Wide variation in the degree of control from the ground is exercised, ranging from aircraft that self-separate visually, to those that are actively ground vectored. While examining the available options, the safety level must be maintained. Absolute safety level as a function of probability of conflict is difficult to determine, as it is dependent upon many interrelated factors. It is possible however, to make reasonable comparisons for changes in one component variable such as altitude separation or horizontal separation.
Safety separation requirements may be defined in terms of distance or time. The amount of separation that provides acceptable safety depends on many factors, as shown in Figure 5.
Available technology drives the sensor capabilities and vehicle maneuverability characteristics. Safety standards evolve along with operational experience. These factors allow evolution of separation standards, operating rules, and airspace structure, which then determine the amount of traffic the system is able to carry.
Figure 5: Airspace Traffic System Drivers
Several additional factors will influence the required safety buffer size for RLV operations. RLVs will have relatively large along-track accelerations. The exhaust from rocket engines may be hazardous, and expended stages and auxiliary operations such as refueling and chase planes may be present. The potential for catastrophic failure of a space vehicle is currently
many orders of magnitude larger than for conventional aircraft operations, although it should decrease significantly with increasing operational experience. The uncertainties in these factors, especially the relatively high potential for catastrophic failure, account for the current need for large safety buffers around RLV and other space launcher operations.
As aircraft spend the major proportion of time cruising at constant altitude, and reliable altitude sensors are available, the current air traffic system is built around stratified flight levels. The controllers are given a two dimensional view of traffic on Planform View Displays (PVDs) with identification labels showing additional information such as altitude [14]. Typical Radar update rates are 12 seconds en-route and 4 seconds in the terminal areas. As
discussed above typical aircraft vertical rates range between 1,000 - 2,000ft/min, with 4,000ft/min as an extreme. RLVs will in general have significantly larger vertical ascent rates during launch, and landing descent rates may also be relatively high, as many of them will be unpowered and have inefficient lifting surfaces.
The separation methods can be subdivided according to whether the control is performed centrally (normally by ground ATC centers), or is distributed among the aircraft themselves. Overlap between the control methods is normal and desired.
2.3 Protection Zones
Protection Zones are safety buffers or margins between vehicles using airspace. Under standard operating conditions, an aircraft may never penetrate the Protection Zone of another. Protection Zones provide an alternate way of specifying the separation requirements. They
can be defined in terms of horizontal separation, vertical separation, and time, or by measures combining some or all of these factors into a single function. Many notional methods exist to determine protection zone sizes, while determining the best one for a particular problem is not always straightforward. Horizontal separation requirements are based upon operational experience, available radar tracking scan frequency and accuracy, and response times of controllers and pilots, while vertical separation standards are generally based on available altimeter accuracy. It is difficult to establish criteria for "safe" aircraft-RLV separation as no applicable standard methods exist. However, conventional separation standards can still be used as baselines for comparison with other options. The current aircraft separation standards are 5NM horizontally, and 1000 ft vertically (2000 ft above 29,000 ft), and the cylindrical puck shaped protection zone defined by these distances is used in what follows to determine the alerting volumes. Separation standards and hence Protection Zone geometry is allowed to change depending on flight characteristics, operating mode, quality of available tracking, and traffic environment.
2.4 Current Aircraft-RLV Separation Methods
Currently, space operation and aircraft separation is achieved through Special Use Airspace (SUA), similar to that used for military operations, around the launch ranges. Large static spatial and temporal buffers between the domains are provided. Figure 1 shows the charted SUAs for the Eastern Launch Range (Cape Canaveral).
Typically, the airspace is active several hours before and a short time after the space operations occur. ATC is informed and controllers reroute air traffic around SUA. ATC may
be able to observe the space vehicle through primary radar, while air traffic in the region is also observed by the RLV Operations Center (ROC). Should a violation occur, ROC directs chase aircraft to escort uncooperative or unresponsive aircraft out of the SUA. The timing of SUA operation is determined so that it is early enough for Notices to Airmen (NOTAMs) to be communicated at preflight, especially for VFR aircraft. The Cape Canaveral SUA is typically activated about 3 to 31/2 hours before operation begins. Unnecessary activation sometimes occurs if the operation is canceled or delayed after the NOTAM is issued.
The current launch vehicle SUA definition process involves a detailed study of the launch system requirements, capabilities, and risk factors [11]. The size of the SUA is determined by limiting the probability that the vehicle crosses the boundary to outside airspace to 1 in 106. During launch, the probable Instantaneous Impact Point (IIP) is continuously calculated using telemetry data, assuming an instantaneous propulsion loss, and displayed in real time to a controller on the launch monitoring consoles. The mission is aborted (typically self-destructed) should the IIP pass outside the boundary of the defined region.
2.5 Potential Modes of Operation
Potential modes of airspace use for RLV operations are listed below, and these represent a range of likely operating regimes. The concepts can be divided into SUA-type, centralized control, and decentralized control categories. These alternatives will need to be examined for their effects on safety and traffic disruption, in addition to effects on equipage requirements and workloads.
2.5.1 SUA type concepts
Using a static protection zone, rather than one moving with the vehicle, is practical when the total amount of airspace the vehicle needs is relatively small. This is the case for RLVs with steep climb and descent trajectories or looping paths, such as those used employed by the space shuttle. Three options can be distinguished:
USE CURRENT SPACEPORT SUA
Current Spaceports (Cape Kennedy, Vandenberg AFB, Edwards AFB, White Sands AFB, and Wallops AFB) will continue to operate for the foreseeable future. Keeping the SUA definition philosophy intact, new RLV flight facilities can be added as needed in geographically suitable locations, to accommodate increased RLV operations. Safety studies for new vehicle operations, to define any required modifications to the current SUA regions, can be performed and then charted.
MISSION-SPECIFIC SUA
Current SUAs are designed to accommodate the entire range of space operations from a spaceport. Subsections of the SUA could be designed to satisfy the launch requirements for a subset of the possible launches. Then, depending on the mission, the appropriate sub-section of the SUA is activated. Other procedures would remain the same as for the typical SUA, and the effective disruption of the airspace system is reduced.
RLV-INTENSIVE CONTROLLED AIRSPACE
Keeping the current SUA intact but allowing controlled aircraft to enter may alleviate some of the disruption introduced in air traffic flow while the SUA is activated. Actively controlled aircraft would be allowed into the SUA with clearance from the ROC. One concept is to operate the SUA with similar requirements to current Class B airspace, except that any aircraft could be denied entry by ATC if a space operation were occurring. All VFR aircraft would be required to have clearance for entry. During RLV operations, ATC would be notified of what airspace, including safety buffers inside the SUA would be needed for RLV operations. ATC would maintain communications with the ROC for expected RLV operation times, and any updates or changes in the operations. Then, as required, ATC would vector air traffic around expected RLV routes.
2.5.2 Centralized ATC concepts
These modes closely parallel traditional air traffic control practices for conventional aircraft, with suitable modifications to compensate for the differences in performance.
CONTROLLED AIRSPACE WITH REAL-TIME RLV CORRIDOR
The ROC or the RLV itself communicates the flight plan and airspace corridor requirements to ATC in real time. ATC then dynamically performs corridor updates in response to RLV state, and vectors traffic around the corridor. Otherwise, the operation is similar to the case discussed earlier.
RLV AS A HIGH, OR NORMAL PRIORITY VEHICLE
The RLV is treated similar to conventional aircraft, with equivalent requirements (files a flight plan, obtains a departure clearance, etc.). However, for separation assurance, the RLV may be given higher priority or "right-of-way" over other air traffic. ATC has responsibility for separation and needs appropriate guidelines for detecting and resolving conflicts to account for the RLV.
Prioritization issues are more critical with RLVs as they often have tight launch windows and any delay or redirection might cause the operation to be cancelled. If aircraft are given lower priority than RLVs, flight delays and airlines' costs will increase. Vectoring the RLV around conflicts is possible if the RLV is maneuverable and if resolution doesn't impact the mission plan.
2.5.3 Decentralized "Self-Separation" concepts
These modes are similar to the proposed "free-flight" concepts, and aircraft and RLVs are expected to self-separate, using on-board systems and procedures. Many issues remain to be resolved even with conventional aircraft vs. aircraft self-separation. These issues are exacerbated in cases involving high-performance RLVs, as the RLV typically enters and exits airspace in a short time span, and the time available for decision making is more limited.
2.6 Comparing Modes
Many RLVs will operate similarly to aircraft during certain phases of flight, and therefore may be good candidates for a more mixed mode of airspace allocation. An example would be
an RLV such as Pegasus, which may have a significant cruise/ferry phase of flight, during which speed and vertical rates are similar to other air traffic. During this phase of flight, air traffic and the Pegasus carrier could be managed using conventional ATC procedures. The Pegasus carrier might then transition to SUA where the launch of the rocket-powered stage of Pegasus could be performed safely. More complex concepts, such as allowing controlled aircraft into SUA, may provide traffic flow benefits, but will likely require significant improvements to technologies on aircraft and at ground control stations. Additional controller tools, communications, and procedures will also be needed.
Many of these technologies are expected to appear in the next decade as new operational concepts such as "free-flight" are implemented. New tracking technologies, such as GPS, currently in limited use, are expected to become available generally. Communication
technologies will also become much improved.
To determine the conditions necessary to allow operating modes other than those in use today, some fundamental issues need to be resolved. In the following chapters, a maneuver constraint based approach is employed to determine a rational methodology for comparing conventional and unconventional modes for RLV-Aircraft separation. To compare operating modes, avoidance maneuvers are proposed and the needed alerting zones are determined. Metrics for evaluating avoidance maneuver costs are developed and compared with those for conventional methods of RLV avoidance. Comparison between decoupled vertical and horizontal avoidance and their applicability to various encounter geometries is examined.
2.7 Literature Survey
A number of techniques exist for analyzing conflict detection and avoidance exist. Kuchar and Yang [10] performed a broad survey of modeling methods for conflict detection and resolution.
Analytic solutions for airborne collision avoidance were discussed by Morrel, [15], who compared the relative advantages of vertical and horizontal avoidance, and formulated graphical analysis methods.
Krozel et. al. [14] performed a wide ranging study of conflict detection and resolution methods. They performed deterministic and non-deterministic, 2D and 3D conflict detection analysis based on the penetration of the Protected Airspace Zone, and found alert zones based upon deterministic and probabilistic criteria. They analyzed heading or speed control maneuvers in the horizontal plane, and altitude control in the vertical plane, for tactical close-range and strategic far-close-range cases. They developed maneuver charts based upon maximizing the range at closest approach, indicating the turn directions, acceleration signs, or climb/descent rates that each aircraft should select for any arbitrary initial relative state for cooperative and non-cooperative tactical collision avoidance maximizing safety. They found it more economical in non-cooperative heading maneuvers to turn the aircraft to the backside of the non-cooperating aircraft, and for cooperative cases, better to let the faster aircraft bear more of the burden. They found speed control maneuvers ineffective as means of conflict resolution in terms of cost and range required. They showed that altitude maneuvers were
more efficient than heading change maneuvers in terms of energy usage and time penalties, and were uniformly effective for all relative headings.
The objectives in this work were to determine the intruder and encounter characteristics that present difficulties in conflict avoidance. A method to develop Alert Zones was devised using a new analytical relative velocity approach that allows direct determination of deterministic and probabilistic Alert Zones in vertical and horizontal planes, based on the vehicle and intruder characteristics. The alert zone approach was extended with special emphasis on conflict avoidance for vehicles with dissimilar flight characteristics such as RLV vs. aircraft. The method was designed to be extensible and to allow comparison between multiple candidate maneuvers using geometric relations.
Chapter 3: Conflict Avoidance
In this chapter we discuss how to formulate the spatial limits that conflicting aircraft may be allowed to approach before action needs to be taken. A conflict is defined as a projected violation of traffic separation requirements. A violation occurs when one vehicle penetrates the protection zone of the other vehicle. As uncertainties are present in the sensor information and the predicted path, whether a conflict will occur can only be known with some level of confidence.
Once the possibility of a conflict becomes significant, whether and when to initiate an avoidance maneuver has to be determined. A number of avoidance maneuver options may be available at any given time. However, as the encounter progresses, the relative merits of options may change, and the number available may decrease as the intruder approaches closer to the ownship. We can wait until the conflict probability becomes high enough that action is required, but not so long that the probability of successful avoidance becomes low. We must not wait until all options disappear.
If the uncertainty of the intruder can be bounded, it may be possible to design an avoidance strategy to safely resolve the conflicts for all the possible outcomes within the uncertainty range, and successful avoidance can be guaranteed. In other cases, avoidance cannot be fully guaranteed no matter what we do and the only option then is to choose an avoidance maneuver that minimizes the conflict probability.
Intruders can be classified according to their motion relative to the ownship. The motion may vary in its complexity, and as may be expected, increasing complexity of motion increases the difficulty of analysis. As a starting point, we assume nominally linear constant speed motion for both the intruder and the ownship. Simple linear motion allows comparatively simple solution of the equations of relative motion.
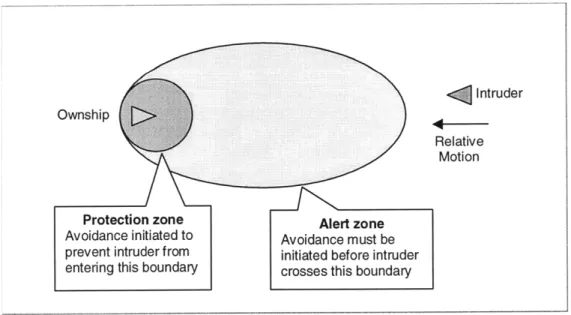
For each class of intruders with a particular velocity vector, a boundary called the Alert Zone is determined (Figure 6). This boundary defines the closest that the vehicles can be allowed to approach before an avoidance maneuver must be initiated to resolve the conflict. An intruder that approaches closer to the ownship than this boundary before the avoidance maneuver is initiated will violate the separation requirements even if the avoidance maneuver is performed. The geometry of this boundary depends on the characteristics of the intruder, such as speed and relative heading, those of the ownship, the available avoidance maneuvers, latencies in sensors, automation and humans, and the geometry of the protection zone.
Intruder
Ownship
Relative Motion
Protection zone Alert zone Avoidance initiated to Avoidance must be
prevent intruder from initiated before intruder entering this boundary crosses this boundary
3.1 Alert Zone Development
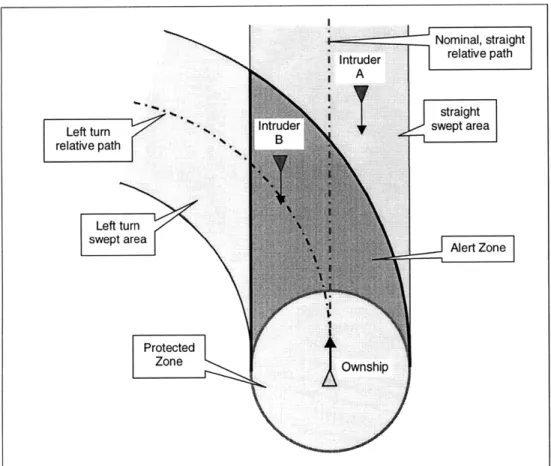
An Alert Zone is determined for each intruder based on an assumed set of avoidance maneuvers. To do so, we define a frame fixed on the intruder, and transform the motion of the ownship to this frame. Referring to Figure 7, the protection zone of the ownship following its nominal path sweeps a volume along a straight path in this space. An intruder that lies within this swept volume is projected to have a conflict with the ownship. To avoid such an intruder we require a different flight path, with a swept volume that does not include the intruder. This path is shown as a left turn in Figure 7. The alternate flight path and its swept volume move with the ownship following the nominal path. The alternate flight path must be selected before the intruder crosses into its swept volume.
Figure 7: Alert Zone concept, Straight or Left Turn
Nominal, straight relative path
straight swept area
In Figure 7, the intruders are approaching head on. Nominally, the ownship is following a straight path, but for example, a left turn from any point along it is available. Intruders A and B are in the swept area of the nominal straight path, and conflicts are projected with them. If a left turn were taken, a different volume would be swept as shown. It is possible to avoid A by turning left before it crosses the curved boundary of the Alert Zone. The latest we can delay turning is the boundary of the common volume between the two swept volumes. An intruder that crosses this boundary cannot be avoided using the assumed avoidance maneuver, as it would then lie within the area that both the options sweep. Intruder B has already crossed the boundary, and a protection zone violation by it is inevitable.
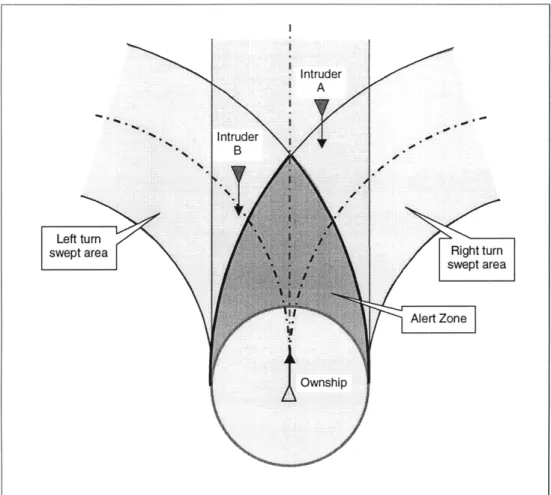
If we are allowed another option, such as a right turn, in addition to the nominal straight path and left turn, we get a different Alert Zone as shown in Figure 8. As the Alert Zone is now smaller than the one in Figure 7, we are able to avoid intruder B as well as A by taking the right turn.
Figure 8: Alert Zone concept, Straight, Left turn or Right turn
The procedure outlined above is used to determine the Alert Zones using the swept volumes, and is described in detail in the Appendix. Alert Zones can be determined for horizontal avoidance maneuvers in the horizontal plane and for vertical maneuvers in a vertical plane, using the respective cross-sections of the protection zone. The Alert Zones for all classes of expected intruders can then be found and further analysis undertaken to optimize the avoidance strategy.
3.2 Avoidance maneuvers
An avoidance maneuver is used to achieve a displacement in space and time such that the separation requirements are fulfilled. Avoidance maneuvers can be made arbitrarily complex,
Intruder A ,A :,!,
Left turn swept area
and determining the optimal avoidance maneuver for a general conflict is a non-trivial problem. We propose some simple candidate maneuvers that provide the required displacements directly, without proving that these are the best possible maneuvers. Then we can examine these for suitability, and substitute progressively complex maneuvers as needed to solve conflict scenarios that are inefficiently solved by the simple maneuvers.
Different constraints exist for vertical and horizontal resolution. The turning rates and vertical acceleration are limited by the allowable bank angles and load factors respectively. While there is no limit on the total turn angle, the vertical rates are limited. There are physical altitude limits, while in general, horizontal deviation is not similarly limited.
Avoidance maneuvers can be cooperative, where both vehicles take evasive action, or non-cooperative where only one does. Many RLVs are expected to have little capacity for maneuvering due to their performance limitations and mission requirements as mentioned earlier, and cooperative avoidance maneuvering will not be possible in most circumstances. In addition, when cooperative avoidance is used, issues involving maneuver synchronization and maneuver apportioning arise for vehicles with very different flight characteristics. Here, we take the simpler path and consider only non-cooperative conflict resolution, where the aircraft alone performs avoidance, and the RLV is assumed to be unable to deviate from its nominal flight path. As RLV capabilities increase in the future and greater margins for maneuvering become available, cooperative maneuvers should be considered to reduce individual penalties.
1. Initial delay: between detecting the intruder crossing the
Alert Zone boundary, and starting the maneuver, to allow for automation, human, and aircraft response delays
2. Turn Initiation: by banking the aircraft from wings level to
the maximum bank angle (e.g. 5 sec for 300 bank angle, [14])
3. Turn: at constant bank angle, such as 300 used hereon, Used to determine giving a turn rate of 1.4°/second, until the required heading Alert Zone Geometry change is achieved
4. Turn Termination: by leveling the wings of the aircraft from
the maximum bank angle (e.g. 5 sec for 300 bank angle, [14])
5. Straight Travel: once the turn is complete to the point of
closest approach at when the resolution is complete
6. Return to Original Heading or Original Track: Depending Used for avoidance upon which option is more desirable (e.g. Original Heading if cost determination flight destination is far away)
To simplify the analysis, phases 2 and 4 are absorbed into the delay (phase 1) and turn (phase 3). There is negligible impact on the Alert Zone geometry due to this simplification, as the duration of these transient phases is small relative to the others. These components of avoidance maneuvers are described in more detail in the Appendix.
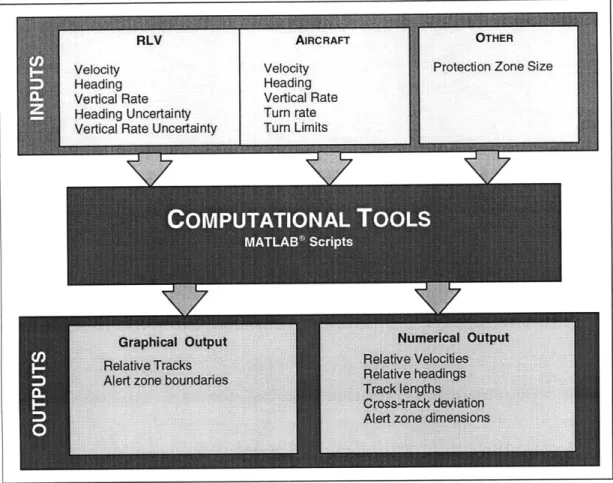
The geometric analysis of conflicts is complex as the functions relating the quantities are transcendental and not suitable for purely analytical treatment. A suite of computational tools was developed as an aid to understanding the interrelationships of some of the important factors in conflicts and their resolution. A condensed schematic is shown in Figure 9.
Figure 9: Tools suite schematic
The primary processing was done in MATLAB® through scripts. Subsequent data analysis was performed in MS Excel® Worksheets. Various combinations were used for the horizontal and vertical planes, and for varying degrees of uncertainty, utilizing structured multi-level routines in some cases. The RLV parameters needed are velocity, heading, vertical rate, and heading and vertical rate uncertainties. The input aircraft parameters are velocity, heading, vertical rate, turn rates, vertical accelerations, and altitude change and turn angle limits. The Protection Zone geometry to be used is also defined. The MATLAB® scripts provided graphical output of relative tracks, and simple and combined Alert Zones. Numerical output data used for further analysis includes relative velocities, relative headings, track lengths, cross-track deviations, Alert Zone dimensions, and temporal measures.
3.3
Parametric Effects
In this section we examine some effects of parametric variations on Alert Zone geometry.
The baseline Alert Zone is shown in Figure 10 for intruders approaching head on. No uncertainty in tracking or path prediction is assumed. Both the intruder and ownship are travelling at 450kt and a 20 second delay between a conflict alert and actual start of an avoidance maneuver is assumed. The avoidance maneuver is a 300 bank turn left or right, equivalent to a turn rate of 1.4o/s. The protection zone is a circle of 5 NM radius. We use the apex distance (27 NM in this example) as the measure of Alert Zone size. As shown, an intruder directly ahead of the ownship would produce a conflict alert aproximately 27 NM ahead, at which time the ownship would have to turn to avoid the conflict.
20 15
10
- 5- 0-I I I -10 -5 0 5 10 NM
Figure 10: Baseline Alert Zone
Turn Angle:
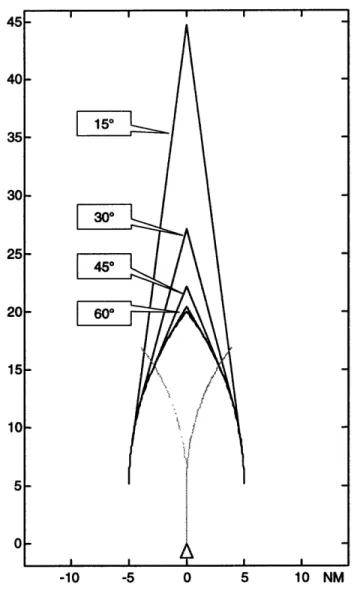
As the size of the Alert Zone is inversely related to the severity of the avoidance maneuver, we can perform a trade-off between maneuver severity and the distance from the projected conflict at which the maneuver is initiated. Less severe maneuvers must be started earlier, and more severe ones can be delayed until later. Figure 11 shows the Alert Zones for turns of 150,
300, 450, and, 600, for a head on intruder. Increasing turn angle reduces the range at which the avoidance maneuver must be initiated, but causes a larger penalty per unit time, as the velocity component in the direction towards the destination is reduced.
-10 -5 0 5 10 NM
Figure 11: Effect of Maximum Turning Angle
--- --- ---- ---- --- --- -- ---- -- - -0 15 30 45 60 7 Turn angle, °
Figure 12: Apex Distance vs. Turn Angle
120 100 80 60 40 20 0
Figure 12 shows the variation in Apex distance with increasing turn angle. As shown, there is little benefit in increasing the turn angle beyond 300.
Turn Rate:
We have thus far assumed a turn rate of 1.40/s, which corresponds to a bank angle of 300. Figure 13 shows the effect of changing turn rate, for 450 turns. As the turn rate increases, the Alert Zone shrinks, approaching asymptotically the instantaneous turn rate Alert Zone, which is also shown. Figure 14 relates the Apex distance with turn rate. There is little benefit beyond turning rates of about 1.40/s, as the fraction of time spent in the turn becomes smaller.
In Figure 13 the arcs radiating from the straight ownship track line in the center show the duration that the ownship spends in completing the turn, before the straight segment at the new heading. Since the speed is constant, the time spent in performing the turn is inversely proportional to the turn rate, and this is seen in the decrease of arc lengths as the turn rate increases. However, the decrease in arc length is compensated by the increase in the straight portion of the avoidance maneuver. In a head on conflict, 5 NM of deviation from the nominal track is required to solve the conflict in the worst case. The edge of the Alert Zone needs to intersect the centerline, and as the flight path arc length reduces, the curved boundary converges to 5NM radius, and the straight section of the Alert Zone boundary becomes longer.
30 0.80/s 25 1.40/s Instantaneous 20 15 10 5-0 -10 -5 0 5 10
Figure 13: Effect of Turn Rate
1 2 3 4 5
Turn rate, °Is
Intruder Speed:
The effects of intruder speed (V) for constant ownship speed (Vo) of 450 knots are shown in
Figure 15. As the relative velocity increases, the Alert Zone is stretched linearly with it (Figure 16). 40 35 V,iNo= 2 30 25 VNo= 20 V/Vo= 0.5 1510 - 5- 0--10 -5 0 5 10 NM Figure 15: Effect of Intruder Speed
45 40 E 35 -z 30 C 25 -S20 i 10 ~1 0 t--- -- - --- --- -- 4--- -- ---0 0 200 400 600 800 1000
Intruder speed, knots
Figure 16: Apex Distance vs. Intruder speed
Relative Heading:
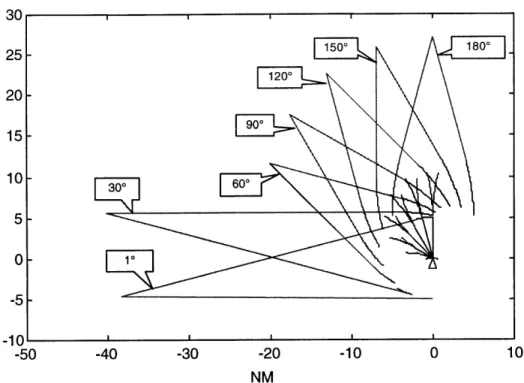
Figure 17 shows the Alert Zones for intruders at relative headings of 1800, 1500, 1200, 900, 600, 300, and 10. At 00 the intruder is static relative to the ownship and no conflict can occur unless the intruder is already inside the Protection Zone. The Alert Zones for the corresponding negative angles are simply mirror images of the zones shown here, due to symmetry.
30 25 150 1800 20 15 5-10- 10 -5 -10 -50 -40 -30 -20 -10 0 10 NM
Figure 17: Effect of Relative Heading Angles (300 turn)
For relative heading angles larger than the turn angle (30' in this case), the Alert Zone does not substantially change its shape and points in the direction of the relative velocity.
The Alert Zones shown for 30' and 10 relative headings are larger than the others because they use a left turn or straight maneuver combination. If the turn angle is equal to the heading
difference, turning right eliminates relative velocity (v, = 0) as shown in the vector diagram
in Figure 18. The ownship right turn vector and the intruder's velocity vector become identical. The Protection Zone then stops sweeping and becomes a static circle. We have the option of selecting the smallest shared area which is the shaded circle in the figure representing the static PZ, or the Alert Zone generated by changing the maneuver options from left turn or right turn to left turn or straight. Selecting the static circle means that the conflict becomes frozen in time, and does not get resolved. Switching to a left turn or straight combination we get a jump in alert zone size but we have the assurance that the conflict will
be resolved in time, as there is significant relative velocity present. The elimination of relative velocity can only happen if both vehicles travel at the same speed.
Left turn swept area
VrO
Vo= ownship velocity Vi= intruder velocity Vr= nominal relative velocity Vrl= relative velocity, left turn Vrr= relative velocity, right turn
Figure 18: Alert Zones where turn angle is equal to heading difference
Figure 19: Alert Zones where turn angle is greater than heading difference
A turn greater than the heading difference changes the relative velocity so that the intruder
and ownship move away from each other as shown in Figure 19. The swept volume then also reverses course. The Alert Zone formed by combining the left turn and right turn swept volumes has approximately the shape of the Protection Zone itself, displaced slightly in the direction of the nominal relative velocity. Although the immediate conflict is resolved, we have to determine when to return to the original course. If we use this boundary option then we have to continue on the new heading until the intruder passes ahead before resuming the
original heading. We also have the option of switching to the left turn or straight Alert Zone which is similar to that discussed before. This option solves the conflict in a more direct manner as before and is easier to use because a single turn rather than a combination of turns can be used to solve the conflict.
Thus, we decide that when the relative heading of the intruder is less than the turn angle limit, we should switch the maneuver alternatives from left turn or right turn, to left turn or straight. This results in a jump in Alert Zone size as shown in Figure 20. This indicates that for small heading differences, turn maneuvers alone have difficulty resolving conflicts unless large magnitude turns are performed.
25
20
15
10
-40 -35 -30 -25 -20 -15 -10 -5 0 NM
Figure 20: Envelope of Alert Zones for different relative headings
(intruder at same speed as ownship)
1I I I I I I I
The complete envelope of the Alert Zones for different relative headings is shown in Figure 20. An intruder that approaches this envelope heading towards the ownship will require avoidance maneuvering. At the envelope crossing we determine the intruder's direction and use the appropriate alert zone to resolve the conflict.
For intruder speeds faster than the ownship, some turn angles may not resolve the conflict or do so inefficiently depending upon the nominal heading difference. The avoidance maneuver set being used is then reconsidered. As shown in Figure 21, A and B are two relative heading angles where a given heading change (right and left respectively), produces no change in angle of the relative velocity. For another heading difference C, an identical change in relative velocity angle is produced for both left and right turns, and the swept areas become parallel. The alert zone then becomes infinitely long.
For Specific Intruder Velocity angles:
Vr A. Right turn of no benefit
Vi V or " LVr = L Vrr
Intruder " Relative velocity has same angle but different
magnitude for ownship straight ahead or turning
vi right
Ownship
B B. Left turn of no benefit
ZVri =LVr
Vri Relative velocity has same angle but different
vi magnitude for ownship straight ahead or turning
vi left.
Vol
C C. Left turn and right turn give same angle Vrr
Vr i ... Z Vri = ZVrr
Left turn and right turn produce same angle for relative velocity, but left turn is faster
VI
Vo= ownship velocity Vr= nominal relative velocity
Vi= intruder velocity Vri= relative velocity, left turn Vol= ownship velocity, left turn Vrr= relative velocity, right turn
Vor= ownship velocity, right turn
Figure 21: Relative headings where two different ownship velocities give same relative velocity angle
For heading differences between 1800 and angle A, we use the left turn or right turn maneuver
combination as the angle change of relative velocity for a left turn is in the opposite direction as that for a right turn, resulting in a finite Alert Zone. Between angle A and C, we switch to left turn or straight, as both left and right turns give an angle change of relative velocity in the same direction, but turning left resolves a conflict more quickly than a right turn. At C, the
relative velocity angle changes from left and right turns are in the same direction and equal. Between angle C and angle B, the right turn gives a greater change than left turn, so we switch to right turn or straight. Between B and 00, taking a left turn becomes useful again, as again the relative velocity angle change for a left turn is in the opposite direction as that for a right turn. Figure 22 shows an illustrative example. The nominal heading difference is between C and B. Hence the right-turn or straight combination gives us the smallest alert zone. A portion of the right turn or left turn alert zone is outside the straight swept area. Choosing that combination will cause some invalid alerts, and we would be asked to maneuver to avoid intruders that are not in nominally in conflict with the ownship.
The Alert Zones resulting from these optimized maneuver combinations are shown in Figure 23, for an intruder flying twice as fast as the ownship. The points on Alert Zones where the combinations change are labeled. With larger turn angles it is possible to reduce the sizes of the Alert Zones significantly. Going to 450 turn angle, the 140NM breadth of the envelope in Figure 23, can be reduced to 72NM, while the other dimensions are reduced by smaller factors. However, there might be unfavorable changes in the maneuver penalty due to increased turning angle even though we need to employ it for a shorter time, so the selection of turn angles should be done with care.
Figure 23: Maneuver combinations for different relative
( VI/Vo = 2 ) headings, 0 -Left/ Straight 20 10 0--10- Right/ Straight
-20 B Right / Left Overtaking
-30
140I I I I I60 I I I
For intruder velocities less than the ownship, these difficulties do not exist as the relative velocity angles are confined to the forward half-plane, and the left turn or right turn combination always works efficiently.
3.4 Uncertainty
The Protection Zone (PZ) used is 5NM radius by 1000ft or 2000ft altitude difference. We can allow for position uncertainty, for example due to sensor limitations, by increasing the size of the Protection Zone used in determining the Alert Zones by the position uncertainty (Figure 24). The safety buffer is then increased and we are assured that PZ penetration will not occur.
Position Error
PZ
Error + PZ
Figure 24: Combined Error and Protected Zone
We can also formulate Alert Zones for encounters where speed or heading uncertainties may exist. These uncertainties may be due to sensor error or may represent a desired safety buffer that grows with time to protect against catastrophic failure. If such an uncertainty can be bounded, then we can find an Alert Zone that resolves all conflicts within the maneuvering
capabilities of the ownship. Figure 25 shows a horizontal-resolution Alert Zone for a head on encounter where both the intruder and the ownship are traveling at 450knots. The Alert Zones for zero heading uncertainty and for ±100 heading uncertainty are shown superimposed. The scales are in nautical miles and the ownship is allowed to turn 30' left or right. To develop this Alert Zone we determine the Alert Zones for 170' and 190' relative heading angles, which are the limits of uncertainty. We then project the outer edges of these Zones until they meet. An intruder inside this larger Zone but still outside the smaller ones can be avoided if it has no heading uncertainty. However, if the uncertainty is present for an intruder such as B inside this area, we might select a left turn based upon the 170' left turn swept area. If B turns out to have a heading of 1900 then avoidance will fail, as the position B is intersected by the 1900 left turn. Enlarging the Alert Zone in the manner shown avoids this danger and successful avoidance is assured. This procedure is discussed in detail in the Appendix.