HAL Id: hal-02438293
https://hal.archives-ouvertes.fr/hal-02438293
Submitted on 22 Jan 2020
HAL is a multi-disciplinary open access
archive for the deposit and dissemination of
sci-entific research documents, whether they are
pub-lished or not. The documents may come from
teaching and research institutions in France or
abroad, or from public or private research centers.
L’archive ouverte pluridisciplinaire HAL, est
destinée au dépôt et à la diffusion de documents
scientifiques de niveau recherche, publiés ou non,
émanant des établissements d’enseignement et de
recherche français ou étrangers, des laboratoires
publics ou privés.
Forged Aluminum Alloy Studied by Synchrotron
Tomography and Finite Element Simulations
Yang Shen, Thilo Morgeneyer, Jérôme Garnier, Lucien Allais, Lukas Helfen,
Jérôme Crépin
To cite this version:
Yang Shen, Thilo Morgeneyer, Jérôme Garnier, Lucien Allais, Lukas Helfen, et al.. Quantitative
Anisotropic Damage Mechanism in a Forged Aluminum Alloy Studied by Synchrotron Tomography
and Finite Element Simulations. Advances in Materials Science and Engineering, Hindawi Publishing
Corporation, 2019, 2019, pp.1-12. �10.1155/2019/8739419�. �hal-02438293�
Research Article
Quantitative Anisotropic Damage Mechanism in a Forged
Aluminum Alloy Studied by Synchrotron Tomography and Finite
Element Simulations
Yang Shen ,
1,2Thilo F. Morgeneyer,
2J´erˆome Garnier,
1Lucien Allais,
1Lukas Helfen,
3,4and J´erˆome Cr´epin
21DEN-Service de Recherche M´etallurgique Appliqu´ee, CEA, Universit´e Paris-Saclay, F-91191 Gif-sur-Yvette, France 2MINES ParisTech, PSL Research University, Centre des Mat´eriaux, CNRS UMR 7633, BP 87, 91003 Evry, France 3ANKA/Institute for Photon Science and Synchrotron Radiation, Karlsruhe Institute of Technology (KIT),
D-76131 Karlsruhe, Germany
4European Synchrotron Radiation Facility (ESRF), BP 220, F-38043 Grenoble Cedex, France
Correspondence should be addressed to Yang Shen; yang.shen@edf.fr Received 10 June 2019; Accepted 9 July 2019; Published 25 July 2019 Guest Editor: Dariusz Rozumek
Copyright © 2019 Yang Shen et al. This is an open access article distributed under the Creative Commons Attribution License, which permits unrestricted use, distribution, and reproduction in any medium, provided the original work is properly cited. A highly anisotropic toughness behavior has been revealed on a forged AA6061 aluminum alloy by toughness tests with CT specimens. The toughness values with specimens loaded on the longitudinal direction are larger than that loaded on the transverse direction due to the anisotropic shape and distribution of coarse precipitates induced by the morphological anisotropy of grains during forging process. Synchrotron radiation computed tomography analysis on as-received material and arrested cracks revealed different fracture modes for the two loading configurations. The damage mechanism has been validated by finite element simulations based on the Gurson–Tvergaard–Needleman micromechanical damage model with different sets of damage pa-rameters for the two loading configurations obtained from quantitative void volume fraction analysis on SRCT data, in situ SEM experiments, and SRCT microstructural analysis.
1. Introduction
Aluminum alloys are often used in industrial structures for its light weight, its corrosion resistance [1], and its me-chanical properties. Toughness is a crucial meme-chanical property in the design and use of industrial metal compo-nents. The toughness is frequently appeared to be aniso-tropic for forged aluminum alloys. The study on the anisotropic feature helps engineers to predict the lifetime of industrial parts. The origin of the anisotropy of damage is associated with microstructural anisotropy [2–4].
Several models of anisotropic ductile damage, taking into account the microstructural aspects, exist in the liter-ature. These models are based on either the Gurson micromechanical model [5] or its extension developed by Tvergaard and Needleman (named GTN model) [6] or the
Lemaitre phenomenological model [7, 8]. The parameters of the GTN model have been identified by 3D synchrotron laminography by Shen et al. [9] in AA6061 aluminum alloy sheets loaded on the transverse direction. The anisotropic behavior was not taken into consideration in this article. Several authors have modified these models by taking into account the coalescence of anisotropic cavities [10–14] based on the work of Thomason [15]. These studies show an in-crease in the crack propagation resistance in the case where the cavities (or coarse precipitates) are elongated along the initial loading direction. This anisotropy of the microstruc-ture delays the coalescence of the cavities as the intercavity or interprecipitate distance in the path of the crack is larger. However, a limitation exists in these models: only coalescence by internal necking [15] is taken into account in these models, but the coalescence of microcavity-generated ligament on a Volume 2019, Article ID 8739419, 12 pages
second population of the precipitates is frequently observed in this material [16, 17].
In this article, the initial microstructure of the alloy was analyzed by synchrotron radiation computed tomography (SRCT). These observations were carried out at the Euro-pean Synchrotron Radiation Facility (ESRF) on the ID19 beamline. Samples relating to deformed states correspond to parallelepipeds in CT specimens in the region of ductile tearing. Two loading configurations have been studied: LS and TL. We will discuss later in this article these test configurations. The isotropic GTN damage model was used with two parameter sets to represent each configuration taking into account the initial microstructure of the alloy, the germination of cavities on coarse precipitates, the growth of cavities, and two mechanisms cavity coalescence: co-alescence by internal necking and coco-alescence ligament. Cavity nucleation on a secondary population of precipitates was taken into account leading to coalescence mechanism ligament. The model parameters are determined by exper-imental analysis. The results were then compared with the experimental curves of fracture toughness tests.
2. Experimental
A forged AA6061 alloy was used in this study whose chemical composition is given in Table 1. The material used was in the T6 temper (solution heat treated at 530°C during
3 h and water quenching and aged at 175°C during 12 h). The
heat treatment was defined to obtain the maximum yielding stress. More details on the manufacturing process, the microstructure, and mechanical properties of the material are described in [9, 18].
The forging direction, the long transverse direction, and the short transverse direction are referenced to the letters L,
T, and S, respectively.
Tensile tests have been performed on smooth round specimens with an initial length of 50 mm and diameter of 10 mm. These tests have been conducted through L and T loading directions with a loading rate of 10−4s−1.
Toughness tests have been carried out on CT12.5 specimens (Figure 1) to investigate the fracture properties according to the ISO standard [19]. Two loading con-figurations have been conducted: LS and TL. The first letter represents the loading direction and the second the crack propagation direction. A 2.5 mm precrack was in-troduced by crack-length-controlled fatigue cycling [20]. Tests were performed on a servohydraulic machine with a loading rate of 8.3 μm/s. At least three tests have been performed in each configuration with only a small dis-persion of results.
After being taken in the crack initiation and propa-gation region on arrested CT specimens by electrical dis-charge machining [21] (Figure 1), samples were scanned by synchrotron radiation computed tomography (SRCT) in-stalled at beamline ID19 [22] of the European Synchrotron Radiation Facility (ESRF) in Grenoble, France. We fol-lowed the methods of Shen et al. described in [9]. We used a monochromatic beam of 19 keV X-ray energy. Volumes were reconstructed from angularly equidistant 2000
projections with an exposure time of each projection of 100 ms. A voxel size of 0.7 µm was chosen. Details of the experimental method and image reconstruction are given in [23, 24].
For image analysis performed on as-received material, the analyzed volume is 700 × 700 × 700 μm3corresponding to the representative elementary volume (REV). Only objects with a size larger than 2.1 × 2.1 × 2.1 μm3 are considered. For the analysis of arrested CT samples, after the reconstruction of tridimensional images, cracks were first binarized with the morphological algorithm “con-nected threshold growing” by using the software ImageJ and then analyzed using a “sum along ray algorithm” [2, 25, 26]. A Visualization Toolkit (VTK) software routine was used to render the three-dimensional (3D) datasets and produce the 3D images. The aim was to precisely determine and quantify the local crack charac-teristics such as opening within the 3D volumes.
3. Experimental Results
3.1. Microstructure. Figure 2 shows the microstructure of
the as-received material obtained by 3D SRCT analysis. Two types of precipitates at the micrometer scale are present in this material: coarse Mg2Si and iron-rich intermetallics
[18, 27] with, respectively, their volume fraction of 0.43 ± 0.11% and 0.59 ± 0.15%. Little porosity can be ob-served with volume fraction less than 0.05%.
The granular structure of the material has been ana-lyzed by SRCT on the gallium-wetted sample. In fact, when liquid gallium is brought in contact with aluminum, gallium can penetrate the grain boundaries. Gallium has a very high X-ray attenuation coefficient compared to aluminum; this renders gallium layers visible by SRCT [28]. Figure 3 shows the superposition of reconstructed tomography images performed on the sample before and after gallium wetting. Coarse precipitates and grain boundaries can clearly be seen owing to the local segre-gation of gallium. It is observed that both coarse Mg2Si
precipitates and iron-rich intermetallics are mostly dis-tributed on grain boundaries.
The image analysis conducted on tomography data has revealed the Feret diameters [29] of precipitates defined as the diameters derived from the distance of two tangents to the contour of the particle in L, S, or T direction, referred as
FL, FS, and FT, respectively. The average values for all
pre-cipitates are listed in Table 2. Due to the forging process, these coarse precipitates have a slightly elongated shape (Figure 2).
To analyze the spatial distribution of the particles, the Voronoi diagrams [30] are often used that decompose the threshold image by cells in each of which contains a particle. The particles are assimilated as a point in this method so that the elongated shape of the particles is not taken into account.
Table 1: Chemical composition of AA6061 alloy (wt.%).
AA6061 Si Mg Fe Cr Cu Mn Zn Ti
In this study, the Voronoi cell diagram is computed on the 3D image by the watershed transform [31, 32] to overcome the limit.
Figures 4(a) and 4(b) show, respectively, 2D sections of Voronoi cells computed by the watershed transform asso-ciated with coarse Mg2Si precipitates and iron-rich
in-termetallics. The Feret diameters of cells were quantified and are shown in Table 2 for both coarse phases through L, S, and
T directions. Alignment of precipitates is shown in Figure 2
through the L direction. It is expected that the Voronoi cells are “compressed” along this direction as the interprecipitate distance is smaller in this direction. Nevertheless, this conclusion cannot be drawn for coarse Mg2Si precipitates,
which is probably due to the presence of threshold noises (small objects). This conclusion is however observed for cells of iron-rich intermetallics with a flat shape, which means an alignment of these intermetallics along the L direction.
3.2. Tensile Tests on Smooth and Notched Specimens.
Figure 5 shows the results of tensile tests on smooth specimens loaded through L and T directions. The yield strength (YS) and ultimate tensile strength (UTS) are ap-proximately identical for the two loading directions. The fracture surfaces for both loading directions are spherical, which indicates an isotropic behavior of plasticity. However, the ductility, i.e., fracture strain is significantly different, with
specimen loaded through the L direction is 3 times higher than that loaded through the T direction.
3.3. Toughness Tests. Figure 6 shows the results of toughness
tests for LS and TL configurations in terms of the force as a function of the crack mouth opening displacement (CMOD). The maximum load is higher for the LS config-uration (∼4.7 kN) as compared to the TL configconfig-uration (∼3 kN).
3.4. Fractography of CT Specimens. Fracture surfaces have
been analyzed by using the scanning electron microscope (SEM) for specimens on LS and LT configurations (Figure 7). It is found that most zones are covered by dimples at 10 to 30 μm with the presence of Mg2Si and iron-rich intermetallics
(Figure 7(a)), interconnected by submicron dimples or shear zones (Figure 7(b)). Whatever the test configuration, dimples are spherical which means that the growth of cavities is iso-tropic in the fracture plane.
For the specimen loaded in the TL configuration, the crack propagates through the direction of alignment of coarse precipitates. The fracture mode is primarily in-tergranular due to the inin-tergranular distribution of coarse precipitates. The absence of transgranular coarse precipitates requires the sudden crack bifurcation during its propagation to join another alignment of intergranular precipitates. This
30° 3 2Ø6.25 – + 00.2 Ø6 5 7.5 12.5 p.m W 25 31.25 Ø1.1 B = 12.5 = = 60° ±2° 30 == R < 0.1 = = 1.56 2.15 th. 15 == 6 == == == 2.8 2.8 a0 12.5 SRCT samples (1 × 1 × 10) mm3
bifurcation is also observed by Achon and Di Russo [33, 34], which occurs along cliffs perpendicular to the propagation plane (Figure 7(a)). Dimples are close to each other and well defined as the void coalescence takes place primarily by internal necking.
In the case of a LS test configuration, crack propagates perpendicular to the plane of alignment of coarse pre-cipitates and therefore gets through grains in their
thickness direction. Ductile dimples are smaller con-nected by smooth areas of a size close to the width of grains (Figure 7(b)). In the smooth area, submicron-sized dimples could be observed with the presence of a second population of precipitates much smaller. The authors showed that this second population of precipitates is probably homogeneously distributed dispersoids of chromium and manganese with a size between 50 nm and 300 nm [35–38]. The fracture mode for the LS configu-ration is therefore the combination of intergranular and transgranular modes. The primary void coalescence oc-curs then by shear band with a presence of void sheeting [16].
3.5. SRCT Study of Fracture Mechanism in Interrupted CT Specimens. Tomography scans of interrupted cracks allow
observation of the fracture mechanism during the crack initiation and propagation in 3D as well as the subsequent evolution of the fracture process in front of the crack tip. In this study, the CT specimens have been interrupted im-mediately after the maximum of loads is reached during toughness tests in two configurations (TL and LS) where samples in the crack initiation and propagation region have been taken and observed by SRCT (Figure 1).
Figures 8(a) and 8(b) show the local crack opening map (COD map) of those cracks for TL and LS loading con-figurations. In both configurations, we distinguish the area of the fatigue precrack region and the ductile crack
100µm S T L L T S L S T Mg2Si IMF Porosity S L T
Figure 2: Reconstructed 2D images obtained by SRCT showing the microstructure of the as-received material.
100µm “Rings” artifact
Cavities initiated on Mg2Si
Intermetallics
Figure 3: Reconstructed 2D image showing coarse Mg2Si
pre-cipitates, iron-rich intermetallics, and grain boundaries obtained by superposition of tomography images performed on the sample before and after gallium wetting. “Rings” artifact is also visible on the image.
Table 2: Feret dimensions of coarse precipitates and Voronoi cells through L, S, and T directions. Deviation is estimated to about 25% owing to the threshold uncertainty.
Mg2Si Iron-rich intermetallics FL(μm) FS(μm) FT(μm) FL(μm) FS(μm) FT(μm) Precipitates 8.5 ± 2.1 6.6 ± 1.6 5.2 ± 1.3 8.7 ± 2.1 8.3 ± 2 6.3 ± 1.5 Voronoi cells 94 ± 23 95 ± 23 104 ± 26 67 ± 16 83 ± 20 104 ± 26 150μm (a) 150μm (b)
Figure 4: Reconstructed 2D images of the Voronoi cells [30] computed by the watershed transform [31, 32] superposed with threshold
propagation. Only damage percolated with the crack is represented, whereas isolated damage in front of the crack is not shown in the COD map.
In the TL configuration (Figure 8(a)), the crack is continuously formed by spherical dimples with a size related to isolated cavity a head of the crack. The inter-damage distance is low (about 50 microns) indicating that coalescence by internal necking is dominant. Some nar-row and opened ligaments are also recognized which can be referred to cliffs observed in fracture surfaces (Figure 7(a)).
In the LS configuration (Figure 8(b)), the fatigue pre-crack is more open than in the TL configuration indicating a better resistance to the crack propagation in this configu-ration. We note an absence of well defined crack tip. The crack propagation zone is not continuous with the presence of bridges between clusters of cavities.
Figures 9(a) and 9(b) show the 2D sections through white lines in Figure 8. These sections confirm the con-clusions obtained in fractography analysis (Figure 7). For TL configuration (Figure 9(a)), the crack propagates parallel to the direction of alignment of coarse precipitates. The failure mode is mainly intergranular. For LS configuration (Figure 9(b)), in addition to the intergranular damage mode, the transgranular narrow ligaments are observed between void clusters.
Figures 9(c) and 9(d) show the 2D sections through green lines in Figure 8. For TL configuration (Figure 9(c)), the crack is continuous with small-coalesced cavities. The void coalescence by internal necking is early and rapid with a very limited void growth stage. For LS configuration (Figure 9(d)), continuous crack propagation is not observed but large clusters of cavities at grain boundaries are linked by narrow ligaments. Void coalescence takes place later by a second population of voids initiated on dispersoids of chromium and manganese [35–38].
Analysis presented in Figure 8 in terms of crack opening displacement is calculated in terms of void volume fraction in regions of interests (ROI) equal to 140 × 140 × 70 μm3. Figure 10 shows a map of average void volume fraction in each ROI in the crack propagation plane, the value selected and shown in the figure corresponds to the maximum value in the loading direction (normal to the propagation plane). Figure 11 illustrates evolution of void volume fraction averaged through width of specimens in function of distance in the crack propagation direction. The two values indicated by arrows represent the average fraction measured at crack tip of the two configurations (dotted lines in Figure 10). The position of the crack tip is chosen at the maximum crack propagation for which all void volume fraction values are nonzero. These values, 1.5% for TL configuration and 5.6% for LS configuration, will be used as critical void volume fraction at failure in the modeling.
4. Modeling
4.1. Parameter Identification. The material model is
de-scribed in Appendix A including the Voce hardening law [39] and the Gurson–Tvergaard–Needleman (GTN) damage model [5, 6] where the material damage is associated with a void volume fraction. The main material characteristic pa-rameters included in the models are (i) papa-rameters of the hardening law, (ii) preexisting voids and void nucleation parameters, (iii) void growth parameters, and (iv) void coalescence parameters.
The hardening curve is experimentally measured using tensile tests performed on smooth specimens. Beyond uniform elongation of the specimen, the true stress/strain tensile relationship was determined by using the Bridgman correction [40]. The parameters of the isotropic Voce hardening law have been fitted to the experimental data, which leads to the values presented in Table 3. The Voce law only describes stage III. The adjustment of the law is in good agreement with the experimental data (Figure 5). Stage IV could be neglected. 0 10 20 30 40 50 Section variation ΔS/S0 (%) Experimental T Experimental L FEM elastoplastic 1mm F/ S0 (MPa) 100 200 300 400 0 T L
Figure 5: Tensile tests: experimental and simulation with elasto-plastic hardening law (FEM).
Force (10 3N) 0.1 0.2 0.3 0.4 0.5 0.6 0.7 0 Experimental TL FEM TL Experimental LS FEM LS FEM elastoplastic CMOD (mm) 0 1 2 3 4 5 6
Figure 6: Experimental toughness tests and finite element simu-lations (FEMs) for configuration LS and TL.
As concluded obviously by synchrotron laminography in situ analysis [9], the coarse Mg2Si precipitates start to be
damaged in the very early loading stage. This has been confirmed in in situ SEM tensile tests (not shown here) where the coarse Mg2Si precipitates fracture already in the
elastic part of the stress-strain curve. As a consequence, these precipitates are considered as preexisting voids f0 in the
simulations.
Cavities nucleating on iron-rich intermetallics are taken into account in the void nucleation parameters. The volume fraction of iron-rich intermetallics obtained by SRCT is considered as the maximum value of the voids that could be nucleated fn. The two other parameters of the void
nucle-ation law (εn0and sn0) are determined by fitting the evolution
of density of cavities measured by image analysis during in situ SEM tensile tests and the void nucleation law (not presented here).
The values proposed by Tvergaard and Needleman [6] (q1�1.5 and q2�1) are used as void growth parameters in
the GTN model.
The quantitative analysis described in Section 3.5 pro-vides us the critical void volume fraction at failure for both configurations TL and LS. The crack extends over one el-ement when void volume fraction in ROI has reached this critical value ff�1.5% for TL configuration and ff�5.6% for
LS configuration throughout the entire element. It is noted that this value is obtained experimentally with an ROI of 140 × 140 × 70 μm3in front of the crack. The same element size must be used in finite element analysis, which is 70 × 70 × 70 μm3 with the symmetry condition around the center of specimen.
For the present material, two reasons lead us to consider that the material loses its strength once the void coalescence begins. First of all, we cannot observe any coalescence
(a) (b)
Figure 7: Fracture surfaces of toughness specimens in the crack propagation zone for (a) TL and (b) LS configurations.
0 100 200 300 400 500 600 700 800 900 µm 1200 0 µm 1100 1000 900 800 700 600 500 400 300 200 100
Crack opening displacement (in µm)
0.0 2.5 5.0 7.5 10.0 12.5 15.0 17.5 20.5 22.5 25.0 (a) 0 100 200 300 400 500 600 700 800 900 µm 0 µm 1100 1000 900 800 700 600 500 400 300 200 100
Crack opening displacement (in µm)
0.0 2.5 5.0 7.5 10.0 12.5 15.0 17.5 20.5 22.5 25.0 (b)
Figure 8: Representation of the local crack tip opening via a “sum along ray method” for (a) TL and (b) LS configurations (with lines indicating locations of the 2D sections).
(a)
(c) (d)
(b)
Figure 9: 2D sections of the SRCT data through white lines in Figure 8 for (a) TL and (b) LS configurations as well as through green lines in Figure 8 for (c) TL and (d) LS configurations.
140µm L S T f (%) Pixel 0 500 1000 1500 Pixel 0 200 400 600 800 1000 0.5 1.0 1.5 2.0 2.5 3.0 3.5 4.0 4.5 5.0 Max cod 0.0 (a) f (%) Pixel 0 500 1000 1500 Pixel 0 200 400 600 800 1000 Max cod 0.5 1.0 1.5 2.0 2.5 3.0 3.5 4.0 4.5 5.0 0.0 S T L (b)
between voids without involving the crack, which means that the crack begins to propagate at the same time or earlier than void coalescence at the present stress state. Secondly, it was observed previously by ex situ SRCT tensile tests that the damage evolution is extremely rapid after the coalescence has started. Therefore, the critical void volume fraction at coalescence fcis assumed to be the same as the critical value
at which the crack extends ff, and the acceleration
factor δ � ((fu− fc)/(ff− fc)) is thus infinite.
To sum up, the parameters used for the finite element simulations are resumed in Table 3.
4.2. Model Predictions. The finite-element simulation
tech-nique is described in Appendix B. The experimental study showed a strong anisotropy of toughness for the forged AA6061 aluminum alloy. The toughness is significantly lower in TS configuration than in LS configuration. The two configurations have been simulated by using different sets of damage parameters of the GTN model.
Figure 6 shows load-CMOD curves for both experi-mental results and finite element simulation results for CT
specimens in TL and LS configurations. Only the parameters of critical void volume fraction at coalescence and failure are different for the two configurations, i.e., fc�ff�1.5% for TS
configuration and fc�ff�5.6% for LS configuration.
In the case of TL configuration (red symbols and curve in Figure 6), the maximum load and the opening displacement are well predicted. It should be noted that no parameter is adjusted to obtain a good agreement between simulations and experimental results.
In the case of LS configuration (green symbols and curve in Figure 6), the simulation has overestimated the maximum load because the critical failure parameter ff�5.6% is too
high. This can be improved by a more precise identification of the parameters. As we have shown in Sections 3.4 and 3.5, the intergranular and transgranular failure modes coexist in this configuration. Coalescence between void clusters takes place on narrow ligaments across grains involving the nucleation, growth, and coalescence of a second population of pre-cipitates, i.e. dispersoids of chromium and manganese. This second damage mechanism during coalescence of the primary voids is partly neglected in the traditional GTN model.
5. Conclusions
Toughness tests on CT specimens have been carried out in two loading configurations: TL and LS on a forged AA6061 aluminum alloy in T6 condition. The material is highly anisotropic in terms of toughness values with LS configu-ration larger than TL configuconfigu-ration. Nevertheless, tensile tests performed on smooth specimens reveal an isotropic plastic behavior, which is used to fit an isotropic Voce hardening law. A previous study by in situ synchrotron laminography [9] and fractography of CT specimens have concluded fracture mechanisms linked to coarse precipitates and shear bands. The anisotropy of toughness is due to the anisotropic shape and distribution of coarse precipitates induced by the morphological anisotropy of grains. An-isotropic initial shape and distribution of coarse precipitates have been identified through SRCT studies of the as-received material. SRCT analysis of arrested cracks has revealed different fracture modes for the configurations TL and LS. Voids nucleate first on coarse Mg2Si precipitates, followed
by growth and coalescence. The iron-rich intermetallics enter in this procedure much later. Void coalescence is easier if the coarse precipitates are close to each other. For TL configuration, the coarse precipitates are intergranular and aligned in the plane of crack propagation. Void coalescence takes place by internal necking and the crack propagates mainly by the intergranular failure mode where the fracture energy is lower. For LS configuration, the coarse precipitates are aligned perpendicular to the plane of the crack propa-gation. Intergranular and transgranular fracture modes coexist in this case and the fracture energy is therefore higher [3, 41]. The void coalescence takes place by internal necking and a second mechanism on a second population of pre-cipitates, i.e., dispersoids of chromium and manganese [35, 38].
The quantitative void volume fraction analysis has been conducted on SRCT data of the arrested cracks for the two
Mean void volume fraction through thickness (%)
1.5 (%) 5.6 (%) LS TL 300 600 900 1200 0
Distance through propagation direction (µm) 0 5 10 15 20 25 30
Figure 11: Evolution of mean void volume fraction, averaged through the width of the specimen, in function of the distance in the direction of crack propagation. The two values in red and blue represent the average fraction measured at crack tip (dotted lines in Figure 10).
Table 3: Parameters identified for SRCL finite element simulations.
(i) (ii) Voce hardening law
E in GPa ] σ0in MPa σsin MPa b
70 0.33 288 375 12
(iii) (iv) Preexisting voids and void nucleation
f0 fn εn0 sn0
0.43% 0.59% 10% 0.1
(v) (vi) Void growth
q1 q2
1.5 1
(vii) (viii) Void coalescence
fc δ ff
TL 1.5% ∞ 1.5%
LS 5.6% ∞ 5.6%
(ix) (x) Element sizes
configurations. The void volume fraction at crack tip was evaluated at 1.5% for TL configuration and 5.6% for LS configuration for a region of interests of 140 × 140 × 70 μm3. The anisotropic damage mechanism has been validated by the finite element simulations based on the GTN micromechanical damage model with different sets of damage parameters for different configurations. The void volume fraction at crack tip was used as the critical void volume fraction for failure of elements with the same ele-ment size. Other parameters were identified by in situ SEM experiments and SRCT microstructural analysis. In this identification procedure, all parameters were identified experimentally by a local approach and in situ observation without parameter adjustment. Finite element simulation conducted on the CT specimens shows the good agreement for TL configuration, whereas the simulation on LS con-figuration overestimates the maximum load owing to the neglecting of the role of second population of precipitates.
Appendix
A. Material Models
A1. Voce Hardening Law. The plastic hardening is
repre-sented by a Voce-type stress saturation equation and is expressed as follows [39]:
σ � σs+ σ0− σsexp(−bε), (A.1)
where σ0 is the yielding stress and σs and b are the
un-damaged material constants.
A2. GTN Damage Model. The Gurson–Tvergaard–Needleman
(GTN) micromechanical model [5, 6] is used to introduce damage which is represented by a single scalar variable, the void volume fraction f. The plastic flow potential Φ is written as follows: � �σ 2 eq σ2 y +2q1f ∗ cosh 3q2 2 σm σy − 1 − q1f ∗ 2�0. (A.2)
The function f∗is the effective porosity and is justified to
describe the onset of the void coalescence beyond a critical porosity fc. The void coalescence is represented by an
ac-celeration of damage rate [6] with
f∗� f, f< fc,
fc+δ f − fc, f≥ fc,
(A.3)
where q1 and q2are the void growth parameters involving
the yield surface, σy is the yielding stress of nondamaged
material, and δ � ((fu− fc)/(ff− fc)) is the void
co-alescence acceleration factor. The material loses its stress carrying capacity at f � ff. In this case, the crack is assumed to
propagate.
The evolution of void volume fraction includes two parts: the growth of the existing voids and the nucleation of new voids. The increase of void volume fraction in the model is written as
_
f � _fg+ _fn. (A.4)
Because the matrix material is incompressible, the growth part _fg is related to the equivalent plastic strain _εpeq and is described as
_
fg� (1 − f)_εpeq. (A.5) Chu and Needleman [42] expressed the void nucleation rate by a distribution function considering the heteroge-neous nucleation process. This void nucleation law is de-pendent exclusively on the equivalent plastic strain:
_
fn� A_εpeq. (A.6)
The coefficient A is selected so that the void nucleation follows a normal distribution function [42] described as
A � fn0 sn0√��2π�exp 1 2− εpeq− εn0 sn0 2 ⎛ ⎝ ⎞⎠, (A.7)
where fn0is the maximum value of nucleated void fraction,
εn0is the mean strain for which the nucleation appears, and
sn0represents the deviation of the mean strain for which the
nucleation appears.
B. Simulation Technique
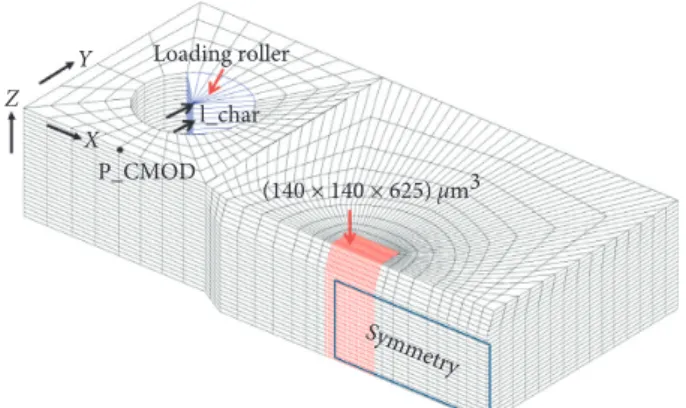
The GTN model was implemented in the finite element software Cast3m (http://www-cast3m.cea.fr/), developed by the CEA in France. Due to symmetry, a quarter of the three-dimensional SRCL specimen is meshed by using quadratic elements with reduced integration (Figure 12).
When modeling crack propagation using continuum damage mechanics, the crack is a thin volume which height is half the element height in the case of quadratic elements with reduced integration (type CU20 with 20 nodes and 8 Gauss points) [43]. The mesh is refined in the crack region with element size of about 140 × 140 × 140 µm3, which means 70 × 70 × 70 μm3for inter Gauss point size equivalent to the size of ROI in the quantitative experimental analysis in Section 3.5 with respect to the symmetric condition. The loading roller of experimental setup is modeled as a rigid body. The friction is neglected between roller and specimen. Loading is applied via imposed displacement through the Y-axis at line l_char. The same as in the experimental analysis,
Loading roller l_char (140 × 140 × 625) µm3 Y X Z P_CMOD Symmetry
Figure 12: 3D mesh of the quarter of the CT specimen with loading roller.
δ5 is calculated at every loading step as twice the
dis-placement of the marker P_δ5 positioned on the surface of the specimen at 2.5 mm through the Y-axis.
Data Availability
All data used in this article are restricted by the French Atomic Energy and Alternative Energy Commission in order to protect privacy. Requests for data may be con-sidered by the corresponding author for researchers who meet the criteria for access to confidential data under conditions.
Conflicts of Interest
The authors declare that they have no conflicts of interest.
Acknowledgments
The authors would like to thank Pierre Wident and David Leboulch from CEA as well as Henry Proudhon and Frank Nguyen from Centre des Materiaux of Mines ParisTech for technical support.
References
[1] R. S. Alwitt, “The Aluminium-Water System,” in Oxide and
Oxide Films, J. W. Diggle and A. K. Vijh, Eds., Marcel Dekker,
New York, NY, USA, 1976.
[2] T. F. Morgeneyer, J. Besson, H. Proudhon, M. J. Starink, and I. Sinclair, “Experimental and numerical analysis of toughness anisotropy in AA2139 Al-alloy sheet,” Acta Materialia, vol. 57, no. 13, pp. 3902–3915, 2009.
[3] D. Lassance, D. Fabregue, F. Delannay, and T. Pardoen, “Micromechanics of room and high temperature fracture in 6xxx Al alloys,” Progress in Materials Science, vol. 52, no. 1, pp. 62–129, 2007.
[4] D. Steglich, W. Brocks, J. Heerens, and T. Pardoen, “An-isotropic ductile fracture of Al 2024 alloys,” Engineering
Fracture Mechanics, vol. 75, no. 12, pp. 3692–3706, 2008.
[5] A. L. Gurson, Plastic Flow and Fracture Behavior of Ductile
Materials Incorporating Void Nucleation, Growth and In-teraction, Brown University, Rhode, RI, USA, 1975.
[6] V. Tvergaard and A. Needleman, “Analysis of the cup-cone fracture in a round tensile bar,” Acta Metallurgica, vol. 32, no. 1, pp. 157–169, 1984.
[7] J. Lemaitre, R. Desmorat, and M. Sauzay, “Anisotropic damage law of evolution,” European Journal of Mechanics-A/
Solids, vol. 19, no. 2, pp. 187–208, 2000.
[8] Y. Hammi and M. F. Horstemeyer, “A physically motivated anisotropic tensorial representation of damage with separate functions for void nucleation, growth, and coalescence,”
In-ternational Journal of Plasticity, vol. 23, no. 10-11, pp. 1641–1678,
2007.
[9] Y. Shen, F. T. Morgeneyer, J. Garnier, L. Allais, L. Helfen, and J. Cr´epin, “Three-dimensional quantitative in situ study of crack initiation and propagation in AA6061 aluminum alloy sheets via synchrotron laminography and finite-element simulations,” Acta Materialia, vol. 61, no. 7, pp. 2571–2582, 2013.
[10] A. A. Benzerga, J. Besson, and A. Pineau, “Anisotropic ductile fracture,” Acta Materialia, vol. 52, no. 15, pp. 4623–4638, 2004.
[11] A. A. Benzerga, J. Besson, and A. Pineau, “Anisotropic ductile fracture,” Acta Materialia, vol. 52, no. 15, pp. 4639–4650, 2004.
[12] M. Gologanu, J.-B. Leblond, G. Perrin, and J. Devaux, “Theoretical models for void coalescence in porous ductile solids. I. Coalescence “in layers”,” International Journal of
Solids and Structures, vol. 38, no. 32-33, pp. 5581–5594, 2001.
[13] T. Pardoen and J. W. Hutchinson, “Micromechanics-based model for trends in toughness of ductile metals,” Acta
Materialia, vol. 51, no. 1, pp. 133–148, 2003.
[14] T. Pardoen and J. W. Hutchinson, “An extended model for void growth and coalescence,” Journal of the Mechanics and
Physics of Solids, vol. 48, no. 12, pp. 2467–2512, 2000.
[15] P. F. Thomason, “A three-dimensional model for ductile fracture by the growth and coalescence of microvoids,” Acta
Metallurgica, vol. 33, no. 6, pp. 1087–1095, 1985.
[16] W. M. Garrison Jr. and N. R. Moody, “Ductile fracture,”
Journal of Physics and Chemistry of Solids, vol. 48, no. 11,
pp. 1035–1074, 1987.
[17] F. Bron, J. Besson, and A. Pineau, “Ductile rupture in thin sheets of two grades of 2024 aluminum alloy,” Materials
Science and Engineering: A, vol. 380, no. 1-2, pp. 356–364,
2004.
[18] Y. Shen, J. Garnier, L. Allais, J. Crepin, O. Ancelet, and J.-M. Hiver, “Experimental and numerical characterization of anisotropic damage evolution of forged Al6061-T6 alloy,”
Procedia Engineering, vol. 10, pp. 3429–3434, 2011.
[19] ISO12135, Metallic Materials—Unified Method of Test for the
Determination of Quasistatic Fracture Toughness, ISO, Geneva,
Switzerland, 2002.
[20] W. F. Brown, Review of Developments in Plane Strain Fracture
Toughness Testing, ASTM International, Philadelphia, WA,
USA, 1970.
[21] K. H. Ho and S. T. Newman, “State of the art electrical discharge machining (EDM),” International Journal of
Ma-chine Tools and Manufacture, vol. 43, no. 13, pp. 1287–1300,
2003.
[22] T. Weitkamp, P. Tafforeau, E. Boller et al., “Parallel-beam im-aging at the ESRF beamline ID19: current status and plans for the future,” in Proceedings of the 10th International Conference on
Synchrotron Radiation Instrumentation, R. Garrett, I. Gentle,
K. Nugent, S. Wilkins Eds., vol. 1234, p. 83, American Institute of Physics (AIP), Melville, NY,USA, September 2010.
[23] A. Myagotin, A. Voropaev, L. Helfen, D. H¨anschke, and T. Baumbach, “Efficient volume reconstruction for parallel-beam computed laminography by filtered backprojection on multi-core clusters,” Journal of Parallel and Distributed
Computing, vol. 22, no. 12, pp. 5348–5361, 2013.
[24] L. Helfen, A. Myagotin, P Mikulik et al., “On the imple-mentation of computed laminography using synchrotron radiation,” Review of Scientific Instruments, vol. 82, no. 6, article 063702, 2011.
[25] H. Toda, I. Sinclair, J.-Y. Buffi`ere et al., “Assessment of the fatigue crack closure phenomenon in damage-tolerant alu-minium alloy byin-situhigh-resolution synchrotron X-ray microtomography,” Philosophical Magazine, vol. 83, no. 21, pp. 2429–2448, 2003.
[26] T. F. Morgeneyer, M. J. Starink, and I. Sinclair, “Evolution of voids during ductile crack propagation in an aluminium alloy sheet toughness test studied by synchrotron radiation com-puted tomography,” Acta Materialia, vol. 56, no. 8, pp. 1671–1679, 2008.
[27] H. Agarwal, A. M. Gokhale, S. Graham, and
under triaxial stress state,” Materials Science and Engineering:
A, vol. 341, no. 1-2, pp. 35–42, 2003.
[28] W. Ludwig and D. Bellet, “Penetration of liquid gallium into the grain boundaries of aluminium: a synchrotron radiation microtomographic investigation,” Materials Science and
En-gineering: A, vol. 281, no. 1-2, pp. 198–203, 2000.
[29] ISO13322-1, Particle Size Analysis—Image Analysis Methods–
Part 1: Static Image Analysis Methods, ISO, Geneva, Switzerland,
2004.
[30] G. M. Voronoi, “Nouvelles applications des parametres continus a la theorie des formes quadratiques. Primiere memoire. Sur quelques preprietes des formes quadratiques positives parfaites,” Journal f¨ur die Reine und Angewandte
Mathematik, vol. 133, p. 97, 1907.
[31] Q. Wu, F. Merchant, and K. Castleman, Microscope Image
Processing, Academic Press, Cambridge, MA, USA, 2008.
[32] S. Beucher and C. Lantuejoul, “Use of watersheds in contour detection,” in Proceedings of the International Workshop on
Image Processing: Real-Time Edge and Motion Detection/ Estimation, Rennes, France, September 1979.
[33] P. Achon, “Comportement et t´enacit´e d’alliages d’aluminium `a haute r´esistance,” Th`ese, Ecole Nationale Sup´erieure des Mines de Paris, Paris, France, 1994.
[34] E. Di Russo, “Microfractographic characteristics and fracture toughness of 7000 and 2000 series aluminium alloys: proposal of a static fracture model,” Metallurgical Science and
Tech-nology, vol. 4, p. 37, 1986.
[35] J. A. Walsh, K. V. Jata, and E. A. Starke Jr., “The influence of Mn dispersoid content and stress state on ductile fracture of 2134 type Al alloys,” Acta Metallurgica, vol. 37, no. 11, pp. 2861–2871, 1989.
[36] R. H. Stone and J. A. Psioda, “Discussion of “metallurgical factors affecting fracture toughness of aluminum alloys”,”
Metallurgical Transactions A, vol. 6, no. 4, pp. 668–670, 1975.
[37] I. Kirman, “The relation between microstructure and toughness in 7075 aluminum alloy,” Metallurgical and
Ma-terials Transactions B, vol. 2, p. 1761, 1971.
[38] K. C. Prince and J. W. Martin, “The effects of dispersoids upon the micromechanisms of crack propagation in Al-Mg-Si al-loys,” Acta Metallurgica, vol. 27, no. 8, pp. 1401–1408, 1979. [39] E. Voce, “The relationship between stress and strain for homogeneous deformations,” Journal of the Institute of
Metals, vol. 74, p. 537, 1948.
[40] P. W. Bridgman, Studies in Large Plastic Flow and Fracture
with Special Emphasis on the Effects of Hydrostatic Pressure,
McGraw-Hill, New York, NY, USA, 1952.
[41] T. Pardoen, D. Dumont, A. Deschamps, and Y. Brechet, “Grain boundary versus transgranular ductile failure,” Journal
of the Mechanics and Physics of Solids, vol. 51, no. 4,
pp. 637–665, 2003.
[42] C. C. Chu and A. Needleman, “Void nucleation effects in biaxially stretched sheets,” Journal of Engineering Materials
and Technology, vol. 102, no. 3, p. 249, 1980.
[43] F. Bron and J. Besson, “Simulation of the ductile tearing for two grades of 2024 aluminum alloy thin sheets,” Engineering
Corrosion
International Journal ofHindawi
www.hindawi.com Volume 2018
Advances in
Materials Science and Engineering
Hindawi www.hindawi.com Volume 2018 Hindawi www.hindawi.com Volume 2018 Journal of
Chemistry
Analytical Chemistry International Journal of Hindawi www.hindawi.com Volume 2018Scientifica
Hindawi www.hindawi.com Volume 2018Polymer Science
International Journal of Hindawiwww.hindawi.com Volume 2018
Hindawi
www.hindawi.com Volume 2018
Advances in
Condensed Matter Physics
Hindawi www.hindawi.com Volume 2018 International Journal of
Biomaterials
Hindawi www.hindawi.com Journal ofEngineering
Volume 2018Applied Chemistry
Journal ofHindawi www.hindawi.com Volume 2018
Nanotechnology
Hindawi www.hindawi.com Volume 2018 Journal of Hindawi www.hindawi.com Volume 2018 High Energy PhysicsAdvances inHindawi Publishing Corporation
http://www.hindawi.com Volume 2013 Hindawi www.hindawi.com


![Figure 4: Reconstructed 2D images of the Voronoi cells [30] computed by the watershed transform [31, 32] superposed with threshold precipitates: (a) coarse Mg 2 Si precipitates; (b) iron-rich intermetallics.](https://thumb-eu.123doks.com/thumbv2/123doknet/12678236.354212/6.900.165.735.263.1058/reconstructed-watershed-transform-superposed-threshold-precipitates-precipitates-intermetallics.webp)