Intercomparison of ILAS-II Version 1.4 and Version 2 target parameters with MIPAS-Envisat measurements
Texte intégral
Figure


Documents relatifs
Title Page Abstract Introduction Conclusions References Tables Figures ◭ ◮ ◭ ◮ Back Close. Full Screen
Title Page Abstract Introduction Conclusions References Tables Figures ◭ ◮ ◭ ◮ Back Close.. Full Screen
Title Page Abstract Introduction Conclusions References Tables Figures ◭ ◮ ◭ ◮ Back Close.. Full Screen
Issartel Title Page Abstract Introduction Conclusions References Tables Figures J I J I Back Close Full Screen / Esc..
Title Page Abstract Introduction Conclusions References Tables Figures ◭ ◮ ◭ ◮ Back Close. Full Screen
Matthias Title Page Abstract Introduction Conclusions References Tables Figures ◭ ◮ ◭ ◮ Back Close. Full Screen
Schl ¨ussel Title Page Abstract Introduction Conclusions References Tables Figures J I J I Back Close Full Screen / Esc.. Print Version
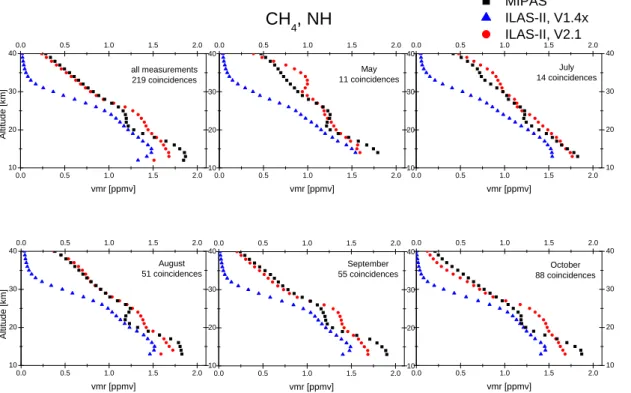
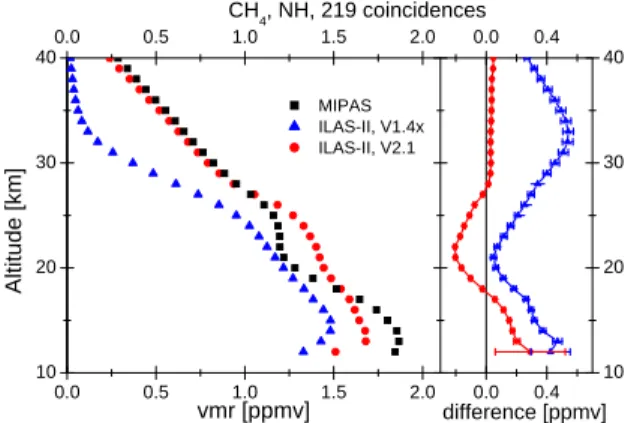
There is good agreement below 25 km and above 38 km with mean differences (Fig.. Steck et al. Title Page Abstract Introduction Conclusions References Tables Figures ◭ ◮ ◭ ◮ Back
