Development of high-speed two-photon microscopy for
biological and medical applications
by Ki Hean Kim
Submitted to the Department of Mechanical Engineering
in partial fulfillment of the requirements for the degree of Doctor of Philosophy in Mechanical Engineering
at the
~~at the MASSACHUSE S INS E
MASSACHUSETTS INSTITUTE OF TECHNOLOGY OF TECHNOLOGY
June 2005 JUN 162005
(C Massachusetts Institute of Technology 2005. All rights reserved
LIRARI
Author
...
...
...
...
A^ ---__Department of Mechanical Engineering June 3, 2005
Certified
by ... ...
..
...
... ...
George Barbastathis Professor of Mechanical Engineering
Certified
by...
Bevin P. Engelward Professor of Biological Engineering Certified by .../ . ...
a /- Ian W. Hunter
Professor of Mechanical Engineering
Certified
by ...
...
..
..
: _..
...
...
..
Peter T. C. So Thesis Committee Chairman, Profe of Mechanical Engineering and Biological Engineering Thesis Supervisor
Accepted
by ... .... ... ... ... .
...
...
Lallit Anand
ARCHIV -II Chairman, Departmental Committee on Graduate Students
Development of high-speed two-photon microscopy for
biological and medical applications
by Ki Hean Kim
Submitted to the Department of Mechanical Engineering
in partial fulfillment of the requirements for the degree of Doctor of Philosophy in Mechanical Engineering
Abstract
Two-photon microscopy (TPM) is one of the most powerful microscopic technologies for in-vivo 3D tissue imaging up to a few hundred micrometers. It has been finding important applications in neuronal imaging, tumor physiology study, and optical biopsy. A practical limitation of TPM is its slow imaging speed (0.3 1 frames/s). We designed high-speed two-photon microscopes (HSTPMs) whose imaging speed is more than 10 times faster than traditional TPM, while their imaging depths, image contrast are comparable to those of TPM. The first high speed system is HSTPM based on polygonal mirror scanner. The scanning speed reaches 13 frames/s for typical tissues using a polygonal mirror scanner. This system is based on single-focus scanning and single-pixel signal collection. The usage of higher input power is required to compensate for the signal reduction due to higher scanning speed. However, since fluorescence signal is ultimately limited by the saturation of fluorophores due to their finite lifetimes, is the signal to noise ratio (SNR) of single focus scanning systems are also ultimately limited at high speed. This problem is circumvented in a second system based on parallelization by scanning specimens with multiple foci of excitation light and collecting signals with spatially resolved detectors. The imaging speed is increased proportional to the number of foci and similar excitation laser power per focus circumventing the problem of fluorophore saturation. However, it has been recognized that this method is severely limited for deep tissue imaging due to photon scattering. We quantitatively measured the photon scattering effect and demonstrated that its image resolution is the same as conventional TPM but its image contrast is degraded to the faster signal decay with the increase of imaging depth. We designed a new MMM based on multi-anode photomultiplier tube (MAPMT) which utilizes the advantage of MMM in terms of parallelization but overcomes the emission photon scattering problem by optimizing the design detector geometry. This method achieved equivalent SNR as conventional TPM with imaging speed more than 10 times higher
than TPM. We applied these HSTPMs to a number of novel biomedical applications focusing on studying biological problems that needs to resolve the high speed kinetics processes or or the imaging of large tissue sections with subcellular resolution to achieve the requisite statistical accuracy. In the study of transdermal drug delivery mechanisms with chemical enhancers,, large section imaging enables microscopic transport properties to be measured even in skin which is highly topographical heterogeneous. This methodology allowed us to identify the novel transport pathways through the stratum corneum of skin. In the study of tumor physiology, microvasculature in tumor tissue deep below the surface was characterized to be densely distributed and tortuous compared to that of normal tissue. The interaction of leukocyte and endothelium in tumor tissue was measured by imaging the kinetics of leukocyte interaction with blood vessel wall in tumor tissues using HSTPM. The capability of large section imaging was further applied to develop a 3D tissue cytometer with the advantages that cell and cell-extracellular matrix interaction can be quantified in tissues. The statistical accuracy of this instrument was verified by quantitatively measuring cell population ratios in engineered tissue constructs composed of a mixture of two cell subpopulations. Further, this 3D tissue cytometer was applied to screen and to identify rare recombination events in transgenic mice that carry novel fluorescent genetic reporters.
Thesis Supervisor: George Barbastathis Title: Professor of Mechanical Engineering Thesis Supervisor: Bevin P. Engelward Title: Professor of Biological Engineering Thesis Supervisor: Ian W. Hunter
Title: Professor of Mechanical Engineering Thesis Supervisor: Peter T. C. So
Title: Thesis Committee Chairman, Professor of Mechanical Engineering and Biological Engineering
Acknowledgement
I will never forget my graduate period at MIT. It was the best time of my school life. I worked quite hard, learned a lot and could figure out roughly what I want to do after school.
Of course, I couldn't have gone through without good people around me. I like to thank my advisor, Prof. Peter So first. Not to mention his excellence in research and teaching, he supported me in other aspects. He inspired me to move forward, trusted me, and showed great patience. He also showed how joyful it is to do research. He was a role model I want to follow. Another teacher I like to thank is Christof Buehler. We worked together in laboratory and he taught me how to design electronics circuit in practice. He also gave me endless advice and support. My thesis committee members, Prof. George Barbastathis, Prof. Bevin P. Engelward, and Prof. Ian W. Hunter spa-red their time and gave valuable advices to me.
I had many good colleagues who helped me and from whom I learned a lot. Lily Hsu Laiho was always ready to listen and advise me in all aspects. Hyuk-Sang Kwon, Daekeun Kim and Euiheon Chung gave their help whenever I needed. Judy Su was always happy to talk over cookies. Maxine Jonas showed me how to organize things. Michael Previte, and Serge Pelet were ready to answer my questions in Chemistry and Biology. Karsten Bahlmann and Tim Ragan had valuable discussion with me on various projects. Siavash Yazdanfar advised me how to make job search and social relationship. Carson Chen and Tiger Bee were always nice to me and stayed in the office with me.
I had many nice collaborators to thank. Betty Yu from Prof. Langer and Prof. Blankschtein laboratory in Chemical Engineering, MIT and I worked very productively that we could publish many papers and she also supported me to apply for academic positions afterward. Molly Stitt, Carrie Hendricks, Foster Kerrison from Prof. Engelward laboratory in Biological Engineering, MIT prepared many specimens for me and taught me cell culture. Wei-Chung Allen Lee from Prof. Nedivi laboratory in Brain and Cognitive Science, MIT prepared brain tissue specimens whenever I asked. Brendan Harley from Prof. Yannas laboratory in Mechanical Engineering, MIT generously provided material for my experiments.
I also like to thank my wife, Sunyoung Park. We encouraged each other in the final stage of graduate period. She was the person who helped me keep up writing my dissertation. She and I will continue to pursuit more achievement and contribution and love in the future. At last, I want to thank my family, especially my parents. My father gave me his endless support for me to get Ph.D. degree. My mother dedicated her life to raise her children. They sometimes talked about getting Ph.D. from MIT and I am very happy to give them my dissertation.
Table of contents
1. Introduction ... 14
1.1. Introduction of optical techniques ... ... 14
1.2. Two-photon microscopy (TPM ) ... 15... 15
1.2.1. Principle of two-photon excitation ... 15
1.2.2. TPM Design ... 18
1.2.3. M ajor advantages of TPM for biomedical imaging ... 19
1.2.4. Applications of TPM ... ... ... 22
1.3. High speed TPM ... ... 23
1.4. Statement of work ... 25
2. The development and applications of a high-speed two-photon microscopy (HSTPM) based on polygonal mirror scanner ... ... 27
2.1. HSTPM based on polygonal mirror scanner ... 27
2.1.1. Introduction ... 27
2.2. Instrument design ... 28
2.2.1. Experiments ... 32
2.2.2. Conclusions ... ... 36
2.3. Quantification of transdermal molecular transport kinetics with chemical enhancer ... 37
2.3.1. Introduction ... 37
2.3.2. Experiment ... ... 40
A Fluorescent probe selection ... 40
B Bulk permeability measurement ... 41
C Skin Sample Preparation for Imaging Experiment ... 42
D Two-photon 3D imaging ... 42
2.3.3. Results ... 44
A Visualization of wide-area axial scans ... 44
B Quantification of relative changes in transport properties ... 45
2.3.4. Conclusion ... 464... 2.4. Visualization of oleic acid-induced transdermal transport pathway ... 47
2.4.1. Introduction ... 47
A Skin sample preparation ... 48
B Two-photon imaging . ... 48
C Data Analysis ... 50
2.4.2. Conclusion ... 53
2.5. Tumor physiology study: microvasculature and leukocyte-endothelial interactions ... 54
2.5.1. Introduction ... ... 54
A Animal model : dorsal skin-fold chamber ... 54
B Imaging of tumor vasculature ... ... 55
C M onitoring leukocyte-endothelium (L-E) interaction ... 56
2.5.2. Conclusion ... 58
3. Multifocal multiphoton microscope based on multi-anode photomultiplier tube (MAPMT) ... 59
3.1. Implications of tissue turbidity in M M M ... 59
3.1.1. Introduction ... 59
3.1.2. Results and Discussion ... 63
A Resolution variation due to emission photon scattering ... 63
B Signal decay due to photon scattering... 65
3.1.3. Conclusion ... 71
3.2. Multifocal multiphoton microscope based on MAPMT . ... 72
3.2.2. Instrument ... 74
3.2.3. Results and discussion ... 77
3.2.4. Conclusion ... 86
3.3. Three-dimensional tissue cytometer ... 87
3.3.1. Introduction ... 87
3.3.2. System characterization ... 90
3.3.3. Procedures and Results ... 91
A Rare cell detection in 2D and 3D cell culture ... 91
B Rare cell detection in ex vivo tissue ... 101
C Detection of recombinant cells ... 102
D Discussion ... 104
3.3.5 Conclusion ... 105
4. Incorporating complementary modalities with two-photon microscopy ... 108
4.1. Two-photon fluorescence and confocal reflected light imaging of thick tissues ... 108
4.1.1. Introduction ... 108
4.1.2. Design of a two-photon fluorescence and confocal reflected light deep tissue microscope ... 110
4.1.3. Results and discussion ... 111
4.1.4. Conclusion ... 112
4.2. Single-photon counting multi-color two-photon microscope . ... 115
4.2.1. Introduction ... 115
A Spectral imaging techniques ... 115
B Spectral-resolving devices ... 116
C Photodetectors ... 117
D Detector readout electronics ... 120
4.2.2. Experimental apparatus and description ... ... 122
A Experimental setup ... 122
B The multi-channel photon counting card ... ... 123
4.2.3. Experimental result and discussion ... 127
C Instrument calibration ... 127
D Spectral imaging of microspheres ... 128
E Spectral tissues imaging ... 130
4.2.4. Conclusions ... 131
5. Conclusion ... 132
5.1. Summary ... 132
List of figures
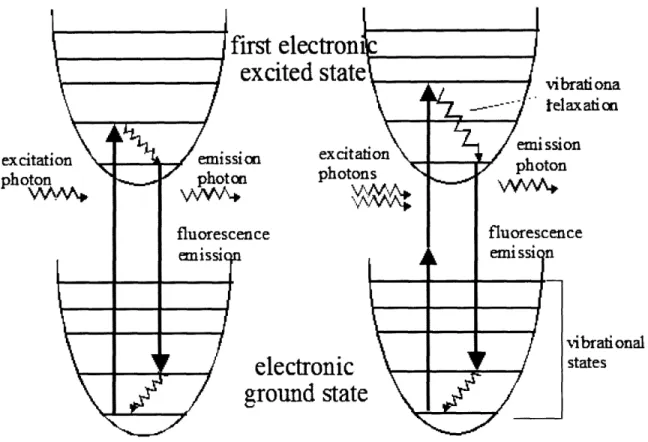
Fig. 1-1: Electronic energy diagram for two-photon excitation of fluorophores. Left side is for typical fluorescence and right side is for two-photon fluorescence. Fluorophores are excited by absorbing two excitation photons simultaneously where the energy for each excitation photon is half for excitation transition ... 16 Fig. 1-2: (a) Spatial distribution of two-photon excitation, horizontal axis is optical axis (z) and
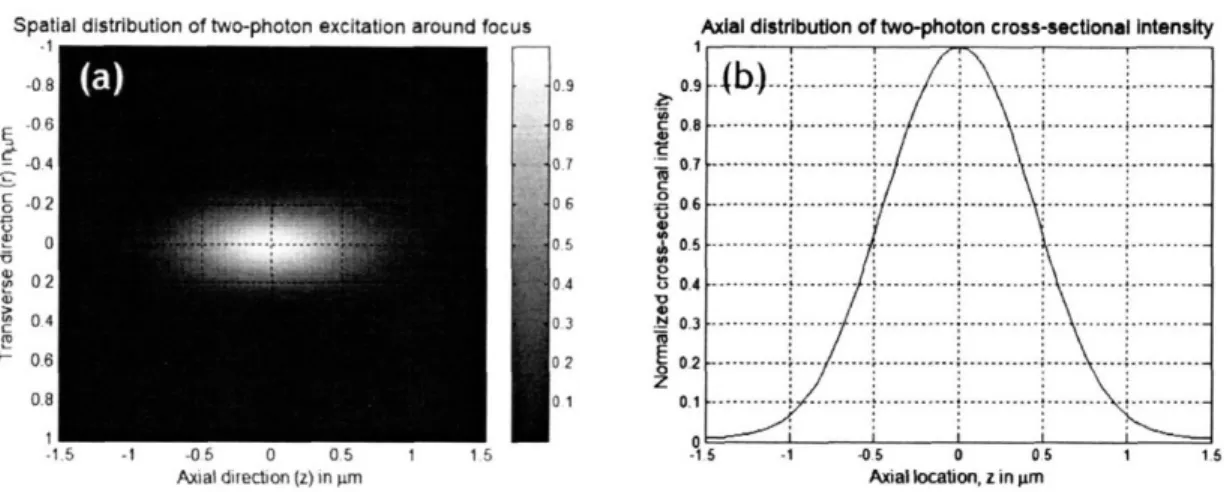
vertical axis is transverse axis (r). The distribution is symmetrical around the optical axis. FWHM in z is 1.0 tm and FWHM in r is 0.3 im with 1.0 NA and 800 nm excitation wavelength. (b) The distribution of fluorescence intensity integrated on transverse plane as
function of z. Two-photon excitation has 3D optical sectioning because the quadratic relationship suppresses fluorescence generation from the cross sections which are out of focus ... 17 Fig. 1-3: Configuration of two-photon microscopy. Excitation light from Ti-Sa laser is focused in a specimen by an objective lens. An x-y scan mirror scans the focus of excitation light in the specimen. The fluorescent photons generated from the scanned points in the specimen are collected by photomultiplier tube (PMT) imaging; a pulsed femtosecond laser is used as excitation light source. A detailed description is followed ... 18 Fig. 1-4: Scattering of emission photons. In confocal microscopy, a pinhole in front of detector rejects scattered emission photons and collects only ballistic photons as signal. Two-photon microscopy does not need a pinhole because emission photons are generated only at the focus ofexcitation light. Therefore, a detector with a large detection area can collect all the photons, which arrive at the detector, as signal ... 22 Fig. 2-1: Schematic of HSTPM based on polygonal mirror. Polygonal mirror spins at a constant
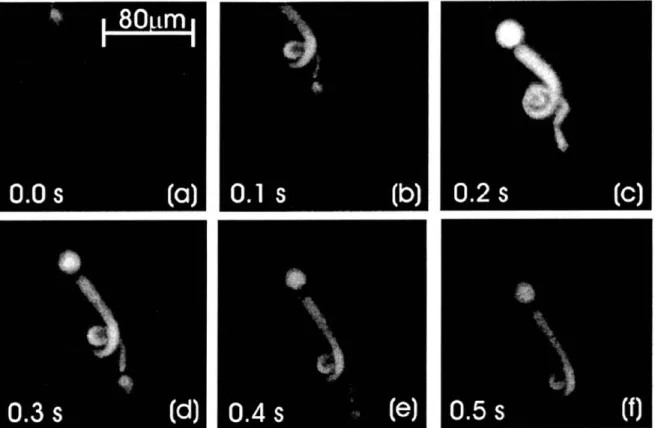
speed. Turning of each facet of the polygonal mirror generate a line scan along the fast axis. A pair of relay lens deflects the excitation beam to a galvanometer-driven mirror scanner. This mirror scanner moves the excitation beam along the slow axis ... 28 Fig. 2-2: (a)-(c) Time series of a 100-ptm piezo-induced linear movement of 2 im, yellow-green spheres. Three typical images of a movie of 100 frames are depicted. (d) Accumulative image over the same time course as in (a) ... ... 31 Fig. 2-3: Two-photon, 3-D resolved images of mitochondria distribution in mouse fibroblast cells as revealed with dihydrorhodamine labeling. Left panel shows a typical two-dimensional slice. Right panel shows the 3-D reconstruction ... 32 Fig. 2-4: Stroboscopically (11 frames/s) recorded movements of Calcein-AM-labeled blepharisma in an aqueous environment. Images were taken with the 253 water-immersion objective ... 34 Fig. 2-5: Time-lapse sequences of euglena's movement. (a) Imaged with a wide-field fluorescence video microscope. Euglena was paralyzed within 3 s. (b) Imaged with a two-photon viideo-rate microscope. No photodamage was observed. The frame size is 62 mm.
... 35 Fig. 2-6: Schematic illustration of the brick and mortar model of the SC, including VE. The corneocytes (c) and keratinocytes (K) are represented by the brick-like structures in the continous phase of lipid bilayer lamellae (LB) that comprise the intercellular space ... 38 Fig. 2-7: Chemical structures of the two fluorescent model drugs. (a) RBHE is the hydrophobic
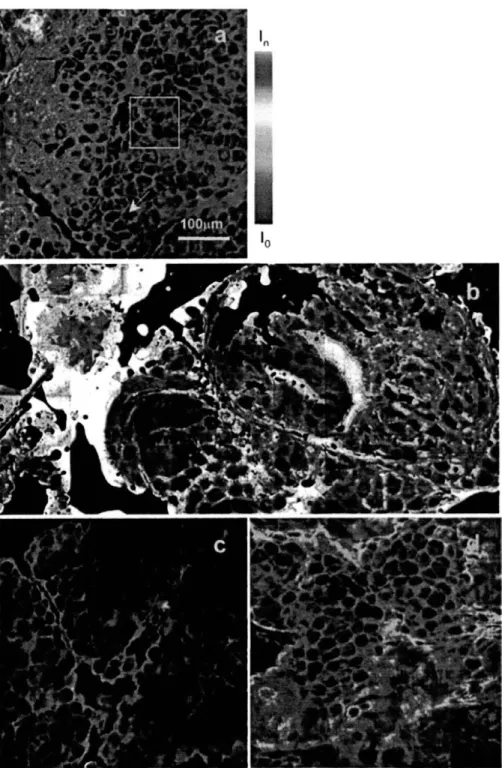
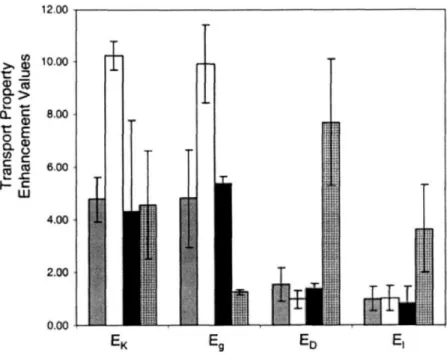
model drug, and (b) SRB is the hydrophilic analog. The two molecules are similar in molecular weight, 627 Da and 559 Da, respectively, but are distinguished by functional groups that impart drastic differences ... 41 Fig. 2-8: Visualization of fluorescent probe spatial distribution in the skin. Selected regions from the 4 mm2 total skin area scanned are shown for (a) RBHE control, (b) RBHE oleic acid, (c) SRB control, and (d) SRB oleic acid cases of the probe distributions close to the skin
surface. The arrow points to a circular dark region typical of stratum corneum corneocytes, whereas the intercorneocyte regions highlights in blue represent the lipid multilamellae. The box demarks the 100 gm x 100 g.m area representing the field of view captured by a 40 x objective for one individual skin site ... 43 Fig. 2-9: Relative changes in oleic-acid-induced transport. Key: 400 skin site RBHE (gray bar), 400 skin site SRB (white bar), RBHE limited sample size (black bar), SRB limited sample size (checked bar). The wide-area values correspond to the transport enhancement values obtained in this study utilizing the data from the 400 skin sites scanned, whereas the limited sample size values reported by a literature which is based on 4-6 sites ... 45 Fig. 2-10: Intensity profile analysis of the hydrophobic model drug (RBHE). For the control case, the image of the RBHE model drug spatial distribution, shown in (a), the image of the corresponding skin autofluorescence signal, shown in (c), and the intensity profile of the cross section marked in the images in (b). For the chemical enhancer case, the image of the model drug, shown in (d), the one of the skin autofluorescence in (f), and the intensity profiles in the marked cross section are shown in (e) ... ... 49 Fig. 2-11: Intensity profile analysis of the hydrophobic model drug (RBHE). For the control case, the image of the RBHE model drug spatial distribution, shown in (a), the image of the corresponding skin autofluorescence signal, shown in (c), and the intensity profile of the cross section marked in the images in (b). For the chemical enhancer case, the image of the model drug, shown in (d), the one of the skin autofluorescence in (f), and the intensity profiles in the marked cross section are shown in (e) ... 51 Fig. 2-12: Mice bearing dorsal skin-fold chamber ... 55 Fig. 2-13: Images of non-tumor-(A, B, C) and tumor-bearing mouse dorsal skin-(D, E, F). (A) Epifluorescence image of non-tumor-bearing dorsal skin shows normal vessel density and tortuosity. (B, C) two-photon images of non-tumor-bearing dorsal skin also show normal vessel density and tortuosity at the depth of 200 jim. The image shown in (B) represents the view looking down into the dorsal chamber from the surface of the chamber. The image in (C) is a 3D representation obtained by rotating the image in (B). The images were obtained using a 20 x objective and an imaging depth up to 300 tm. On the other hand, the images from tumor-bearing mouse dorsal skin shows high vessel density and tortured vascular structure ... 56 Fig. 2-14: Time sequence of images acquired using high-speed two-photon microscope showing L-E interaction in the dorsal skin-fold chamber. (A-E) Vessel in a non-tumor bearing chamber imaged at a depth of 150 m below chamber window. The elapsed times are shown. The arrowhead follow a single leukocyte that had adhered to the vessel wall (A, B), released (C), and rolled along the vessel wall (D, E). (F-H) Vessel in BA-HAN-1C rhabdomyosarcoma growing in a dorsal skinfold chamber imaged at a depth of 200 tm below the chamber window. The elapsed times are shown. The arrowhead follows a single leukocyte traveling with the blood flow, not interacting with the vessel wall. The blood flow has an average velocity of 220.rm/sec. All scale bars represent 40 -m ... 57 Fig. 3-1: Cartoon of photon scattering around two-photon excitation focus (a) excitation photon scattering reduces the amount of excitation photons arriving at the focus. Emission photons are also scattered before they are collected by detection optics and detectors. (b) Decay of unscattered photons with the increment of imaging depth in case of 2 % intralipid. Its mean free path length is 62.5 jim, 167 jim at emission (515 nm), excitation wavelength (800) respectively. It is noted that more scattering occurs to the shorter wavelength light
(emission light) ... 62 Fig. 3-2: Variations in PSF FWHM of MMM. FWHMs in transverse direction (a) and axial direction (b) are measured up to 2 times of mean free path length ( ISm =62.5 gm) at emission wavelength (515 nm). There is no significant change in both transverse and axial directions.
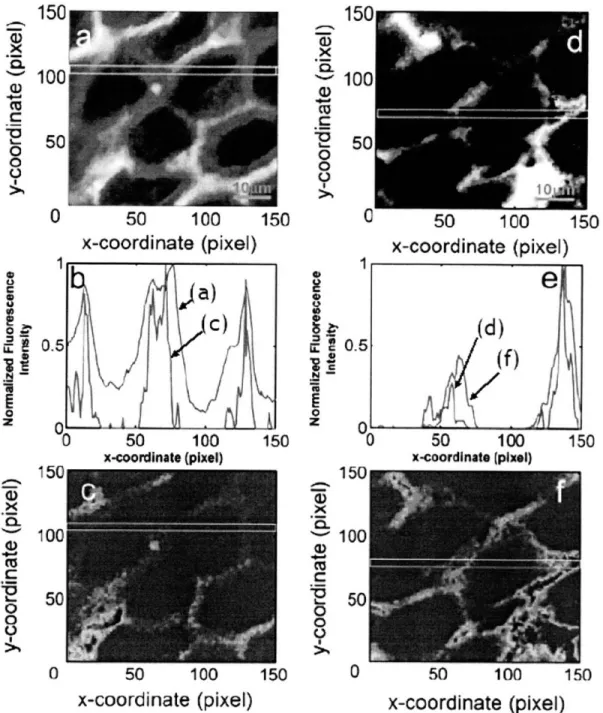
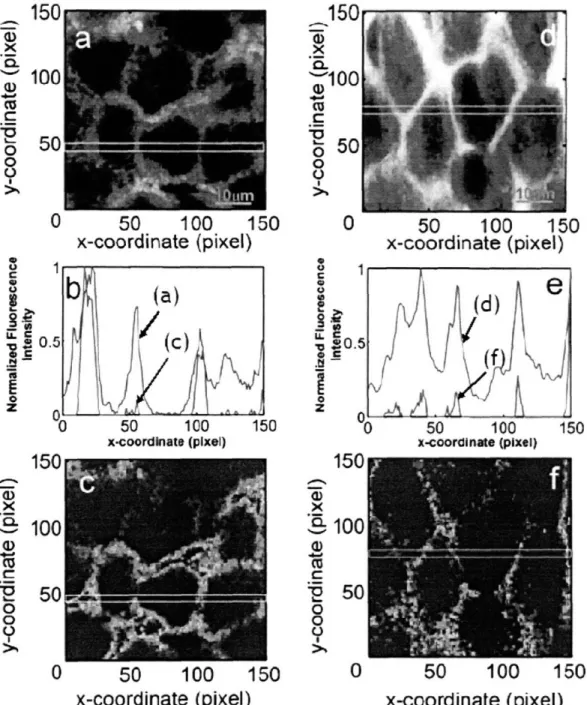
Objective used is 40 x with 1.2 NA. Input power level is approximately 5 - 10 mW at specimens. Acquisition time is 6.6 s per frame ... 64 Fig. 3-3: Intensity decay with the increase of scattering length (a): peak intensity of PSF and PSF intensity integrated over the image plane. Peak intensity decays faster than the integrated intensity due to emission photon scattering. Variations in PSF profiles with the increase of scattering length (b): PSF is measured up to 100 Ctm radius from peak location. Intensity in the tail of PSF (> 25 im) is monitored to increase due to scattering of emission photons... 66 Fig. 3-4: Simulation of the effect of emission photon scattering on image contrast: measured PSF profiles are used in the simulation. The original image is circles of 10 tm diameter arranged with 40 ptm separation distance. (a) is the image on the surface and (b) is the image at 2.4 times scattering length at emission wavelength. Background noise decays less than signal with the increase of scattering length. Background intensity around the center circle increases due to background accumulation from other circles around. Signal to noise ratio (SNR) with the background noise included is lower than the SNR with signal fluctuation only, (c) ... ... ... 69 Fig. 3-5: Comparison of SMM and MMM in turbid brain tissue imaging: images of gfp expressing neurons at 10 pim deep, 80 gim deep, and 160 tim deep from the surface. Images from SM:M keep good contrast up to 160 ptm deep with neurons visible. Neurons are not quite visible at 160 gm deep, because images from MMM lose contrast quickly due to emission photon scattering. Image size is 160 ptm x 160 pm deep ... 70 Fig. 3-6: Schematic of multifocal multiphoton microscope based on MAPMT. Excitation beam (expanded) comes from bottom of this figure and illuminate a square microlens array. The microlens array splits the excitation beam into 8 x 8 multiple beams (beam-lets). In this figure, only two beam-lets are ray-traced. A specimen is scanned with an 8 x 8 array of excitation foci. The sample area that each excitation focus covers becomes small. The emission beam-lets are either collected by CCD or MAPMT. CCD integrates signal during the scanning of a single frame. MAPMT which has only the same number of pixels as excitation beamlets, integrate signal of 8 x 8 pixels synchronized with the scanning ... 73 Fig. 3-7: Human skin image acquired with MAPMT-based MMM. Epidermal layer was imaged. From left to right, imaging depth goes deeper. Stratum corneum layer (a), stratum granular (b), and basal layer (c) are shown. Cells are visible with its autofluorescence. Image size: 360 um x 360 um, input power: 7 mW per focus, objective: 20 x, imaging speed: 2.5 frames/s with 320 x 320 pixels ... 77 Fig. 3-8: Signal decay with the increase of imaging depth was measured with SMM, CCD-based MMM, and MAPMT-based MMM. The specimen was sparsely distributed 4tm red spheres (605 nm) in 2 % intralipid. Signal decay is due to scattering of both excitation and emission photons. Decay due to excitation photon scattering is the same for all the systems. Difference in the decay is because the difference in the collection efficiency of emission photons of the systems. Scatterer: 2% intralipid emulsion, the mean free path length at emission wavelength is 80 um. Objective: 20 x. The signal decay is expressed an exponential function, . The decay coefficient, c is 1.22, 1.87, 2.30 in case of the SMM, MAPMT-based MMM, and CCD-based MMM respectively ... 79 Fig. 3-9: Effect of emission photon scattering on images acquired with MAPMT-based MMM. (a) The image of spheres at 150 ptm deep from the surface. Ghost images appear with the scattered emission photons collected in neighboring pixels of the MAPMT, (b) image after the deconvolution process, (c) Variation of PSF due to emission photon scattering, the increase of intensity in the tail is the effect of emission photon scattering (d) Crosstalk in the pixels of the MAPMT, it is calculated by integrating the PSF over the effective detector area of individual pixels of MAPMT ... ... ... 80
Fig. 3-10: Neuron images acquired with CCD-based MMM (a-c) and MAPMT-based MMM (d-f) at different depth locations (surface, 30 um, and 75 um deep). The images with at For images with MAPMT-based MMM, a deconvolution algorithm was applied to remove the effect of emission photon scattering (g-i). Objective: 20 x water immersion with NA 0.95, input laser power: 300 mW at 890 nm wavelength, frame rate is 0.3 frames per second with 320 x 320 pixels ... 83 Fig. 3-11: Cell counting in the mixture of two subpopulations (ECFP, EYFP expressing cells) in 2D. (a-c) are images of mixture ratio 1/10 specimen from yellow channel (YC), cyan channel (CC), and from ratio analysis each. The cell pointed with an arrow is an EYFP cell which appears only in YC. It appears as a high ratio in the ratio image. (d) is ratio image of cell mixture 1/100. Only two EYFP cells were found. (e) shows that measured ratios agree well with expected ratios ... ... 94 Fig. 3-12: Cell counting in the mixture of two subpopulations in 3D. One group of cells was stained with Hoechst only and the other group was stained with both CellTracker green and Hoechst. Cells were grown in collagen scaffolds to generate 3D cell blocks. (a) is 3D image of 1/1 ratio specimens. Nuclei stained with Hoechst are shown as blue color and the cells stained with CellTracker green also are shown to express green color in their bodies. (b) is cell scatter plot from 1:1 ratio specimens. Two subpopulations are clearly distinguished by the difference in intensity ratio. (c) is the result of cell counting from specimens of different mixture ratios up to 1/105. Measured ratios agree quite well with the expected ratios ... 97 Fig. 3-13: Algorithm for discriminating and counting cell populations, (a) and (b) are raw images, blue channel (BC) and green channel (GC). These images are converted to BW images (c, d) with thresholding on BC images and measuring the intensity ratio in individual pixels. Noise is removed by erosion and dilation operation (e, f). These BW images are convolved with a kernel image (g) to measure locations of nuclei and to count them (h, i). (j) is 3D view of the convolved image (h) ... 99 Fig. 3-14: Large section image of ex-vivo human skin in dermal layer. Images are acquired with the high-speed multiphoton microscopy based on polygonal scanner running at 13 frames per second. Collagen and elastin fibers are shown based on their autofluorescence. The size of images is 2.5 mm x 2.5 mm in (a). (b) and (c) are zoomed image from boxed regions of (a). (b) is the image of hair follicle, a cell cluster at the bottom of hair follicle are shown based on their autofluorescence (NAD(P)H). (c) is an image of sweat gland ... 101 Fig. 4-1: Partial schematic of the proposed deep tissue microscope including an octagonal mirror system for fast scanning and a reflected confocal beam path: S - sample, OBJ - objective, DIC dichroic mirror, EXL excitation tube lens, SL scan lens, XYS xyscanner, M -mirror, OCT - octagonal mirror scanner, BS - beamsplitter, FL - focusing lens, PH - pinhole aperture, LAS laser light source, EML emission tube lens, DSL descan lens, P1 -fluorescence PMT, P2 - confocal PMT. Thin black doted lines denote infrared excitation and reflected light signal. Thick gray solid lines denote fluorescence signal ... 110 Fig. 4-2: Simultaneous two-photon fluorescence and confocal reflected light images of 15 lum latex spheres. (a) and (b) are two-photon and confocal images of the spheres with the sample plane positioned at the center of the spheres. (c) and (d) are two-photon and confocal images of the spheres with the sample plane positioned at the top of the sphere (about 6 tm above the center) ... ... 112 Fig. 4-3: Simultaneous confocal reflected (a) - (c) and two-photon fluorescence (d) - (f) images
of frozen human skin. Stratum corneum layer in (a) and (d), basal cell layer in (b) and (e), and dermal layer in (c) and (f) ... 113
Fig. 4-4: Schematic diagram of the multi-color multi-photon fluorescence microscope. M mirror, I)C : dichroic mirror, BP : band-pass filter, X/2 : half-wave plate, P : polarizer, mA-PMT: multi-anode PMT ... 122 Fig. 4-5: Schematic diagram of the multi-channel photon counter card (mC-PhCC). Photon pulse
signals from the multi-anode PMT are recorded by 18 photon counting channels. Each channel comprises of amplifier/discriminator, one-shot, counter(#), and hold register (REG). Collected data are transferred to the temporary data storage (FIFO) in channel sequence and then transferred to the host computer either via either a parallel link (SUB-D) or high speed serial link (GigaStar). The signals RESET, GATE, ENABLE, PIX_CLK are driven by the host computer and allow the scanner to be synchronized with the data acquisition and readout procedure of the mC-PhCC. A detailed description of the mC-PhCC is given in text. ... 125 Fig. 4-6: Fluorescence images of three different color microspheres. The beads are 1, 2, and 4 ltm in diameter with emission peaks at 535, 490, and 455 nm, respectively. The experimental settings are: excitation wavelength: 780 nm, power at the specimen: 5 mW, spectrum range: 100 nm, spectral resolution: 7 nm, acquisition time: 2.6 s. The color (gray level) bar represents intensity. (a) Images recorded from individual spectral channels (b) An intensity image in which signals from all 16 spectral channels are summed (c) Representative spectra of spheres: each of the three fluorescence spectra is derived from a style></pages><volume><style face='normal' font='d ... 129 Fig. 4-7: Spectrally resolved imaging of ex-vivo human skin (dermal layer). Experimental settings are: excitation wavelength: 880 nm, power at the specimen: 5 mW, spectrum range: 100 nm, spectral resolution: 7 nm, acquisition time: 7 second per frame. (a) Color coded intensity image where blue color represents collagen and green color represents elastin (b) Representative spectra at two different positions. Position A corresponds to a collagen-rich area. Position B corresponds to an elastin rich area ... 130
Chapter
1
Introduction
In past decades, optical techniques have been proved to be very important in biomedical study. In this chapter, recent developments of optical techniques including two-photon microscopy (TPM) are briefly summarized with their biomedical applications. TPM is introduced including its physical principle, instrument design, and current biomedical applications. The focus of this thesis is the extension of TPM for high speed imaging. We will review existing work in high-speed TPM field and provide a motivation for our work. A statement of work summarizing the accomplishments in this thesis will be presented.
1.1. Introduction of optical techniques
Technological advances in the optical imaging and labeling have revolutionized biological studies by enabling the monitoring of cellular events in vivo and in real time. Optical techniques provide subcellular resolution in the range of 200 nm and induce minimal photodamage. There are many optical contrast mechanisms suitable for biomedical imaging such as reflectance, fluorescence, polarization, and absorption. Several microscopic techniques such as confocal microscopy, two-photon fluorescence microscopy (TPM), and total internal reflection microscopy have 3D resolution. Imaging resolution has been improved down to a few tens of nanometers using 4-pi microscopy and stimulated emission depletion (STED) microscopy. Image acquisition speed has been also improved so that cellular events can be studied in video rate (30 frames/s) and beyond. Advances in fluorescent labeling technology make it possible to monitor molecularly and biochemically specific cellular processes. Fluorescent markers based on green fluorescent protein (GFP), which can be incorporated into the genome, enable the creation of transgenic cell lines and animals where genetic changes can be monitored. Quantum dots, which are based on semiconductor crystal in nanometer scale, allow long
term fluorescence imaging without photobleaching. They emit different colors depending only on their sizes while excitable over a broad spectral range.
Among all these advances, two-photon microscopy (TPM) is one of the most important inventions in optical microscopy in the past decade. Two-photon microscopy (TPM), which was first implemented in 1990 (Denk et al. 1990), is a 3D imaging technique with subcellular resolution. It is based on the nonlinear excitation of
fluorophores. It has excellent penetration depth of several hundred micrometers while induces minimal photodamage. TPM has become an indispensable tool in various biomedical studies which requires in-vivo tissue imaging. More details of TPM are
explained below.
1.2. Two-photon microscopy (TPM)
1.2.1. Principle of two-photon excitation
TPM utilizes two-photon excitation (TPE) of fluorophores. Different from conventional, one-photon excited, fluorescence where a fluorophore is excited by absorbing a single excitation photon, two-photon excitation requires the simultaneous absorption of two excitation photons (Fig. 1-1). In two-photon excitation, the energy of the excitation photons is chosen such that the excitation transition of fluorophores requires the combined energy of two excitation photons. Therefore, two-photon excitation wavelength is approximately twice longer than one-photon excitation of a given fluorophore. Two-photon excitation light is typically in near-infrared range. An important feature of TPE is that photo-interaction is localized in 3D at the focus of the excitation light. This localization is due to the quadratic relationship of TPE with excitation photons which requires simultaneous absorption of two excitation photons. The probability of TPE per molecule, P2y is proportional to the square of excitation photon flux, I,(t) . For comparison, the probability of one-photon excitation, Ply is linearly proportional to the flux of its excitation photon.
Ifirst
electron7
excited stateL
Aemissin
photon fluorescence emissil excitation X photonsVNk~
A111
/I
vibrati ona _ A--- ... telaxaticn A-L /i1/
emi sson r photon'vWA
fluorescenceemissin
/ I I vibrational statesFig. 1-1: Electronic energy diagram for two-photon excitation of fluorophores. Left side is for typical fluorescence and right side is for two-photon fluorescence. Fluorophores are excited by absorbing two excitation photons simultaneously where the energy for each excitation photon is half for excitation transition. ::quatiol Chlapter 1 Section 1
FP 0c (t)
(1-1)
The photon flux distribution at the excitation focus is described by diffraction theory of light. Fig. 1-2(a) shows the spatial distribution of the square of excitation photon flux around the focus. Its distribution is symmetrical in the optical axis and is presented as the function of the distances along the optical axis (z) and the transverse axis (r) with their origin placed at the focus. This distribution is normalized with the maximum intensity at the origin. The distribution shows the fast decay of two-photon excitation probability from its origin along both optical and transverse axis. Mathematically, the TPE point spread function (PSF) along both axes is described as
16 excitation photon VVVVN '!p, - / /
electronic
ground state
· -I rI
I
I[ r i , I I I 1' 'L _, J / al q F I I I L\
I_I
\
Spatial distribution of two-photon excitation around focus 0.9 08 0.7 06 05 0.4 0.3 02 01 Axial direction (z) in pm
Axial distribution of two-photon cross-sectional Intensity
0.9
_Jb)_.J;...
... .
-0.8--- ----o6 0AJb
---::::
---
---0. ---S0.3 02 0.1 0 0.3 ...
---
..~...~..---
...~..---
... o0. -15 -1 -05 0 05 1 1.5 Axiallocation, z in lmrnFig. 1-2: (a) Spatial distribution of two-photon excitation, horizontal axis is optical axis (z) and vertical axis is transverse axis (r). The distribution is symmetrical around the optical axis. FWHM in z is 1.0 jim and FWHM in r is 0.3 jtm with 1.0 NA and 800 nm excitation wavelength. (b) The distribution of fluorescence intensity integrated on transverse plane as function of z. Two-photon excitation has 3D optical sectioning because the quadratic relationship suppresses fluorescence generation from the cross sections which are out of focus.
J1(v) 4 21NA P2r(v,u=0)oc[ ]J where v=- r v 1 2NA2 (1-2) sin(u/4) 2,rNA2 P2,(v= 0,u)a[ ]4 where u= z u/4 Aw
In the equations, v and u are generalized coordinates along r and z directions respectively, NA is the numerical aperture of a focusing lens (objective), X is the wavelength of excitation light, and J,(v) is Bessel function of the first kind of order 1. These are fourth order equations due to the quadratic dependence of the excitation probability to the excitation flux. The spatial distribution of TPE around the focus of excitation light is presented in Fig. 1-2 (a). With the wavelength of excitation light being
800 nm and NA of the focusing lens being 1.0, its full width at half maximum intensity
(FWHM) are 0.3 jtm, 1.0 jim in transverse, axial direction respectively. Further, TPE itself has depth discrimination [don't start sentence with also]. Fig. 1-2 (b) shows the cross sectional intensity distribution of TPE as a function of axial location (z). TPE from the out of focus cross sections is suppressed because of the quadratic relationship of TPE with the excitation photon flux. On the other hand, one-photon excitation (typical fluorescence microscopy) does not have depth discrimination, because fluorescence generated on each cross section is constant along the optical axis. Therefore, the signal
-0 -C C 0 4) nC C 1-0
generated from the focal plane is often obscured by the background signal generated in the out-of-focus cross sections.
Galvanometer-driven mirror
scanner
Dichrt
mirror
Piezoelectri
translator
rI [Ti-Sa
laser
Specimen
Fig. 1-3: Configuration of two-photon microscopy. Excitation light from Ti-Sa laser is focused in a specimen by an objective lens. An x-y scan mirror scans the focus of excitation light in the specimen. The fluorescent photons generated from the scanned points in the specimen are collected by photomultiplier tube (PMT) imaging; a pulsed femtosecond laser is used as excitation light source. A detailed description is followed.
1.2.2. TPM Design
The schematic of TPM is presented in Fig. 1-3. TPM generates 3D resolved images based on the localized two-photon excitation volume. An image is formed by raster scanning the focus of the excitation light using an x-y mirror scanner. The emission photons generated are collected by a detector, such as a photomultiplier tube (PMT). Two-photon excited fluorescence is an inefficient except in extremely high photon flux. In order to generate sufficient signal level for
The light source for TPM is from a Ti:sapphire laser (Mira 900, Coherent, Santa Clara, CA) pumped by continuous wave (CW) Nd:YVO4laser (Verdi, Coherent, Santa
4
ective
I
_ .~
Clara, CA). The laser pulse duration is 150 fs and the pulse repetition rate is about 80 MHz. The beam expanded laser light is directed into the microscope via a galvanometer-driven x-y scanner (Cambridge Technology, Cambridge, MA). Images are generated by raster scanning the x-y mirrors. The excitation light enters a microscope via a modified epi-luminesence light path. The scan lens is positioned such that the x-y scanner is at its eye-point while the field aperture plane is at its focal point. Since the objectives are infinity-corrected, a tube lens is positioned to re-collimate the excitation light. The scan lens and the tube lens function together as a beam expander which over-fills the back aperture of an objective lens. Proper over-filling of the back aperture is required for the objective to achieve the manufacturer specified numerical aperture. The excitation light is reflected by the dichroic mirror to the objective. The high numerical aperture is essential for the formation of a diffraction limited spot on the order of 0.1 femtoliter. The objective axial position is moved by a piezo-objective translator. The fluorescence emission is collected by the same objective and transmitted through the dichroic mirror along the emission path. An additional barrier filter is needed to further attenuate the scattered excitation light because of the high excitation intensity used. A de-scan lens is inserted between the tube lens and the photomultiplier tube (PMT). The de-scan lens re-collimates the excitation. It also ensures that the emission light strikes the PMT at the same position independent of scanner motion.
The microscope field of view is about 100 pm x 100 pm with a 40 x objective and it changes depending on the objective magnification. The typical frame rate is approximately 0.3 - 1 frames/s for 256 x 256 pixel images.
1.2.3. Major advantages of TPM for biomedical imaging
Localization of TPE in 3D at the focus of excitation light provides inherent 3D resolution in TPM. More importantly, the typical TPE excitation volume is below 1 fl in size minimizing phototoxicity to specimens compared to one-photon excitation in which fluorescence is generated along the path of excitation light. Photodamage is also decreased by use of near-IR excitation rather than UV and visible radiation. Reduction of the photochemical-interaction volume results in a dramatic increase in
biological-specimen viability. The noninvasive nature of two-photon imaging can be best appreciated in a number of embryology studies. Previous work on long-term monitoring of Caenorhabditis elegans and hamster embryos, using confocal microscopy, has failed because of photodamage-induced developmental arrest. However, recent TPM studies indicate that the embryos of these organisms can be imaged repeatedly over the course of hours without observable damage (Mohler et al. 1998; Mohler et al. 1998; Squirrell et al. 1999). It is more important that the hamster embryo was reimplanted after the imaging experiments and eventually developed into a normal, healthy, adult animal. At the focal volume where photochemical interactions occur, TPM can still cause considerable photodamage. Three major mechanisms of two-photon photodamage have been recognized. (a) Oxidative photodamage can be caused by two- or higher photon excitation of endogenous and exogenous fluorophores with a photodamage pathway similar to that of UV irradiation. These fluorophores act as photosensitizers in photooxidative processes (Keyse et al. 1990; Tyrrell et al. 1990). Photoactivation of these fluorophores results in the formation of reactive oxygen species that trigger the subsequent biochemical damage cascade in cells. Current studies have found that the degree of photodamage follows a quadratic dependence on excitation power, indicating that the two-photon process is the primary damage mechanism (Konig et al. 1996; Sako et al. 1997; Hockberger et al. 1999; Koester et al. 1999; Konig et al. 1999). Experiments have also been performed to measure the effect of laser pulse width on cell viability. Results indicate that the degree of photodamage is proportional to two-photon excited fluorescence generation, and is independent of pulse width. Hence, using shorter wavelength for more efficient TPE also produces greater photodamage. An important consequence is that both femtosecond and picosecond light sources are equally effective for two-photon imaging in the absence of an IR one-photon absorber (Koester et al. 1999; Konig et al. 1999). Flavin-containing oxidases have been identified as one of the primary endogenous targets for photodamage (Hockberger et al. 1999). (b) One- and two-photon absorption of the high-power IR radiation can also produce thermal damage. The thermal effect resulting from two-photon water absorption has been estimated to be on the order of 1 mK for typical excitation power and has been shown to be insignificant (Schonle et al. 1998). However, in the presence of a strong IR absorber such as melanin (Jacques et
al. 1987; Pustavalov 1995), there can be appreciable heating caused by one-photon absorption. Thermal damages have been observed in the basal layer of human skin in the presence of high average-excitation power (Buehler et al. 1999). As a method to avoid thermal mechanical damage in skin imaging, the usage of a laser pulse picker was suggested (Masters et al. 2004). (c) Photodamage may also be caused by mechanisms resulting from the high peak power of the femtosecond laser pulses. There are indications that dielectric breakdown occasionally occurs (Konig et al. 1996). However, further studies are required to confirm and better understand these effects.
Another important feature of TPM is its excellent penetration depth of up to a few hundred micrometers in turbid specimens. This is significantly improved over fluorescence confocal scanning microscopy (Centonze et al. 1998). The limitation of imaging depth is due to photon interaction with tissue constituents. In TPM, photon scattering is a major factor and photon absorption is negligible because tissue constituents have low absorption coefficient in the range of visible and near-infrared wavelength in which both excitation and emission lights are. Photon scattering is inversely proportional to the wavelength of light for both Rayleigh and Mie scattering. Since scattering effect has inverse power law dependence on wavelength, the excitation light of TPM which is in near-infrared wavelength can reach to the focus with significantly less scattering than confocal that uses UV or blue/green excitation.
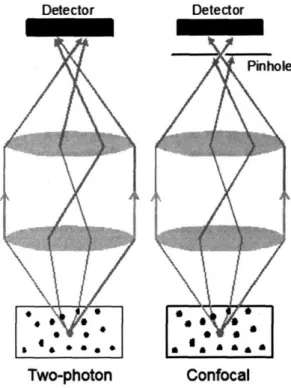
For signal collection, emission photons are also scattered before collected by detection optics. The effect of scattering on signal collection is illustrated in Fig. 1-4. When scattering, the propagation direction of the emission photons are changed and may not be collected by the detection optics. In case of confocal microscopy, the emission pinhole rejects most of scattered emission photons and only ballistic unscattered photons are collected as signal. TPM does not need of pinhole for 3D resolution and hence has better collection efficiency than confocal for deep tissue imaging. The implication of emission photon scattering and its relationship with HSTPM will be further discussed in Chapter 3. The ability of TPM to image tissues up to a few hundred micrometers in-vivo opened up many biomedical applications. In the next section, current studies using TPM is summarized.
Detector Detector
Two-photon Confocal
Fig. 1-4: Scattering of emission photons. In confocal microscopy, a pinhole in front of detector rejects scattered emission photons and collects only ballistic photons as signal. Two-photon microscopy does not need a pinhole because emission photons are generated only at the focus of excitation light. Therefore, a detector with a large detection area can collect all the photons, which arrive at the detector, as signal.
1.2.4. Applications of TPM
TPM provides information of 3D cellular and tissue structure based on biochemical states (endogenous and exogenous fluorophores). The advantages of TPM, excellent imaging depth and minimal phototoxicity, have provided many new opportunity for the study of tissue physiology in embryos, the brain, the eye, the pancreas, and the skin. In neuron biology study, synaptic function (especially Ca2+) (Denk 1994; Denk et al. 1994; Svoboda et al. 1997; Helmchen et al. 1999; Mainen et al. 1999; Maletic-Savatic et al. 1999; Shi et al. 1999; Svoboda et al. 1999; Yuste et al. 1999) and neuronal plasticity (Engert et al. 1999; Grutzendler et al. 2002; Trachtenberg et al. 2002), blood flow (Kleinfeld et al. 1998) have been studied. In embryology, two-photon imaging allows the study of developing embryos without damage (Jones et al. 1998; Mohler et al. 1998; Mohler et al. 1998). In eyes, oxidative metabolism and cellular dynamics were measured based on autofluorescence (Piston et al. 1995). In the study on pancreas, metabolic
processes of pancreatic islets were studied (Bennett et al. 1996; Piston et al. 1999). In skin study, TPM imaged the structure of skin in 3D based on the endogenous fluorophores such NAD(P)H in cells, collagen and elastin fibers in dermal layer of the skin (Masters et al. 1997; So et al. 1998).
In addition to the physiological study of tissue, TPFM can be used as a complementary technique to guide the medical procedure in biopsy. The images provide the biochemical composition and distribution of the specimen in cellular and tissue scale. This information can distinguish the cells to be removed from the normal one that it can help to determine the surgical margin of the biopsy. It can also be used for photodynamic therapy where a light-absorbing compound is administered and preferentially retained by targeted cells and tissues. These tissues can be killed by the exposure of intense light. The localized nature of TPE allows photodynamic action to be triggered within a femtoliter volume allowing selective destruction of specific cells without harming surrounding tissues.
1.3. High speed TPM
A practical limitation of TPM is its imaging speed which typically lies in range of 0.1 - 2 frames per second. While this speed is sufficient in many cases, two classes of problem demand higher imaging rate. First, high speed multiphoton microscopy can be applied to study kinetic processes in 3D biological environment such as the cytosol of a single cell or within a microscopic volume of tissues. Second, high speed 3D microscope allows sampling a statistically significant volume of biological specimen. Since the field of view of most microscopes is limited to about 100 tm on a side with imaging depth of 100 tm, the investigation volume is limited to only 1 x 10- 3 mm3. While this volume is sufficient for cellular imaging, many tissues have physiologically relevant structures ranging from the cellular level up to millimeters. High-speed TPM will allow physiological study in cytological scale in vivo inside tissue. It can be also used in the study of rare cellular events in tissue combined with genetic engineering. Additionally, high-speed imaging can avoid physiological motion in diagnostic applications.
While high speed multiphoton microscopy is a powerful tool for a variety of biomedical investigation, there are significant instrumentation challenges in its implementation. Three methods have been taken to bring two-photon imaging speed to the video rate (-approximately 30 frames per second). The first method is based on line scanning (Brakenhoff et al. 1996). A line-scanning approach reduces image acquisition time by covering the image plane with a line instead of a point. The line focus is typically achieved with a cylindrical element in the excitation beam path. The resulting fluorescent line image is acquired with a spatially resolved detector such as a CCD camera. The main drawback associated with line scanning is the inevitable degradation of the image point-spread function, especially in the axial direction. The second method is based on increasing the speed of typical scanner. Two forms of HSTPM have been developed based on high speed polygonal scanner (see Chapter 2) and resonance scanner (Fan et al. 1999). The third method increases the imaging speed by parallelizing the multiphoton imaging process (Bewersdorf et al. 1998; Buist et al. 1998). It scans a specimen with a multiple of excitation foci instead of forming only a single focus. These foci are raster scanned across the specimen in parallel where each focus needs to cover a smaller area. The emission photons from these foci are collected simultaneously with a spatially resolved detector. One advantage of this method is that the imaging speed is increased by the number of excitation foci generated, without increasing the power of excitation light per each focus. In general, higher imaging speed can be achieved by using higher input power. However, there is limitation in input laser power, because fluorescence generation is saturated due to the finite lifetimes of fluorophores. The saturation level of input laser is dependent on the excitation photon flux and fluorophores. It is approximately less than 10 mW with typical fluorophores and the objectives. Scanning with multiple excitation foci has an advantage that imaging speed is increased by parallelizing, while the input power per focus is kept below the saturation limit.
Although MMM has a high imaging speed, it is questionable whether it can achieve similar tissue imaging depth as in conventional TPM. As it was mentioned before, the imaging depth in TPM is mainly limited due to photon scattering. Conventional TPM has a high imaging depth because it has a good collection efficiency of emission photons. In conventional TPM, a single-channel detector collects emission
photon while the specimen is scanned with a single excitation focus and the signal is collected by a large non-spatial resolved detector. An image is formed by the temporal encoding of' the integrated signal with the known raster scanning pattern. Pixel information of the image is determined by time-encoded scanning pattern. Therefore, TPM is not sensitive to spatial dispersion of emission photon due to scattering. On the other hand, in MMM, a CCD camera generates an image by integrating emission photons from a specimen during the scanning time of a single frame. The pixel information is determined by the spatial distribution of emission photons on the CCD camera. Therefore, MMM is sensitive to emission photon scattering and MMM may not be appropriated for deep tissue imaging which is one of important features of TPM. The extension of MMM technology for deep tissue imaging is the focus of the work presented in Chapter 3.
1.4. Statement of work
This dissertation presents the development of high-speed two-photon microscopes and biomedical applications. Two high-speed systems were developed specifically for turbid tissue imaging. The first system is a high-speed scanning system based on a polygonal mirror scanner. Since this system is single-focus scanning as conventional TPM, it is advantageous in terms of emission photon collection. Since MMM has the advantageous in imaging speed but may not be suitable for tissue imaging due to its sensitivity to, scattered emission photons, we thoroughly investigated the effect of emission photon scattering in TPM. Based on the measurement result, we designed a new form of MMM system that is more optimized for tissue imaging. The new MMM design uses a multi-anode photomultiplier tube (MAPMT) instead of a CCD camera as detector.
These high-speed TPMs were used in various biomedical applications. In the study of transdermal drug transport, HSTPM was used to measure the change of microscale diffusion properties of skin with the application of chemical enhancer (oleic acid). This study showed that microscopic study is possible for tissues like skin which have heterogeneous properties spatially with HSTPM. Equally importantly, HSTPM was
used to elucidate transdermal diffusion pathway with respect to skin structure. HSTPM was also applied in the in vivo study of tumor physiology in a mouse model. Microvasculature inside tumor tissues was imaged in-vivo and its difference from that in normal tissues was characterized. The response of immune system to tumors was monitored by imaging the blood flow of vessels in tumor tissues and by measuring the interaction of leukocyte-endothelium interaction. HSTPM was further used to develop high-throughput cytometric instrument. The advantage of this 3D tissue cytometer is that it can screen cells in-vivo inside tissue so that it can study cell-cell and cell-extracellular matrix interactions. Further, this method also avoids the morphological distortion during sectioning procedure in typical histology, because it can image tissue in situ without mechanical sectioning.
Realizing that spectroscopic information are critical to be combined with TPM imaging to understand biomedical processes, confocal reflected imaging was combined to TPM to provide complementary morphological information of tissues. TPM provides information of biochemical states in tissue because it is based on fluorescence (endogenous and exogenous). Confocal reflected imaging provide additional structural information such as the shapes of cells, nuclei etc as complementary. Finally, a two-photon spectral imaging system that can resolve 16 color emission in parallel in conjunction with their spatial distribution. This instrument will help in resolving and identifying tissue biochemical components with respect to their distribution.
Chapter 2
The development and applications of a
high-speed two-photon microscopy (HSTPM) based on
polygonal mirror scanner
The development of a HSTPM for tissue imaging is presented with its design and characterization (Section 2.1). This new system has found applications in many biomedical applications including a study on transdermal drug delivery using oleic acid as an enhancer (Section 2.2, 2.3) and a study on tumor physiology are presented in the next (Section 2.4).
2.1. HSTPM based on polygonal mirror scanner
2.1.1. Introduction
The increase of TPM imaging speed can open many biomedical study opportunities. High-speed imaging can be used to monitor kinetics events of tissue physiology with subcellular resolution in vivo. Further, using HSTPM allows tissue properties to be measured in specimen up to a size of 1 mm3 instead of 10-3 mm3 covered by a traditional TPM.
We developed a HSTPM optimized for deep tissue imaging. The imaging speed is enhanced by increasing the scanning speed using a polygonal mirror scanner that is significantly faster than conventional galvanometer-driven scanner with about 500 Hz bandwidth. The specimen is raster scanned with a single excitation focus and emission photons are collected using non-spatially resolved detectors, such as photomultiplier tubes, similar to conventional TPM. This method is advantageous for tissue imaging as in
conventional TPM featuring efficient signal collection. We will describe the system design, improvement, and characterization experiments. We further demonstrate the performance of this system in mapping three-dimensional (3-D) cellular mitochondria distribution and the motion of protozoa.
Inside microscope I Laser diode Photo diode vanorneter-driven iner xis scanner) (gonal mirror iner xis scanner)
Fig. 2-1: Schematic of HSTPM based on polygonal mirror. Polygonal mirror spins at a constant speed. Turning of each facet of the polygonal mirror generate a line scan along the fast axis. A pair of relay lens deflects the excitation beam to a galvanometer-driven mirror scanner. This mirror scanner moves the excitation beam along the slow axis.
2.2. Instrument design
The schematic of this video-rate two-photon microscopy design is presented in Fig. 2-1. A femtosecond Ti:Sapphire laser (Mira 900; Coherent, Palo Alto, California) is used to induce two-photon fluorescence. The microscope system is optimized for the excitation
Dichr mirro
Compt specirr
wavelength in the range of between 700 to 900 nm. The laser beam is rapidly raster scanned across a sample plane by means of two different scanners. A fast rotating polygonal mirror (Lincoln Laser, Phoenix, Arizona) accomplishes high-speed line scanning (x axis), and a slower galvanometer-driven scanner with 500-Hz bandwidth (Cambridge Technology, Cambridge, Massachusetts) correspondingly deflects the line-scanning beam along the sample's y axis. The spinning disc of the polygonal mirror is composed of 50 aluminum-coated facets (5 mm x 5 mm) arranged contiguously around the perimeter of the disc. The facets repetitively deflect the laser beam over a specific angular range and correspondingly scan a line 50 times per revolution. Rotation speed of 10,000, 15,000, 20,000 or 30,000 rpm can be selected. In the fastest mode, the corresponding scanning speed of 40 jps/line allows the acquisition of approximately one hundred 256 x 256 pixel images per second.
Two lenses between the scanners function together as a relay element that projects the excitation beam deflected by the polygonal mirror onto a stationary point at the center of the y-axis scan mirror. The microscope is placed such that its telecentric plane intersects with the stationary point at the y-axis scan mirror. The laser beam is coupled into an upright microscope (Axioscope, Zeiss, Thomwood, New York) by means of a modified epiluminescence light path. The beam is reflected by the dichroic mirror toward the objective and is focused on the specimen. To perform 3-D volume scans, we mounted the objective on a computer-controlled piezoelectric objective translator with an approximate bandwidth of 300 Hz (P-721.00, Physik Instrumente, Waldbronn, Germany). The maximum z-axis travel range is 90 tm. The maximum push/pull capacity is 100/20 N. Its resolution is on the nanometer scale with feedback control. Translation of the objective axially yields z stacks of xy-plane images. The induced fluorescence signal is collected by the same objective and passes through the dichroic mirror. Residual scattered light is removed by an additional barrier filter (SP700, Chroma Technology, Brattleboro, VT). The fluorescence is recorded either by an intensified, frame-transfer CCD camera (Pentamax; Princeton Instrument, Trenton, New Jersey) or a high-sensitivity PMT (R3896, Hamamatsu, Bridgewater, NJ).
In case of the CCD camera, the CCD camera integrates emission photons from specimens during the scanning time of a single frame. Then, 12-bit data of the 512 x 512 pixel CCD chip are read out at 5 MHz. The maximum achievable image transfer rate is approximately 11 frames/s for 256 x 256 pixel images (2 x 2 pixel binning). This CCD frame rate is the major obstacle in increasing frame speed of this system and can be improved by use of a faster imager. Consequently, the polygonal mirror's spinning speed is adjusted to 10,000 rpm, and the CCD exposure time is correspondingly set to 90 ms.
In case of the PMT, The current signal from the PMT is converted to a voltage signal using a transimpedance circuit with an impedance of 900 Ohms and is further conditioned by a low pass filter (BLP-2.5, Minicircuits, Brooklyn, NY). The voltage signal is measured using a 12-bit AD converter (AD9220EB, Analog Device, Norwood, MA) which has 10 Mbps speed. The signal is transferred to the computer memory through the PCI bus. Images are generated by integrating signal synchronized with the raster-scanning pattern. Rotation speed of the polygonal mirror is set at 4,000 rpm for typical tissue imaging so that the rate of line scan is 3.3 KHz. The imaging speed is approximately 13 frames per second with 256 x 256 pixel images. We select the frame rate based on the available signal strength from most tissue specimens. The field of view is approximately 200 ptm x 200 ptm with a 25 x objective.
An independent laser diode (1 mW at 632 nm, Thorlabs, Newton, New Jersey) along with a photodiode detector (Thorlabs) is used to encode the polygonal mirror position and to generate a reference signal. This signal is used by a custom-built circuit board to synchronize the xy scanners, the objective translator, and the CCD camera or PMT detection circuitry. The electronic circuit is based on reconfigurable logic (XS4010E, Xilinx, San Jose, California) that drastically enhances experimental flexibility.
For the given 76-MHz pulse repetition rate of the Ti:Sapphire laser, only approximately 50 pulses hit the sample during a typical pixel dwell time of 0.67 pts. It is critical to optimize the light budget for both the excitation and the emission paths. Use of circular instead of linear polarized laser light, allows the average excitation power to be
increased by approximately 40% without excitation saturation of the sample, which is essential for maintaining the diffraction-limited excitation point-spread function. The linear-polarized light of the Ti:Sapphire laser is circularly polarized by a quarter-wave plate (CVI Laser Inc., Putnam, Connecticut). Next, both the deflection angle and the diameter of the scanning beam are balanced carefully to maximize the field of view and power throughput while still overfilling the objective's back aperture for diffraction-limited focusing. A number of objectives [Fluar 100 x, numerical aperture (NA) 1.3, oil; Fluar 40 x, NA 1.3, oil; Plan- Neofluar 25x, NA 0.8, water; Zeiss] were used in our experiments, and the corresponding line-scanning dimensions on the specimens are 45, 113, and 182 [tm. Furthermore, these high-throughput objectives, along with a high-quantum-yield photodetector, allow us to acquire approximately 5% of the total emitted fluorescence. Assuming a typical two-photon excitation volume of 0.1 fl and the fluorophore concentration of 10 jtM, approximately 164 photons per pixel can be acquired with the imaging speed of 13 frames/s. Typically, to avoid excitation saturation of chromophores, the average laser power incident upon the specimen must be less than about 10 mW for the excitation wavelength in the range of 730 to 780 nm.
m
OS
(a)
(b)
(C)
(d)
Fig. 2-2: (a)-(c) Time series of a 100-p.m piezo-induced linear movement of 2 jtm, yellow-green spheres. Three typical images of a movie of 100 frames are depicted. (d) Accumulative image over the same time course as in (a).
2.2.1. Experiments
To demonstrate real-time imaging with high spatial resolution, we stroboscopically recorded the piezo-driven linear displacement of a microscope slide that contained 2-mm-diameter, yellow-green latex spheres (Molecular Probes, Eugene, Oregon) immobilized in Fluoromount G (Southern Biotechnology, Birmingham, Alabama). The slide was attached to a computer-controlled piezostage that was mounted such that the spheres were shifted diagonally across the microscope's xy-image plane at a rate of 10 pm/s. An image series containing 100 frames was acquired at 780 nm. Three selected frames spanning equal amounts of time are depicted in Fig.s. 2-2 (a)c). If these motions were imaged at a slower rate, only the trajectories of these spheres could be seen, but the individual spheres would not be resolved. Fig. 2-2 (d) illustrates this point with a single image acquired by exposure of the sample to the CCD continuously for 9 s.
Fig. 2-3: Two-photon, 3-D resolved images of mitochondria distribution in mouse fibroblast cells as revealed with dihydrorhodamine labeling. Left panel shows a typical two-dimensional slice. Right panel shows the 3-D reconstruction.