HAL Id: hal-03037425
https://hal.archives-ouvertes.fr/hal-03037425
Submitted on 11 Mar 2021HAL is a multi-disciplinary open access archive for the deposit and dissemination of sci-entific research documents, whether they are pub-lished or not. The documents may come from teaching and research institutions in France or abroad, or from public or private research centers.
L’archive ouverte pluridisciplinaire HAL, est destinée au dépôt et à la diffusion de documents scientifiques de niveau recherche, publiés ou non, émanant des établissements d’enseignement et de recherche français ou étrangers, des laboratoires publics ou privés.
New expectations for diastolic function assessment in
transthoracic echocardiography based on a
semi-automated computing of strain-volume loops
Arnaud Hubert, Virginie Le Rolle, Elena Galli, Auriane Bidaud, Alfredo
Hernandez, Erwan Donal
To cite this version:
Arnaud Hubert, Virginie Le Rolle, Elena Galli, Auriane Bidaud, Alfredo Hernandez, et al.. New expectations for diastolic function assessment in transthoracic echocardiography based on a semi-automated computing of strain-volume loops. European Heart Journal - Cardiovascular Imaging, Oxford UP, 2020, 21 (12), pp.1366-1371. �10.1093/ehjci/jeaa123�. �hal-03037425�
New expectations for diastolic function assessment in TTE based on a semi-automated computing of strain-volume loops
Arnaud Hubert1*, MD; Virginie Le Rolle1*, PhD; Elena Galli1, MD, PhD; Auriane
Bidaud1, MD, Alfredo Hernandez1*, PhD; Erwan Donal1*, MD,PhD
* both contributed equally for the manuscript
1. Univ Rennes, CHU Rennes, Inserm, LTSI – UMR 1099, F-35000 Rennes, France
Conflict of interest:
There are no commercial products involved in this study.
There is no conflict of interest and this work was supported by the French National
Research Agency (ANR) (ANR-16-CE19-0008-01) (project MAESTRo).
Correspondence
Erwan Donal, MD, PhD,
Service de Cardiologie - Hôpital Pontchaillou – CHU Rennes-
F-35033 RENNES
erwan.donal@chu-rennes.fr
Abstract (186 words)
Aims: Early diagnosis of heart failure with preserved ejection fraction (HFpEF) by
determination of diastolic dysfunction is challenging. Strain-volume loop (SVL) is a new
tool to analyze left ventricular function. We propose a new semi-automated method to
calculate SVL area and explore the added value of this index for diastolic function
assessment.
Method and results: 50 patients (25 amyloidosis, 25 HFpEF) were included in the
study and compared with 25 healthy control subjects. Left ventricular ejection fraction
was preserved and similar between groups. Classical indices of diastolic function were
pathological in HFpEF and amyloidosis groups with greater left atrial volume index,
greater mitral average E/e’ ratio, faster tricuspid regurgitation (p<0.0001 compared
with controls). SVL analysis demonstrated a significant difference of the global area
between groups, with the smaller area in amyloidosis group, the greater in controls
and a mid-range value in HFpEF group (37 vs 120 vs 72 ml.%, respectively, p<0.0001).
Applying a Linear Discriminant Analysis (LDA) classifier, results show a mean area
under the curve (AUC) of 0.91 for the comparison between HFpEF and amyloidosis
groups.
Conclusion: Strain-volume loops area is efficient to identify patients with a diastolic
dysfunction. This new semi-automated tool is very promising for future development of
Introduction
Heart failure is a major public health problem around the world, with an increased
prevalence (1). Thus, a precise and early characterization of heart failure is central in
the prevention of recurrent hospitalization for decompensated heart failure. 22 to 73%
of heart failure patient had a preserved ejection fraction, named HFpEF pattern(2). The
early diagnosis of these patients is challenging, particularly in echocardiography with
the determination of a diastolic dysfunction. Despite recent updates of
recommendations(3), current diagnostic algorithms remain imperfect(4). Speckle
tracking imaging provides additional information on myocardial function compared to
ejection fraction(5). Its value for better describing systolic function has been especially
demonstrated in the context of HFpEF (6,7). Most of published works, concerning
strain data, explored the systolic part of the cardiac cycle, but recent evidences are
suggesting the potential relevance when studied in the diastolic phase(8). Recently, a
new tool, based on strain-volume relationship during the entire cardiac cycle, named
strain-volume loop (SVL), demonstrated a promising potential in distinguishing
cardiopathies related to the aortic valve diseases(9). Difference between SVL of aortic
stenosis and aortic regurgitation mainly concerned the diastolic phase. Therefore, we
hypothesized that SVL analysis could be a valuable tool for identifying, by a
trans-thoracic echocardiography, patients according to their degree of diastolic dysfunction.
This paper aims to propose a global methodology for the evaluation left ventricular
volume and SVL area in order to compare groups of patients with known status: control
subjects, moderate diastolic dysfunction grade I or II, and severe diastolic dysfunction
(grade III)(3,10). We analyze and compare classical recommended diastolic function
Method
Population
To decrease the bias of confusion with systolic dysfunction, three different patterns of
diastolic function were compared, in subjects with preserved systolic function: cardiac
transthyretine (TTR) amyloidosis (grade III), treated heart failure with preserved
ejection fraction(3,10) (grade I or II) and normal subjects (control group). Were
included in amyloidosis group patients with confirmed TTR-amyloidosis by bone
scintigraphy and genetic testing (11) and a preserved ejection fraction, defined by an
ejection fraction ≧ 50%. Heart failure with preserved ejection fraction was diagnosed as actually recommended(2).
Echocardiography
All patient underwent a standard transthoracic echocardiography using a Vivid E9
ultrasound system (GE Healthcare, Horten, Norway). Images were recorded on a
remote station and analyzed using dedicated software (EchoPAC PC version BT 13,
GE-Heathcare, Horten, Norway). Left ventricular, right ventricular and atrial
measurements were realized according to current recommendations (5).
2D grayscale images were acquired in the standard apical four-, three- end
two-chamber views at frame rate ≥60 frame/s. The recordings were processed using an
acoustic-tracking dedicated software (EchoPAC PC version BT13, GE-healthcare,
Horten, Norway), which allowed for an off-line semi-automated analysis of
speckle-based strain. To calculate the LV global longitudinal strain (GLS), a line was traced
along the LV endocardium’s inner border in each of the three apical views on an
endocardial and epicardial borders with GLS then automatically calculated from the
strain in the three apical views(12). All strain data (mean values, curves) were exported
in csv or txt file format.
Volume estimation
Export files containing the LV knot positions obtained from the semi-automatic
segmentation of the endocardial wall, were extracted from apical 4 and 2
chamber-views (Figure 1). For a given instant, the coordinates of each point were spatially
resampled according to a pre-defined height (h) along the long axis of the LV, in order
to define 4 points contained in the same plane, perpendicular to the long axis. A spline
interpolation was applied to connect these 4 points and, by calculating the area of the
spline's polygons, an estimation of the surface of each plane was obtained. Finally, the
total volume for a given instant of the cardiac cycle was assessed by summing each
sub-volume defined by the surface of each plane, multiplied by the pre-defined height
h. The procedure was repeated for all sampled times along the cardiac cycle.
Strain-volume loops
In order to ease all processing steps, LV-volumes were re-sampled at 1000 Hertz. The
beginning and the end of the cardiac cycle were defined by identifying the instant of
maximum common values of LV volume within two separate windows (w1 and w2) as
depicted in Figure 1. Systole is defined between the previously determined beginning
of the cardiac cycle and the point of minimal volume. An average strain curve was
calculated from all LV strain curves, obtained in apical 4-, 2- and 3-chambers windows.
This average strain is finally resampled as a function of pre-defined percentage
and diastolic strain values that correspond to the same LV-volume, in order to facilitate
the calculation of strain-volume loop area. The area (SVL area) was calculated using
the rectangle method, considering small increments of ventricular volume in order to
insure a precise determination.
Statistical analysis
Continuous variables are expressed by median and interquartile range.
Non-continuous variables are expressed as numbers and percentages. Comparisons
between the continuous variables were performed using the two-tailed t-test.
Comparisons between the categorical variables were performed using the Chi-squared
test. Correlation between variables were tested using linear regression approach.
p<0.05 indicated statistical significance. Receiver operating characteristics curve
(ROC) was created using classical indices of diastolic function (LAVi, E/A ratio, Mitral
E/e’ average, Vmax TR), LVEF/GLS ratio and SLV area, and the area under the curve
(AUC) was calculated. A linear discriminant analysis (LDA), which consists in finding
a linear combination of features that characterizes or separates two or more classes,
was applied on these indices in order the improve the classification between between
HFpEF and amyloidosis groups. Statistical analyses were performed using SPSS
Version 20.0 (Chicago, IL, USA) and R-studio software package (version 1.2.1335).
Results
50 patients (25 amyloidosis, 25 HFpEF) were included in the study and compared with
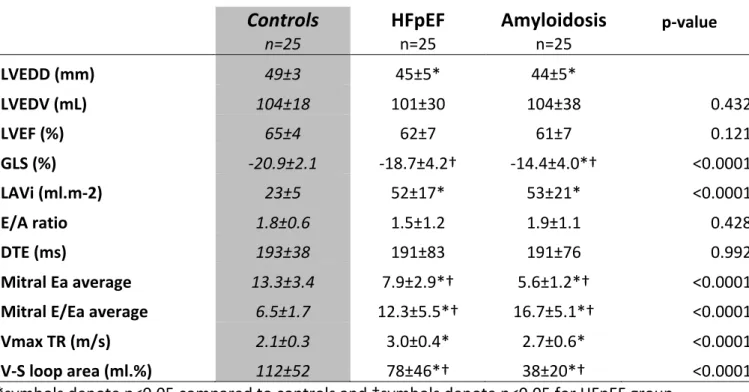
25 healthy control subjects.. Main echocardiographic results are shown in Table 1.
LVEF was preserved and similar between groups (p=0.121) whereas GLS was
in HFpEF and amyloidosis (-18.7% and -14.4%; respectively). Classical indices of
diastolic function are pathological in HFpEF and amyloidosis groups with greater left
atrial volume index, greater mitral average E/e’ ratio, faster tricuspid regurgitation, with
significant differences with controls (p<0.0001 for these three indices). SVL analysis
demonstrated a significant difference of the global area between groups, with the
smaller area in amyloidosis group (Figure 2.b), the greater in controls and a mid-range
value in HFpEF group (38 vs 112 vs 78 ml.%, respectively, p<0.0001). As shown in
Figure 2.a, p-value of SVL area between controls and the two other pathological
groups was <0.001.
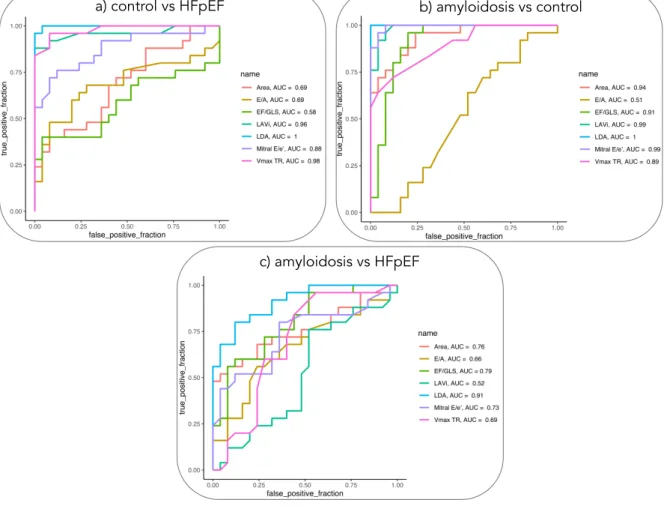
Concerning the comparison between amyloidosis and control groups (Figure 3), the
best AUC was found for E/e’ indices (AUC=0.99), while the best
discrimination between HFpEF and control groups was obtained for Vmax TR
(AUC=0.98). For the comparison of amyloidosis and HFpEF, the best AUC was
associated with LVEF/GLS ratio (AUC=0.79), followed by the SVL area (AUC=0.76).
These results were improved by using a LDA classifier (AUC = 0.91). When analyzing
the correlations between initial variables and LDA projections, the only values greater
than 0.6 were found for the EF/GLS ratio (r = 0.78) and SVL area (r = 0.75), which
suggests that they are the most important indices in the classification.
Discussion
This is the first study which demonstrated the potential clinical value of a
semi-automated indices using strain and volume curves for approaching non-invasively the
degree of diastolic dysfunction.
One main contribution of this work is to propose a novel tool to estimate left ventricular
volume from standard four- and two-chamber views. As opposed to previous published
works (9,13) where 2D-volume was assessed offline using specific software, the
proposed method only require knot positions obtained from semi-automatic
segmentation and strains. It allowed a reconstructed volume from the same
segmentation than strain, which decreased the potential errors than a “classical
method” using manual determination of volume by the Simpson’s biplane in one hand
and semi-automatic segmentation for strain in the other hand. Other authors proposed
a semi-automatic 3D volume-strain loop reconstruction(14,15) which is poorly
accessible in routine because of the necessity of 3D acquisition and dedicated offline
specific software.
Strain-volume loops development
First observations of the potential value of combining left ventricular volume
assessment and wall deformations to assess left ventricular function were made by
Gibson and Drown (16). Developments of LV strain in echocardiography, which is now
standardized(12), allowed the computation of the volume-strain loops. It was firstly
tested in 3D-TTE to observe left ventricular remodeling in ischemic and hypertrophic
cardiomypathies(15). It was then tested in 2D-TTE in athletes with significant
difference demonstrated according to the practiced sport-activity (17,18). Value of this
approach was also tested in aortic stenosis and aortic regurgitation patients. Authors
reach to more evidence for encouraging the study of these SVL for describing the
degree of diastolic dysfunction (9,19). Studying the literature and the remaining
controversies in regard to the complexity, the sometimes inaccuracy of the algorithms
of new tools. Some authors looked at LA strain (20), some at LA or LV strain rate.
Complementary tools like the lung Echography for counting the B-lines have been also
proposed(21). We believe that following the demonstrated value of computations like
the pressure/strain curves(22–24), it could be possible to implement in the
echo-platform physiological tools like the volume /strain curves.
Changes in strain-volume area
During systole, in all, groups, strain values were closely linked with volumes at each
period of time. Therefore, a greater area reflects an uncoupling between volume
changes and strain in diastole. These results are in contradiction with previous studies
that demonstrated a very low uncoupling in diastole in control subjects and a greater
uncoupling after ultra-endurance exercise or in case of aortic valvular heart disease
(9).
A possible explanation is the combined difference of LV volumes et LV strain between
groups. Indeed, cardiac amyloidosis is characterized by smaller LV cavities and
impaired left ventricular longitudinal strain, particularly in the basal LV segments.
Combination of both could decrease the absolute value of SVL area which artificially
decreases the apparent uncoupling.
Relations between LV wall thickness and LVEF were recently well described by Stokke
et al.(25). He demonstrates that in a ventricle with reduced volumes, wall thickness
has a substantial effect on EF. Indeed, an increased wall thickness maintains a
preserved ejection fraction despite an altered longitudinal strain. On the other hand,
an increased LV wall thickness is mainly associated with LV fibrosis and diastolic
dysfunction(26) so we can hypothesis that a small SVL area, that is a consequence of
dysfunction. Figure 2.b well illustrates the progressive reduction of SVL area with the
greater in control subjects, smaller in amyloidosis with an intermediate profile of HFpEF
patients. This study demonstrate a close relation between SVL area and diastolic
dysfunction but further studies will be necessarily to understand clearly what represent
physiopathologically SVL area.
Clinical implications
Diastolic function characterization remains a challenge in many clinical situations. The
load is an issue as well as Doppler or tissue Doppler applications to the shape of the
heart where calcifications or scare localized tissues might affect the value(3). Indeed,
the proposed algorithm to detect elevated LV filling pressure remain imperfect(4,21).
In addition, recommended parameters are based on manual measurements. This
leads to inter and intra-observer variability(27). On the contrary, SVL are
semi-automated, based only on strain curves and strain traces which produces a fast and
reproductible evaluation of the diastolic function. It could be implemented in
machine-learning algorithms(8). Great expectations are existing in this upcoming capability in
computing imaging data that are automatically measured for the 2D images for making
diagnostics. It might be more challenging for the current doppler traces that are mainly
recommended by recommendation, because the location of the sample site, the angle
between the doppler trace and the explored structures might have an impact on the
robustness of the measurements. Finally, SVL, because of their semi-automated
determination, could be easily integrated in machine learning algorithms to evaluate
diastolic function, more patho-physiologically than other strategies previously
Conclusion
Strain-volume loops area is related with degree of diastolic dysfunction. This new
semi-automated tool is very promising for future development of semi-automated diagnosis with
machine-learning algorithms. Further studies will be necessarily to understand the
mechanism of the relation.
Acknowledgments
This work was supported by the French National Research Agency (ANR)
Bibliography
1. Bleumink GS., Knetsch AM., Sturkenboom MCJM., et al. Quantifying the heart failure epidemic: prevalence, incidence rate, lifetime risk and prognosis of heart failure The Rotterdam Study. Eur Heart J 2004;25(18):1614–9. Doi: 10.1016/j.ehj.2004.06.038.
2. Ponikowski P., Voors AA., Anker SD., et al. 2016 ESC Guidelines for the diagnosis and treatment of acute and chronic heart failureThe Task Force for the diagnosis and treatment of acute and chronic heart failure of the European Society of Cardiology
(ESC)Developed with the special contribution of the Heart Failure Association (HFA) of the ESC. Eur Heart J 2016;37(27):2129–200. Doi: 10.1093/eurheartj/ehw128.
3. Nagueh SF., Smiseth OA., Appleton CP., et al. Recommendations for the Evaluation of Left Ventricular Diastolic Function by Echocardiography: An Update from the American Society of Echocardiography and the European Association of?Cardiovascular Imaging. Journal of the American Society of Echocardiography 2016;29(4):277–314. Doi:
10.1016/j.echo.2016.01.011.
4. Lancellotti P., Galderisi M., Edvardsen T., et al. Echo-Doppler estimation of left ventricular filling pressure: results of the multicentre EACVI Euro-Filling study. Eur Heart J Cardiovasc Imaging 2017;18(9):961–8. Doi: 10.1093/ehjci/jex067.
5. Lang RM., Badano LP., Mor-Avi V., et al. Recommendations for Cardiac Chamber Quantification by Echocardiography in Adults: An Update from the American Society of Echocardiography and the European Association of Cardiovascular Imaging. Eur Heart J Cardiovasc Imaging 2015;16(3):233–71. Doi: 10.1093/ehjci/jev014.
6. Haugaa KH., Dejgaard LA. Global Longitudinal Strain. Journal of the American College of Cardiology 2018;71(18):1958–9. Doi: 10.1016/j.jacc.2018.03.015.
7. Cho G-Y., Marwick TH., Kim H-S., Kim M-K., Hong K-S., Oh D-J. Global 2-Dimensional Strain as a New Prognosticator in Patients With Heart Failure. Journal of the American College of Cardiology 2009;54(7):618–24. Doi: 10.1016/j.jacc.2009.04.061. 8. Omar AMS., Narula S., Abdel Rahman MA., et al. Precision Phenotyping in Heart Failure and Pattern Clustering of Ultrasound Data for the Assessment of
Diastolic Dysfunction. JACC: Cardiovascular Imaging 2017;10(11):1291–303. Doi: 10.1016/j.jcmg.2016.10.012.
9. Hulshof HG., Dijk AP., George KP., Hopman MTE., Thijssen DHJ., Oxborough DL. Exploratory assessment of left ventricular strain–volume loops in severe aortic valve diseases. The Journal of Physiology 2017;595. Doi: 10.1113/JP273526.
10. Flachskampf FA., Biering-Sørensen T., Solomon SD., Duvernoy O., Bjerner T., Smiseth OA. Cardiac Imaging to Evaluate Left Ventricular Diastolic Function. JACC Cardiovasc Imaging 2015;8(9):1071–93. Doi: 10.1016/j.jcmg.2015.07.004.
11. Gillmore JD., Maurer MS., Falk RH., et al. Nonbiopsy Diagnosis of Cardiac Transthyretin Amyloidosis. Circulation 2016;133(24):2404–12. Doi:
10.1161/CIRCULATIONAHA.116.021612.
12. Voigt J-U., Pedrizzetti G., Lysyansky P., et al. Definitions for a common standard for 2D speckle tracking echocardiography: consensus document of the EACVI/ASE/Industry Task Force to standardize deformation imaging. European Heart Journal - Cardiovascular Imaging 2015;16(1):1–11. Doi: 10.1093/ehjci/jeu184.
13. Schneider C., Forsythe L., Somauroo J., George K., Oxborough D. The impact of preload reduction with head-up tilt testing on longitudinal and transverse left ventricular mechanics: a study utilizing deformation volume analysis. Echo Res Pract 2018;5(1):11–8. Doi: 10.1530/ERP-17-0064.
14. Zhu M., Chen H., Fulati Z., Liu Y., Su Y., Shu X. The value of left ventricular strain– volume loops in predicting response to cardiac resynchronization therapy. Cardiovasc Ultrasound 2019;17. Doi: 10.1186/s12947-019-0153-3.
15. Lilli A., Baratto MT., Del Meglio J., et al. Three-dimensional simultaneous strain– volume analysis describes left ventricular remodelling and its progression: a pilot study. Eur J Echocardiogr 2011;12(7):520–7. Doi: 10.1093/ejechocard/jer073.
16. Gibson DG., Brown DJ. Continuous assessment of left ventricular shape in man. Heart 1975;37(9):904–10. Doi: 10.1136/hrt.37.9.904.
17. Lord R., George K., Somauroo J., et al. Alterations in Cardiac Mechanics Following Ultra-Endurance Exercise: Insights from Left and Right Ventricular Area-Deformation Loops. Journal of the American Society of Echocardiography 2016;29(9):879-887.e1. Doi:
10.1016/j.echo.2016.05.004.
18. Oxborough D., Heemels A., Somauroo J., et al. Left and right ventricular longitudinal strain-volume/area relationships in elite athletes. The International Journal of Cardiovascular Imaging 2016;32(8):1199–211. Doi: 10.1007/s10554-016-0910-4.
19. Donal E., Galli E., Fraser AG. Non-invasive estimation of left heart filling pressures: another nail in the coffin for E/e’? Eur J Heart Fail 2017;19(12):1661–3. Doi:
10.1002/ejhf.944.
20. Thomas L., Marwick TH., Popescu BA., Donal E., Badano LP. Left Atrial Structure and Function, and Left Ventricular Diastolic Dysfunction: JACC State-of-the-Art Review. Journal of the American College of Cardiology 2019;73(15):1961–77. Doi:
10.1016/j.jacc.2019.01.059.
21. Hubert A., Girerd N., Le Breton H., et al. Diagnostic accuracy of lung ultrasound for identification of elevated left ventricular filling pressure. Int J Cardiol 2019;281:62–8. Doi: 10.1016/j.ijcard.2019.01.055.
22. Russell K., Eriksen M., Aaberge L., et al. A novel clinical method for quantification of regional left ventricular pressure–strain loop area: a non-invasive index of myocardial work. European Heart Journal 2012;33(6):724–33. Doi: 10.1093/eurheartj/ehs016.
23. Hubert A., Le Rolle V., Leclercq C., et al. Estimation of myocardial work from pressure-strain loops analysis: an experimental evaluation. Eur Heart J Cardiovasc Imaging 2018. Doi: 10.1093/ehjci/jey024.
24. Galli E., Leclercq C., Fournet M., et al. Value of Myocardial Work Estimation in the Prediction of Response to Cardiac Resynchronization Therapy. Journal of the American Society of Echocardiography 2018;31(2):220–30. Doi: 10.1016/j.echo.2017.10.009.
25. Stokke TM., Hasselberg NE., Smedsrud MK., et al. Geometry as a Confounder When Assessing Ventricular Systolic Function. Journal of the American College of Cardiology 2017;70(8):942–54. Doi: 10.1016/j.jacc.2017.06.046.
26. Silbiger JJ. Pathophysiology and Echocardiographic Diagnosis of Left Ventricular Diastolic Dysfunction. Journal of the American Society of Echocardiography 2019;32(2):216-232.e2. Doi: 10.1016/j.echo.2018.11.011.
27. Farsalinos KE., Daraban AM., Ünlü S., Thomas JD., Badano LP., Voigt J-U. Head-to-Head Comparison of Global Longitudinal Strain Measurements among Nine Different Vendors. Journal of the American Society of Echocardiography 2015;28(10):1171-1181.e2. Doi: 10.1016/j.echo.2015.06.011.
Tables
Table 1: Main echocardiographic characteristics
Controls
n=25HFpEF
n=25Amyloidosis
n=25 p-value LVEDD (mm) 49±3 45±5* 44±5* LVEDV (mL) 104±18 101±30 104±38 0.432 LVEF (%) 65±4 62±7 61±7 0.121 GLS (%) -20.9±2.1 -18.7±4.2† -14.4±4.0*† <0.0001 LAVi (ml.m-2) 23±5 52±17* 53±21* <0.0001 E/A ratio 1.8±0.6 1.5±1.2 1.9±1.1 0.428 DTE (ms) 193±38 191±83 191±76 0.992 Mitral Ea average 13.3±3.4 7.9±2.9*† 5.6±1.2*† <0.0001Mitral E/Ea average 6.5±1.7 12.3±5.5*† 16.7±5.1*† <0.0001
Vmax TR (m/s) 2.1±0.3 3.0±0.4* 2.7±0.6* <0.0001
V-S loop area (ml.%) 112±52 78±46*† 38±20*† <0.0001
*symbols denote p<0.05 compared to controls and †symbols denote p<0.05 for HFpEF group compared to amyloidosis group.
HFpEF: Heart failure with preserved ejection fraction; LVEDD: left ventricular
end-diastolic diameter; LVEDV: left ventricular end end-diastolic volume; LVEF: Left ventricular
ejection fraction; GLS: Global longitudinal Strain; LAVi: Left atrial volume index; DTE:
Deceleration time of E wave; Vmax TR: Maximal velocity of tricuspid regurgitation;
Figures
Figure 1: Global methodology including: i) left ventricular volume estimation by spline interpolations from apical 2 and 4 cavities strain full traces, ii) analysis of ventricular volume and iii) strain-volume loop area estimation.
Figure 2: a) Boxplot of strain-volume loops area, b) Median strain-volume loops for the three populations of patients
1 loop TTE long axis view 1 loop TTE 4C view 1 loop TTE 2C view Echocardiography Resampling of all points coordinates Spline
interpolation estimationVolume
Resampling of strain in function of
pre-defined increments of LV-volume Strain-volume loop area
Volume estimation
beginning of
cardiac cycle cardiac cycleend of
w1
w2
Ventricular volume Strain/Volume loop Systolic phase Diastolic phase a) b)Figure 3: ROC curves for the comparison between a) control vs HFpEF, b) amyloidosis vs control, c) amyloidosis vs HFpEF, showing detection performance for classical indices of diastolic function (LAVi, E/A ratio, Mitral E/e’ average, Vmax TR), EF/GLS ratio, SLV area and the results of LDA classifier
c) amyloidosis vs HFpEF
b) amyloidosis vs control a) control vs HFpEF