STAYING ON THE TOP. WHY CITIES MOVE UP (OR DOWN) THE URBAN HIERARCHY: AN INTERNATIONAL COMPARISON OVER A HUNDRED YEARS
Mario Polèse
Jonathan Denis-Jacob
Inédits / Working papers, no 2009-02
Mario POLESE and Jonathan DENIS-JACOB
Spatial Analysis and Regional Economics Laboratory
Centre Urbanisation Culture Société Institut national de la recherche scientifique
Montreal, QC, Canada
Paper presented at the First Conference of the Regional Science Association of the Americas, Cartagena de Indias,
Columbia, February 12th and 13th 2009
February 2009
STAYING ON THE TOP. WHY CITIES MOVE UP (OR DOWN) THE URBAN HIERARCHY: AN INTERNATIONAL COMPARISON OVER A HUNDRED YEARS
Mario Polèse
Jonathan Denis-Jacob
Mario Polèse et Jonathan Denis-Jacob [email protected]
Centre - Urbanisation Culture Société Institut national de la recherche scientifique 385, rue Sherbrooke Est
Montréal (Québec) H2X 1E3 Téléphone : (514) 499-4070 Télécopieur : (514) 499-4065 www.ucs.inrs.ca
*The first author holds the Senior Canada Research Chair in Urban and Regional Studies. The authors thank the Social Sciences and Humanities Research Council of Canada (SSHRC) and the Fonds Québécois de la recherche sur la société et la culture (FQRSC) for their financial support.
ABSTRACT
The paper examines the evolution of urban hierarchies in 74 nations since 1950 and 52 nations since 1900, focusing on cities at the top. The principal constraint is empirical: constructing an appropriate data base with consistent urban definitions and populations over time. Given the data constraints, only ranks are considered. The universe studied comprises 375 urban areas for 1950 and 288 for the year 1900, each ranked within their respective national urban systems. Rank-correlations are carried for both sets for all cities and for sub-sets. As would be expected, correlations with current ranks are stronger with 1950 than with 1900 rankings. Europe shows significantly greater stability than New World or Developing nations, suggesting that urban hierarchies stabilize as they mature. Changes at the top are exceptional in Europe. Outside Europe changes at the top are less unusual. Some cases stand out: the Rio de Janeiro/São Paolo reversal, the Montreal/Toronto reversal, and the fall of Kolkata (Calcutta) from first to third place since 1900. A systematic explanation of why top cities move up or down the urban hierarchy is difficult to arrive at. The paper identifies five possible causes, but which still leave room for unexpected outcomes.
Keywords: Urban Hierarchy, Urban Growth, Urban Economy
L’article propose une étude de l’évolution de la hiérarchie urbaine de 74 pays depuis 1900 et de 52 pays depuis 1950, en mettant l’accent sur les villes au sommet. La principale contrainte est d’ordre empirique : construire une base cohérente de données urbaines sur cent ans. Devant les limites statistiques, uniquement les rangs urbains ont été considérés. L’univers retenu comprend 375 villes en 1950 et 288 pour l’année 1900. Des corrélations - entre rangs urbains à 50 ou 100 ans d’intervalle – ont été effectuées. Les hiérarchies urbaines de l’Europe sont nettement plus stables que celles des pays en développement ou des pays de nouveau peuplement; ce qui laisse entendre que les hiérarchies ont tendance à se stabiliser après un certain stade. En Europe, des changements au sommet sont exceptionnels. Ailleurs, ils le sont moins. Certains cas ressortent : l’inversion au sommet de Rio-de-Janeiro, de São Paulo, de Montréal et de Toronto, comme la chute de Calcutta de la première à la troisième place. Il est difficile de proposer une explication systématique pour des changements au sommet. Nous proposons cinq raisons possibles, mais qui laissent toujours de la place pour des événements imprévisibles.
“The city at the top changes only very rarely. When such a change does occur... it is always of great significance, signaling the break in a seemingly predictable story, opening the doorway to a new era…”
Fernand Braudel (1979: 26-27, our translation) In this paper the stability of national urban hierarchies over time is examined, focusing on cities at the top. How frequent are changes at the top? Is it possible, we also ask, to arrive at general explanations of why observed changes occurred?
NOT THE PAPER FIRST INTENDED
This paper is different from that originally planned. The initial jumping-off point for the paper was abundant literature on the stability of urban hierarchies and city-size distributions (Black and Henderson 1999, Brakman et al 2004, Davis and Weinstein 2002, Eaton and Eckstein 1997, Guérin-Pace 1995, Ioannides and Overman 2003, Sharma 2003). For the US, Black and Henderson (1999: 327) for example note the “remarkable stability” of the relative size distribution of cities between 1900 and 1990. In France the population of Greater Paris relative to that of the next largest urban area (Lyon) – a ratio of seven to one - has hardly budged over a century and a half (Guérin-Pace 1995). The observed stability of urban hierarchies has strong theoretical foundations, whether harking back to central place theory, Zipf’s rank-size rule or to explanations based on equilibrium solutions and random growth models (Eaton and Eckstein 19997, Eeckhout 2004, Gabaix 1999, Rosen and Resnick 1980). Implicit in all this is the idea that major upsets in the relative standing of cities are rare occurrences; a viewpoint shared by the authors at the outset of the study.
The initial plan was to do an international comparative study of as many nations as possible, concentrating on the top end of the urban hierarchy; a study that would, we expected, confirm the inherent stability of national urban systems. This was then to be followed up by a regression model, in which we would attempt to explain why certain cities moved up our down the urban hierarchy. The implicit hypothesis was that such movements – a priori rare – could be (statistically) explained, at least in part, by a finite set of quantifiable variables. As work progressed, it became increasingly clear that the authors were wrong on both counts. First, movements up or down the urban hierarchy were not all that rare. Second, the possible causes behind the observed changes could not easily be reduced to a set of quantifiable variables. Consequently, the idea of a regression model or any kind of statistical model was progressively abandoned. All this will, hopefully, become clearer as the results are presented.
On the stability of urban hierarchies
In the literature on the stability of urban hierarchies, rank-constancy and the constancy of city-size distributions are sometimes unintentionally mixed up, where the first refers to individual cities maintaining their respective ranks over time and the second to the stability of relative distributions of cities between different size classes. In the Black and Henderson (1999) quote above, the observed stability refers to the second type.
There are good theoretical reasons why the basic symmetry of city-size distributions should remain generally stable over time, changing only very slowly if at all. The economic foundations for the existence and the persistence of different-sized cities are fairly well understood. For activities whose location is chiefly guided by the spatial distribution of demand - services mainly – classical central place theory remains entirely adequate. The essential trade-off is between scale economies and transportation costs, where the latter is often born by consumers. The greater the required market and the further consumers are willing to travel (or the greater the easy of delivery), the greater the propensity of a given activity to locate in the “centre”, giving rise to the largest cities. Activities with the opposing attributes will give rise to smaller urban places. This is economic geography 101 and needs no further explanation.
For manufacturing, Henderson (1997) very deftly explains how the trade-off between the advantages of size (agglomeration economies) and the higher costs associated with size (for land and labour, mainly) drives firms sensitive to such costs to seek out smaller cities. Without necessarily going into the workings of mathematically elegant models such as those proposed by Córdoba (2008) and Eeckhout (2004) the overall image conveyed by the various explanations founded on economic reasoning is that of an urban system where the constant interplay between agglomeration economies and diseconomies creates a fundamentally stable system – some industries moving up, some down – tending to an equilibrium where urban growth occurs randomly, irrespective of city size.
This does not necessarily preclude specific cities moving between city-size classes, although a stable symmetry of city-size distributions does suggest that major changes should be rare, and generally be the product of severe exogenous shocks to the system. Brakman et al (2004) note that the impact of the bombing of West German cities during World War II had a significant but only temporary impact on the growth path of cities, suggesting that cities have generally maintained their relative positions in the urban hierarchy. Perhaps the most explicit example of an overlap between the two stabilities is the observation by Davis and Weinstein (2002) that Hiroshima and Nagasaki eventually recaptured their historical spots in the Japanese urban hierarchy some two decades after
7
being destroyed. The contrast with Bosker et al (2008) is instructive, in which the authors specifically note (p. 339) that larger German cities “were all hit (bombed) quite similarly and more heavily compared to smaller cities…” leading to a permanent shift in the internal symmetry of city-size distributions towards smaller centres. In sum, Hiroshima and Nagasaki returned into their old spots because they were singled-out, while in the German case a whole city-size class was targeted (my apologies for the unintended pun). But, in both cases the underlying message is the same: it takes a major shock to upset the inherited order of an established urban hierarchy.
The experience of New World nations tells another story. The observed stability of city-size distributions in the US can evidently not be equated with stable individual city rankings. To take an obvious example: Los Angeles, today the second largest metropolitan area (CMSA1
1 Consolidated Metropolitan Statistical Area. US data for 2000 and for 1900 are, respectively, from 2000 US Census
and from Chandler and Fox (1974).
) after New York was in 27th place in 1900. Over the same time period, the Dallas-Fort Worth metro area moved up from 45th to 8th place. In the US, the observed stability of city-size distributions is a matter of cities continually rearranging themselves between different size classes; but which in the end remain remarkably stable with respect to the relative number of cities in different size classes. Volatility in individual city trajectories is not, in sum, in contradiction with generally stable city size distributions. To some extent, this is as much a mathematical regularity as a predictable outcome of economic forces. By definition, the cities at the top will always be far fewer than those at the bottom.
For Canada, Polèse and Shearmur (2004, 2006) shed light on the apparent contradiction between the volatility of individual city ranks and the observed stability of industry location patterns. In the 2004 article, the authors note the reversal at the top between Montreal and Toronto, where the latter overtook the former to become Canada’s largest city and dominant financial centre. In the 2006 article, the authors note the remarkable stability (1971-2001) of industry location distributions between different city-size classes and between central and peripheral locations. Specialized financial services, for example, exhibit a hierarchical distribution that varies only slightly over the thirty year period studied. More to the point, specialized financial services are predictably sensitive to city-size (this does not change); but this is not useful in predicting in which large city specifically financial services will disproportionately concentrate. In Canada, high-order financial services shifted to Toronto because they could: Toronto, like Montreal, was a large city. This, however, begs the question of why such shifts at the top occur.
Changes at the top should be rare occurrences. The uppermost rung in city-size distributions is logically the most stable. Smaller cities are, by definition, more volatile, subject to random forces and outside events. While it is possible to imagine a city going from 25th place to, say, 2nd place (we just did: recall Los Angeles), the opposite is more difficult to imagine. For all European nations, with only two exceptions, the largest city today (year 2000 or more recent) is the same as a century earlier, as we shall see. Very few number two spots have changed either. These, like Japan, are mature economies and inhabited spaces, settled and built up over centuries. Once established, the cities at the top are hard to dislodge. National transport systems will have been built around them. And, as Davis and Weinstein (2002) suggest, the basic geographic fundamentals (soil fertility, access to water and harbours, etc….) on which their initial advantage was built do not change. Increasing returns, specifically to human capital accumulation (Krugman 1991, Romer 1986), should further solidify the advantages of the first to become big. Paris cannot be undone; nor can Tokyo or London be undone. All three remain magnets for the best and the brightest in their respective nations. It is difficult to imagine a shock that would succeed in dislodging London as Britain’s first city or Paris as France’s pre-eminent metropolis.
Yet, as the US and Canadian examples testify, shifts at the top are not unheard of. Staying in the Americas, São Paulo has replaced Rio de Janeiro as Brazil’s largest metropolis. In all three nations, the change at the top was the sign of a major internal shift, which went beyond mere interurban competition. In the US, it was the rise of California and the West Coast, breaking the quasi-monopoly of the East Coast megalopolis on American life. In Brazil, it was the no less dramatic shift from the old planter-based economy centred on the North-eastern coast to the new rising (more recently settled) South. The Montreal/Toronto reversal was the outcome of the rise of Quebecois nationalism, which transformed the Canadian political agenda and at times threatened the very existence of the Canadian federation (Polèse and Shearmur 2004), a first indication that changes at the top do not easily lend themselves to general explanations.
DATA AND METHODOLOGY
The principal challenge for this paper is empirical. Focusing on cities at the top of the urban hierarchy is not only conceptually appealing but also an empirical necessity. To build a statistically significant set of observations, at least forty nations are required. Constructing consistent historical data series for a single national urban hierarchy is already an exploit. City definitions change over time. Doing it for more than three or four nations is close to impossible. Our final data set contains 74 nations for which we have information on population size for at least the three largest cities in 1950 (or the most proximate year) and 52 nations for which we have analogous information for the year 1900 or, again, the most proximate year. For both sets, we have the most recent city population figures, which is either for the year 2000 (used in many censuses) or more current, where available. Cities refer to urban areas, agglomerations or metropolitan areas, unless noted otherwise.
Nations were chosen as follows. We began by identifying all nations whose boundaries had not significantly changed since the two reference years (1950 and 1900), excluding very small states such as Luxembourg and Bhutan and small island states such as Malta and Mauritius. An obvious constraint was the availability of data, which excluded several less developed nations, especially for 1900, which were barely urbanized at the time. Examples are Afghanistan, Congo, and Mongolia. Some nations which underwent boundary changes were nonetheless retained, applying current boundaries to the reference years. Two major examples are Germany and India. Thus in Germany, only cities that are part of Germany today were counted in 1900, leaving aside cities such as Breslau (Wroclaw), now in Poland. By the same token, cities now in Pakistan or in Bangladesh were not counted in India for 1900. Brakman et al (2004) and Sharma (2003) followed, respectively, the same procedure.
The boundary problem eliminates all the successor states of the former Soviet Union and of Yugoslavia since 1950, as well as the successor states of the Hapsburg and Ottoman Empires before 1950. We made an exception for Turkey, Syria, and Lebanon (wholly contained within the Ottoman Empire in 1900), because the former is a fairly well defined territorial unit – surrounded by water on three sides and the latter two have historical identities with, arguably, fairly autonomous urban systems. The same can not be said for example of Austria’s present urban system set within the imperial borders of 1900. The choice of which territories to keep and which to eliminate based on boundary changes involved a certain element of judgement. The complete list of states for which
city data was collected for 1950 and 1900 is given in Appendix 1, together with the number of cities counted in each case.
Choosing the number of cities to count is no less problematic. Data limitations aside, we ideally aimed at a number – arbitrarily set at a minimum of three (3) and a maximum of ten (10) – that would encompass comparable shares of national urban populations. For example, Mexico’s seven largest urban areas account for about 43 % of its total current urban population, as do the five largest cities in the Netherlands. In smaller nations, one would expect to need fewer cities to arrive at equivalent urban population shares; but as we discovered, the relationship between the number of cities, national urban population shares, and country size is by no means systematic. In the end, because of wide fluctuations between nations, we settled on a minimum of 30 % of the total national urban population. Even here, we were forced to accept an exception: China’s ten largest cities account for barely 20 % of its total national urban population.
The most difficult challenge of all is finding time series data with consistent definitions of cities over long periods. The simple fact is that such series do not exist; with only rare exceptions, which is why the authors of the country studies cited earlier usually devoted considerable time and energy to building consistent urban time series data for their respective nations. There are at least two reasons for the absence of consistent time series. First, systematic definitions by national statistical agencies of what constitutes an urban area are a fairly recent occurrence. Even today, various definitions may exist within the same nations of how urban areas are defined, depending on the source. Second, cities everywhere – notably, the biggest - have expanded geographically over time, especially since the advent of mass transport and the automobile. The New York built-up urbanized area, to take an example, is today far larger than that of 1900 and, in addition, more then one definition exists of what constitutes the New York Urban Area. City boundaries over time are necessarily elastic. A stable urban boundary is almost an oxymoron.
It should thus come as no surprise that population estimates differ between various sources. The complete list of sources is given in Appendix 2. We adopted two simple rules, named horizontal and vertical compatibility; where the first refers to consistency over time (for the same city) and the second to consistency between cities. Where possible, we aimed for both, minimizing jumps between different sources; but giving greater weight to horizontal consistency. Where the same source, for example, gave population figures for 2000, 1950 and 1900 (or proximate dates), that is the source we choose. This, unfortunately, was not often the case. For historical series, well-known sources such as Chandler and Fox (1974) and Moriconi-Ebrard (1994) were preferred over more obscure sources, which now abound on the Internet. When, even for current
11
figures, results differed between sources, we choose the source that also provided estimates for at least one of the reference years. Despite all the precautions taken, we readily acknowledge that our data set is far from perfect; but, probably close to the best that can done under the circumstances.
The necessary imperfections in urban population estimates over time impacts the analysis in at least two ways. First, any ambitions we initially had in analyzing variations in actual population numbers were abandoned. In the analysis that follows, we look at ranks only. Second, our discussion of specific changes in urban rank will focus on changes (up or down the urban hierarchy) that are clear, and not founded on small population differences. For example, population estimates for Milan and Rome are very close for 1900, respectively holding ranks 2 and 3 in the Italian urban hierarchy at the time. Their population numbers are still close today, now respectively holding ranks 2 and 1. What is noteworthy is not that Rome overtook Milan (since this varies depending on current population estimates); but rather that Rome moved up the urban hierarchy, while Naples (number one in 1900) moved down to the number 3 spot. The use of ranks, while less prone to errors, is however statistically inconvenient for comparing changes, since changes at the top, say from rank 1 to rank 2 (a doubling in value), weighs more than a move from rank 9 to 10. This limitation needs to be kept in mind when considering our correlation results.
Because of the empirical hurdles, we choose to adopt a reverse time approach, where the most current datum (often for the year 2000, as noted) acts as our anchor, and moving back in time. The anchor data set, with a maximum of 375 urban areas, identifies their current ranks. These are then compared with their respective ranks in 1950 and in 1900 where applicable. The task thus was finding data that would allow us to attribute a rank to these same cities in 1950 and in 1900. On the whole, we were able to do this with an acceptable level of confidence for 1950. The year 1900 proved more difficult, with fifteen (15) missing values out of a total 288 (5.2 %). Values were missing because the city did not exist in 1900 or was too small to attribute it a plausible rank. For example, the population of Miami was 1,700 in 1900 and unknown for Tijuana, Mexico. We attributed ranks in such cases using the following rule: Cities for which we had no data or for which population numbers were too small were given ranks two slots below the lowest city for which we had data. Thus if the lowest rank of a city in 1900 in nation x was spot 7, the missing city would receive a value of 9. If the city was not yet founded, we attributed a slot two spots below the number of cities counted. Thus, if nation x has five cities in its top list, the non-existent city would receive rank 7 in 1900.
The emergence since 1900 or 1950 of large urban conurbations and city-regions creates additional problems. What were once distinct urban areas – commuting sheds - may have merged over time into a single multi-city labour market. Duisburg and Essen in Germany, to take an example, are part of the same great Ruhr conurbation. But, Duisburg and Essen were clearly two distinct cities in 1900. The same reasoning applies to Amsterdam, Rotterdam, and The Hague in the Netherlands, part of the greater Randstaad conurbation. In most if not all such cases, it is not possible to reconstitute the current conurbation in 1900 or in 1950. In the Dutch and German cases, we thus kept the original cities, which is also the solution adopted by Bosker et al (2008) and Brakman et al (2006) for the latter; which does not necessarily mean, however, that city boundaries remained stable2. For other cases, we introduced a thirty kilometre rule to eliminate quasi-suburban cities that mushroomed within the urban shadow of a large metropolis. Towns such as Samut Prakan and Nonthaburi near Bangkok are examples. The same rule allowed us to eliminate Shenzhen (population: 8.5 million in 2007) located immediately north of Hong Kong, which was not part of China in 1950 and 1900.
Finally, in order to account for the east-west settlement movement in North America, still in full swing in 1900, we created two separate urban hierarchies for 1900 and for 1950 for the US and Canada. A north-south line was drawn beginning at the Ontario-Manitoba boundary in Canada extending south along the Minnesota-Dakotas boundary to the Gulf of Mexico at the Louisiana-Texas boundary. The line traces the approximate limit of full settlement in 1900. The US urban hierarchy (10 top cities) in 1900 includes only cities east of that line, as it does for Canada (7 top cities). The 1950 hierarchy refers to the entire nation. In both cases, the point of departure is always the current rankings of those same cities, as it is for all nations throughout this paper.
2
RESULTS
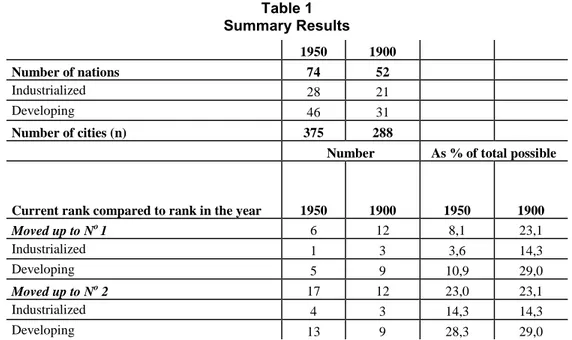
Newcomers to the top are indeed an infrequent occurrence; but not necessarily rare (Table 1). Among industrialized nations, only one newcomer – Toronto - arrived at the top since 1950, out of a total possible of 28 top spots. The Montreal/Toronto reversal is truly exceptional. As would be expected, the number of newcomers to the top increases as we move back in time. If we compare today’s top industrialized cities with their ranks in 1900, we find that three are newcomers (out of a total possible of 21), which is still a sign of fairly stable hierarchies. The number of newcomers to the number two spot (excluding those that fell there, like Montreal) is also fairly small.
Table 1 Summary Results 1950 1900 Number of nations 74 52 Industrialized 28 21 Developing 46 31 Number of cities (n) 375 288
Number As % of total possible
Current rank compared to rank in the year 1950 1900 1950 1900
Moved up to No 1 6 12 8,1 23,1 Industrialized 1 3 3,6 14,3 Developing 5 9 10,9 29,0 Moved up to No 2 17 12 23,0 23,1 Industrialized 4 3 14,3 14,3 Developing 13 9 28,3 29,0
Urban hierarchies are more volatile in developing nations. One out ten top cities did not hold that rank in 1950. The number rises to three out of ten if the reference year is 1900. New moves into the number two spot are also fairly frequent: about one out three for both reference years. A first fairly obvious conclusion follows from these raw results. Urban hierarchies tend to harden over time. Mature urban hierarchies – in nations that have completed the rural-urban transition - are as a rule more stable than hierarchies in still urbanizing nations. Stated differently, in well-established developed nations the chances of a newcomer climbing to the top are rather slim, making the rare cases where this did happen all the more fascinating.
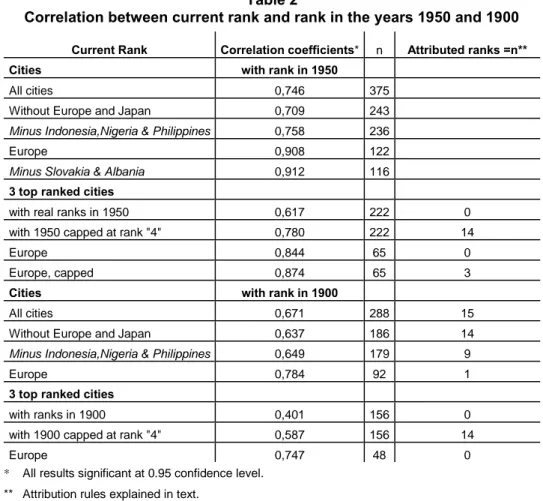
Table 2 shows rank correlations for various sets and subsets of top cities. For all cities (with possible ranks ranging between 1 and 10) the correlation coefficient with current rank positions is 0.75 for 1950 and 0.67 for 1900. Again, as would be expected the correlation falls over time. A city’s position fifty (or a hundred) years ago is a fairly good predictor of where it is today, but shifts are not unusual. However, the likelihood of shifts falls as we move between various subsets of cities. Taking 1950 as our base year, the coefficient rises to 0.91 if we consider Europe only, and even slightly higher if we exclude Slovakia and Albania, which are a-typical3
Current Rank
.
This reinforces the perception that mature urban hierarchies are stable and change only very slowly over long periods of time or as a result of a violent shock. For Europe, a coefficient of 0.78 with 1900 points to hierarchies that have changed at the top, but in which the majority of cities have nonetheless kept the same rank (or close) as a century ago.
Table 2
Correlation between current rank and rank in the years 1950 and 1900
Correlation coefficients* n Attributed ranks =n**
Cities with rank in 1950
All cities 0,746 375
Without Europe and Japan 0,709 243
Minus Indonesia,Nigeria & Philippines 0,758 236
Europe 0,908 122
Minus Slovakia & Albania 0,912 116
3 top ranked cities
with real ranks in 1950 0,617 222 0
with 1950 capped at rank "4" 0,780 222 14
Europe 0,844 65 0
Europe, capped 0,874 65 3
Cities with rank in 1900
All cities 0,671 288 15
Without Europe and Japan 0,637 186 14
Minus Indonesia,Nigeria & Philippines 0,649 179 9
Europe 0,784 92 1
3 top ranked cities
with ranks in 1900 0,401 156 0
with 1900 capped at rank "4" 0,587 156 14
Europe 0,747 48 0
* All results significant at 0.95 confidence level. ** Attribution rules explained in text.
3 We say a-typical because: 1) these are fairly rural nations in a European context; 2) the cities below the top city- the
15
The greater volatility of developing and New World nations is reflected in their lower coefficients for 1950 and 1900, respectively 0.71 and 0.64. The coefficients improve slightly if Indonesia, Nigeria, and the Philippines are excluded. There are several reasons why these three large nations are problematic, aside from the importance of missing values. The first two nations are archipelagos. Arguably, central place theory and urban size distribution models do not apply to such collections of islands, since distance and centrality take on a different meaning. Each large island (i.e. Java, Luzon…) might be considered a distinct system4
Are there any general rules on why cities move to (or fall from) the top?
.
Another reason is that both nations, like New World nations, have undergone settlement shifts over time, out of Java in Indonesia and towards Mindanao and the south in the Philippines. In Nigeria we face something approaching a dual urban system, where one part of the nation (the southwest historically centred on Ibadan) has a more developed urban system than another part; the north in this case with Kano as its top city, where cities are correspondingly growing at a faster rate in what is basically a catching-up process. The difference between the two urban systems is in part a reflection of the cultural split between the Yoruba southwest and Hausa-Fulani north. These three nations raise an issue which we shall not explore further, but to which we nonetheless call attention: are nations always the salient unit for urban systems analysis? Like most authors, we implicitly assume that they are; which is open to argument, especially in an increasingly interconnected world.
On table 2, we also show correlation coefficients for constrained urban hierarchies, limited to the three top current cities. These should not be compared with results for all cities, but rather internally, because of the limitations of rank correlations, alluded to earlier. In part because of this we also “capped” observations at rank 4; meaning that no city among the current top three could fall below 4th place. The results confirm yet again the difference between Europe and elsewhere. Outside Europe, changes at the top are by no means infrequent, which raises the more interesting question of why such changes occur?
The answer to the question above is “no….but”; as will become clearer shortly. We now enter the realm of what economic geographers sometimes call “accidents” (Krugman 1995), singular events that cannot be easily predicted or modelled. It is obviously impossible for one researcher or even a group of researchers to know the details of the history of every city in our universe that changed rank. We shall limit our analysis to
4 Japan is slightly different, although also an archipelago, since – with the exception of Hokkaido - the main islands are
major urban areas – those with current populations over 500,000 – and focus on those cases for which we feel the least lost. We readily acknowledge the limits of our interpretations, based in far too many cases on only a cursory knowledge of the cities involved5
Table 3 lists the major urban areas that have moved up to the number one or two spots since 1900 or 1950. The possible explanations are grouped under five headings, plus a residual heading. The five proposed explanations are not mutually exclusive. A city may well have catapulted to the top for a combination of all five. Los Angeles, which moved from the 27th spot in 1900 to third place in 1950 and then up to second place, is a good example of a move up fuelled by more than one factor; in this case: the east-west settlement shift of the American population; the city’s Sunbelt and coastal attributes; technological change, notably the arrival of air-conditioning.
Table 3
Urban areas [population over 500,000] that moved up to the number one or two spot in their respective national urban hierarchies since 1900 . Urban Area [moved up to no 1] Rank 1900 Rank 1950 Current Rank Explanatory Factors Settlement Shift / Location Climate / Sun & Surf Resources/ Technol. Change Political Choices & Events Conquest, Globaliz. & Trade Other / Specific Casablanca 9 1 1 Lagos 8 2 1 Riyadh 4 3 1 Rome 3 1 1 Johannesburg 2 1 1 Shanghai 2 1 1 Mumbai 2 2 1 Jakarta 2 1 1 Madrid 2 1 1 São Paulo 2 2 1 Managua 2 1 1 Toronto 2 2 1 Damascus 1 2 1 5
We have chosen not to give detailed sources for of our various assertions, many of which are necessarily broad-brush, for this would have created an almost unmanageable jumble of references. The Internet, it is not difficult to guess, was an immense help. Also, many of our interpretations are informed either by personal knowledge of the places mentioned or by discussions with colleagues. For example, our results were shown to a Chinese colleague, who aided us in our understanding of Chinese cities.
17
Times mentioned (weighted) 2,5 0 2,5 8 3,5 1
Urban Area [moved up to no 2] Rank 1900 Rank 1950 Current Rank
Ciudad del Este (Para) n/a n/a 2
Los Angeles 27 3 2
Bandung 8 3 2
Delhi 7 4 2
Ankara 6 2 2
Santa Cruz (Bolivia) 5 5 2
Guangzhou 4 5 2 Cordoba (Argentina) 4 3 2 Meshed (Iran) 4 4 2 Rabat 3 3 2 Durban 3 3 2 Birmingham UK 3 3 2 Lyon 2 3 2
Times mentioned (weighted) 5 2 2,5 3,5 2,5 2
Weighting. Primary Factor (darker) = 1. Secondary Factor (lighter ) = 0.5.
The settlement shift explanation does not require a long discussion. A city located in a part of the nation towards which population is historically shifting will be naturally favoured over others. The settlement shift explanation is applicable to other cases in New World or analogous situations: Johannesburg; São Paulo; Cordoba in Argentina. Johannesburg’s rise to the top spot in South Africa is in part an outcome of the long-term population movement (specifically of the early European settlers and their descendants) out of the Cape Province and into interior, and the corresponding fall from first place of Cape Town. Johannesburg’s rise was also fuelled by a true “accident”: the discovery of gold on the Rand in the late 19th century. Cordoba’s rise within Argentina is also a reflection of a coast-inland movement analogous to the east-west drift within the US. The two most spectacular moves up to the number one spot are Casablanca and Lagos with gains, respectively, of 9 and 8 slots since 1900. Both illustrate the interplay between several factors. In Morocco, the interior-coastal population shift since the establishment of a French protectorate in 1912 has favoured Casablanca and Rabat over Marrakech and other old cities of the mountainous (and largely Berber) interior; a shift which continued after independence in 1956. This shift is in turn intertwined with the dual impact of colonial conquest and trade as the Moroccan economy was progressively integrated into first the French and then the global system. The French made the small coastal city of Casablanca into what was to become the economic capital of Morocco. The French also choose the coastal city of Rabat as their capital (moving it from Fès), a choice maintained after independence, thus eclipsing the old interior royal cities of Meknes and Fès. The
latter was once deemed to be the largest city in all of North Africa. The story of Lagos is not very different; a tale again of conquest, trade, and colonial choice of capital city, with technology also playing a role; specifically, improvements in medicine and sanitation, making it easier to survive in tropical climes. As in Morocco, older interior cities – Ibadan, most notably - were bypassed and overtaken, pushed down the urban hierarchy. In both nations, the change at the top is the product of a major shock, marking a turning point in the nation’s history.
For arrivals at the top spot, politics – in the broadest meaning of the word - is by far the most frequent factor. Of the thirteen cities that occupy the number one spot today, but did not fifty or a hundred years ago, seven are capitals, if Lagos is included6. These were often purely political choices, such as Riyadh (Saudi Arabia) and Managua in Nicaragua, part of the process of nation building. Managua was a compromise choice between the competing capitals of (liberal) León to the north and (conservative) Granada to the south, not unlike the choice of Washington D.C. in the US between the North and the South. Even more so than Washington D.C., Managua was not a terribly propitious choice for a place to build a city, not only hot and humid, but also overly prone to earthquakes. It is doubtful that Managua would exist (certainly not in its present size) were it not for politics. The same thing can be said of Madrid – located in Spain’s arid centre - although the choice in this case goes back much further in time. Being chosen from above as the capital, no matter how unpropitious the location, almost guaranteed that a city would grow faster than average during the 20th century as governments everywhere came to absorb increasing shares of GDP, the outcome of the rising welfare state and the general strengthening of national governments. The jump up in rank of Jakarta, Rome, and Damascus7
Globalization and trade has tended, historically, to favour port cities, although the relationship has weakened since the arrival of the airplane. Besides Casablanca and Lagos, this goes a long way in explaining the presence of on table 3 of Shanghai, Guangzhou (Canton), and Durban. However, some jumps in rank are more difficult to classify and are truly sui generis. We have no evident explanation of why Bandung should have moved up six slots in the Indonesian urban hierarchy. Other cases are truly unique. The rise out of nowhere of Cuidad del Este to become Paraguay’s second city and mini-economic powerhouse is the outcome a purely artificial advantage built on
,
as well Delhi, Ankara, and Rabat (to the number two spot) are all founded on political choices from above.
6
The Nigerian capital has since been moved to the new city of Abuja, far too late, however, to upset the commercial dominance of Lagos.
7 Cities are given in italics when the progression from 1900 to 1950 to the present day is not in the same direction. Syria
19
international boundaries, free trade zones and, undoubtedly, smuggling. Meshed in Iran is a Shia holy city. The case of Santa Cruz in Bolivia is no less exceptional; its impressive rise to the number two spot (and perhaps one day the number one spot) is the reflection of a major population and correspondingly political power shift, which is threatening to tear Bolivia apart at the time of writing, another illustration that major changes at the top are often the sign of a break in the nation’s history. In Bolivia, the discovery of natural gas and the settlement by new immigrants of the eastern Lowlands – of which Santa Cruz is the hub – are challenging the nation’s very self-image as an Andean and predominantly Indian nation.
Bombay and Toronto: the indirect Effects of Political Events and Choices Political choices, we have seen, are rarely far from the surface when the top city changes. The story of Toronto and Bombay, both today the undisputed economic capitals of their respective nations, provide an interesting parallel. In neither case was it inevitable that they should today hold the number one spot. Neither held the number one spot in 1900. In both cases, they came to occupy that position because of events that occurred outside their borders or by decisions made elsewhere. In both cases, it is not so much that they gained the number one spot; but rather that others lost it. Their good fortune is - so to speak- the mirror of the misfortune of others. Calcutta was British India’s largest city and imperial capital in 1900. Had India remained united and had the city remained its capital, Calcutta might still be India’s largest city. It was the combination of three events that caused it to fall to the number three spot. First, the British Raj moved the capital to Delhi in 1911, where it has remained since. Second, the partition of Bengal in 1947, which gave rise to East Pakistan and then Bangladesh, caused Calcutta to be cut off from a good part of its natural hinterland. Third (and, admittedly, more subjective), the city’s reputation for communal strife and left-leaning local governments has made it a (comparatively) less welcoming place to do business than its rival. Whatever weight one might wish to give to these factors, the outcome has been a slide down the urban hierarchy, leaving Mumbai (Bombay) to take the number one spot.
In 1900, Montreal was Canada’s top city, and still was in 1950. Two similar circumstances caused it to concede that honour to Toronto. First, Montreal lost a good part of its natural hinterland outside the Province of Quebec as a consequence of the introduction of French as the Province’s sole official language and, increasingly, the language of business since the 1970’s. The promotion of French and the maintenance of its position as the corporate centre of a predominantly English-speaking were, in short, irreconcilable. Second, the threat of separation (of Quebec) from Canada introduced an
element of risk to doing business in Montreal. The predictable outcome of the rise of French and the threat of separation was an out-migration of much of Montreal’s English-speaking business elite and an accompanying move to Toronto of corporate headquarters and financial institutions. Toronto, in short, captured the growth that Montreal lost. The parallel between Calcutta and Montreal also drives home the role of hinterlands in determining city-size. Both lost a part of its historic commercial hinterland: East-Bengal for Calcutta and Canada outside Quebec for Montreal. In both cases that loss was the indirect result of political events rather than of predictable economic forces.
Table 4
Cities [Rank 3 to 10: population over 500,000*] that moved
up at least two slots in their respective national urban hierarchies since 1900
Urban Area Rank 1900
Rank 1950 Reversal since in italics Current Rank Explanatory Factors Settlement Shifts/ Location Natural Setting/ Sun & Surf Resources/ Technology Change Politics Conquest, Globalization & Trade Ethnic & Development Dualities Unique Event / Specific Not Sure/ Insufficient Info Agadir 12 10 5 Kaduna n/a 23 4 Benin City 14 18 5
Port Harcourt n/a 9 6
Pretoria 8 4 4 Wuhan 7 6 4 Xián 11 14 9 Shenyang 15 4 8 Chongqing 10 7 6 Bangalore 13 7 5 Poona 16 10 8 Surat 17 26 9 Gujranwala (Pak) 9 5 Fukuoka 12 7 5 Sapporo 23 9 7 Ulsan (S. Korea) n/a 23 7 Medan t.s 8 4 Makassar t.s 9 7 Davoa (Phil.) t.s 6 3 Haiphong 6 3 3 Da Nang n/a 7 4 Bilbao 8 5 5 Toulouse 9 6 5 Nice 15 10 6 Toulon 17 13 10 Köln (Cologne) 6 6 4 Frankfurt a.m. 7 9 5 Bremen 14 12 10
21 Essen 22 5 6 Dortmund 18 8 7 Stuttgart 13 11 8 Bologna 9 9 6 Bari 14 11 9 Wroclaw 7 5 Eindhoven* n/a 6 5 Leeds 7 6 4 Trujillo (Peru) 8 4 3 Belo Horizonte t.s 5 3 Porto Alegre 6 5 4 Fortaleza 12 7 7 Curitiba 11 8 9 Cali 9 4 3 Maracay (Ven.) t.s 3 4 Suez 17 6 4 Shiraz (Iran) 11 6 5 Ahvaz n/a 8 6 Qom 20 11 7 Dammam (Saudi) t.s 6 3 Vancouver 10 3 3 Calgary t.s 11 5 Edmonton t.s 8 6 US East=[EUS] San Francisco 8 7 4 Detroit [E] 12 4 5 Washington DC [E] 15 9 6 Atlanta [E] 26 17 7 Miami [E] t.s 24 8 Dallas F-W. 45 24 8 Houston 44 18 10 Monterrey 5 3 3 Toluca 20 6 5 Tijuana n/a 20 6 Perth (Australia) 8 5 4 Tweed/Gold Coast n/a 12 7 Times mentioned 24 9 18 7 10 8 11 11
* Eindhoven [NL] is included because of its special interest although its population falls below 500,000. n/ a = unknown or not available; t.s = too small or not yet in existance.
Table 5
Selected Urban Areas that moved down the Urban Hierarchy since 1900
A - Fell from the number 1 or number 2 spot since 1900* B- Other cities (continued) Urban Area Country
Rank 1900 Current Rank Change Dresden Germany 5 15 -10 Leipzig Germany 4 13 -9
Marrakech Morocco 1 4 -3 Halifax Canada 6 13 -7
Beijing China 1 3 -2 Cleveland USA 10 [9] 16[10] -6[-1]
Calcutta India 1 3 -2 Belem Brazil 5 11 -6
Cape Town
South
Africa 1 3 -2 Nürnberg Germany 8 14 -6
Ibadan Nigeria 1 3 -2 Québec City Canada 3 7 -4
Surabaya Indonesia 1 3 -2 Hamilton Canada 5 9 -4
Chicago USA 2 [2] 3[2] -1[0] San Luis Potosi Mexico 6 10 -4
Manchester UK 2 3 -1 Leon Mexico 4 7 -3
Rio de Janeiro Brazil 1 2 -1 Salvador Brazil 3 6 -3
Montreal Canada 1 2 -1 Campinas Brazil 7 10 -3
Rosario Argentina 2 3 -1 La Plata Argentina 3 6 -3
B- Other cities that fell at least two slots since 1900*
Bordeaux France 4 7 -3
Rouen France 10 13 -3
Magdeburg Germany 10 33 -23 Philadelphia USA 3 [3] 5[3] -2[0] Nagasaki Japan 6 24 -18 Boston USA 4 [4] 6[4] -2[0] Pittsburgh USA 6 22 [14] -16 [-8] Hannover Germany 9 11 -2 Cincinnati USA 9 [8] 24 [16] -15 [-8] Newcastle UK 6 8 -2 Baltimore USA 7 20 [12] -13 [-5] Tianjin China 3 5 -2 St-Louis USA 5 17[11] -12[-6] Hyderabad India 4 6 -2 Kanazawa Japan 9 20 -11 Adelaide Australia 3 5 -2
* Eastern US Urban System between brackets [ ]
Moves near the Top
Table 4 provides a similar portrait for cities that have moved up to lower spots. We have added a sixth factor, “Ethnic and Development Dualities”, to account for cases where above average city growth may in part be the reflection of cultural differences and/or a catching-up process. Kaduna in Nigeria is an example, which moved from 23rd to 4th place, a reflection undoubtedly of the North catching up with the South, starting from a much lower urbanization base. As in table 3, classes and attributions are very much a matter of judgement, open to alternative interpretations, and should be taken thus. These are soft, not hard, facts. As in the previous section, we shall sometimes refer to table 5 to aid in the understanding of what happened, since the move up of one city necessarily means that another has moved down.
23
For moves below the very top (the top two positions) explanations founded in exceptional political events loom less large. We now enter a world which brings us closer to more traditional urban growth explanations, while still leaving a large space for serendipity. Settlement shifts and location remain the most frequent factors, especially in New World countries. Outside the New World, the rise of the great interior cities of Wuhan and Chongqing can undoubtedly be traced, at least in part, to their location on the Yangtze River, China’s major internal trade corridor. By the same token, the move up of Poona in India from 16th to 8th place was undoubtedly facilitated by its proximity to Bombay as was the move up of Medan in Indonesia by its proximity to Singapore. Moving on to the second factor, the impact of the climate and sun and surf factor is essentially limited to richer nations for two reasons: cold areas (from which to flee) are less prevalent in southern nations; retirees and mobile professional populations are less frequent. In the US and Europe, climates and shorelines are among the best predictors of growth (Cheshire and Magrini 2006, Rappaport 2004, Rappaport and Sachs 2003). The impressive ascension of Nice in France or of Miami in the US needs no further explanation.
The impacts of resource endowments and technological change, the third factor, are also fairly straightforward. The ascension of Benin City in Nigeria, Calgary in Canada, Houston in the US, and Dammam in Saudi Arabia can all be traced to oil. The impact of political events (the next factor) on German rankings are not difficult to understand, where the shrinkage of German territory after two world wars, compounded by the east-west split between 1947 and 1989, has generally favoured cities in the east-western part of the nation. The comparison between Cologne and Leipzig is telling. The former moved up from 6th to the 4th spot between 1900 and today, while the latter fell from 4th to 13th place. However, even this seemingly common sense result for Germany cannot be made into a general rule as the fall in rank of Nurnberg attests.
The role of trade in the ascent of certain port cities requires little comment: Haiphong in Vietnam; Suez in Egypt; Vancouver in Canada. The latter’s growth has in addition been fuelled by the general westward population shift in the Canadian population and Vancouver’s attractive natural setting on the Pacific. The ascent of Monterrey - Mexico’s rising industrial metropolis and second financial centre - is in part a direct outcome of the growing integration of the Mexican and US economies, strategically located on the main trade corridor linking the Mexican heartland with Texas. The meteoric ascent of Tijuana is even more directly attributable to its location on the US border, across from San Diego. In Mexico, location, trade, and population shifts are closely intertwined.
Cities where an ascent has been halted or reversed (shown in italics) are often industrial cities that specialized in sectors which grew during the first part of the 20th century (steel,
automobiles…) and then declined: Shenyang in the old industrial heartland of Manchuria (China); Essen in Germany; Detroit in the US. Taking only the eastern US urban system, Detroit catapulted from 12th to 4th place between 1900 and 1950, only to fall back to 5th place since. Over the same two periods, Essen in the Ruhr zoomed from the 22nd to the 5th, to fall back to 6th place in recent times. Almost all US cities that have witnessed rank declines are Rustbelt or East Coast industrial cities, even after accounting for the east-west divide (Table 5). Industrial structure is visibly a good predictor, which comes as no surprise. However, even this cannot be made into a general rule; the fall in rank of Cincinnati is far more precipitous, for example, than that of Cleveland. Other factors are clearly also at play.
The difficulty of establishing general rules is highlighted by the number of cases we grouped under the heading “unique events/specific” and those for which we could find no evident reason why they should have moved closer to the top. The cities falling under the unique event heading are indeed a mixed bag. Bangalore, India’s rising high-tech centre was, it appears already, favoured by British administrators and educators during the colonial period because of its comparatively milder climate. Ulsan, which came out of nowhere to become South Korea’s 7th largest city, is a company town, created by a mix of central government planning and corporate strategy. Ulsan was chosen as the site where the Hyundai Chaebol would launch its industrial empire. Ulsan has remained its corporate base since. The city’s location seventy kilometres from Pusan, South Korea’s second largest city, its potential as a port, and its designation as an industrial free trade zone were undoubtedly factors in the choice of Ulsan. In France, the ascent of Toulon and of Toulouse, besides the Sunbelt factor, is also founded on strategic considerations: the first is France’s chief naval base on the Mediterranean; the second is the centre of France’s aerospace industry, chosen in part (at the time) because of its distance from possible invading armies from the east (German or Soviet). In Germany, Frankfurt’s growth is undoubtedly spurred by its role as Germany’s financial centre (now the seat of the European central bank), one of the rare cases where a nation’s financial capital is not also its largest city. Maracay in Venezuela is a truly odd case: Venezuela’s dictator from 1908 to 1935 chose it as his residence and quasi-capital, showering it with public investments, which in no small part explains its meteoric rise during the first part of the 20th century. Qom in Iran is a Shia holy city.
25
In more mature urban systems, Atlanta and Eindhoven are rare examples of cities that have come from almost nowhere to climb near the top of their respective national urban hierarchies. Eindhoven is noteworthy since it is to our knowledge the only such example in Western Europe, almost non-existent in 1900, now the Netherlands’ fifth largest city – nearing the half-million mark- and major high-tech centre with an excellent technological university. The explanation of Eindhoven’s ascent is simple and a true “accident”, the Dutch equivalent of Henry Ford being born in Detroit. Frits Philips was born on April 16th 1905 in the small town of Eindhoven, where he founded Philips, the future electronics giant. The rest is history, as the saying goes. The ascent of Atlanta is no less impressive, but of a totally different scale. Atlanta, by any measure, is today a major international metropolis, the headquarters of such emblematic corporations as CNN and Coca Cola and home to the nation’s busiest airport. But unlike Eindhoven, Atlanta’s ascent does not lend itself to a ready explanation. We scrutinized the literature and found no full explanation for Atlanta’s rapid move up, except the fairly obvious attributes of a central location in a resurgent South and the sun; but it is not a sunnier place than other cities in South. The currently favoured explanations of urban growth which focus on human capital endowments, knowledge spill-overs, urban amenities, and a Bohemian life-style (Florida 2002, Glaeser 1994, Glaeser and Gottlieb 2006) do not seem to apply to Atlanta. It would be difficult to argue that Atlanta in 1950 was reputed (or still is) for the quality of its universities and research institutions or for its avant-garde life-style. Clearly, some changes at the top are easier to explain than others.
CONCLUSION
Focusing on cities at the top of the urban hierarchy, the evolution of city ranking were examined for 74 nations since 1950 and for 52 nations since 1900. Rankings are, on the whole, fairly stable over time. Radical changes are rare. However, changes at the top do occur. Of the 52 cities currently at the top of their respective national urban hierarchies, twelve (12) were not so in 1900. As expected, changes are more frequent over longer time periods. Only six newcomers arrived at the top since 1950.
The results for Europe - which contrast with those for developing and New World nations - suggest that urban hierarchies harden at the top as settlement patterns mature and as the rural-urban transition is completed. In Europe, reversals at the very top are truly exceptional. The two cases identified (Rome overtaking Naples and Milan; Madrid overtaking Barcelona) are not extraordinary, the predictable outcomes of the growth of government during the 20th century, which naturally favours capital cities. In Western Europe, the only case of a true upstart coming out of nowhere is Eindhoven in The Netherlands, a mere village in 1900, now the nation’s fifth largest urban area and major high-tech centre. But, Eindhoven is already further down the urban hierarchy, where change is more common. Eindhoven is an example of a true “accident”, the outcome of an unforeseeable event. The founder of Philips (the electronics giant) was born there. Changes at the top are more frequent in nations in which settlement patterns are still shifting and in which the urbanization process is not yet complete. The westward shift in North America requires little comment. Nor does the shift towards the sun and the sea, aided in the 20th century by technological progress in health and sanitation (not forgetting air-conditioning), which have made previously inhospitable spaces desirable places to live. Both forces go a long way in explaining the meteoric rise of Los Angeles to the number two spot in the US, followed since by other Sunbelt cities. In developing nations, colonial conquest and subsequent integration into wider trading blocks have often acted to upset previously existing hierarchies. The ascent of Casablanca (over Fès) and Lagos (over Ibadan) are typical examples. The political choice of a capital, either by the former colonial power or as part of the nation building process, has also allowed some cities to rise to the top. Such political choices are, almost by definition, “accidents”; which do not readily lend themselves to generalization.
A general theory why newcomers have climbed to the top is not possible. National conditions are too diverse. However, our results suggest that the nature of the explanation changes as we move down the urban hierarchy. Ascents to the very top (shunting aside the former number one) are often the outcome of a major shock or change in the nation’s
destiny with political events not far below the surface. The Montreal/Toronto reversal and the Calcutta/Bombay reversal are telling examples, where the change at the top cannot be understood without reference to broader events. As one moves down the urban hierarchy, political explanations recede in importance as more traditional economic geography-based factors come into play: a favourable location (with respect to emerging trade relationships, for example); a good climate (sun a surf); a rich resource endowment (oil today, coal in the past). But, explanations linked to unique events or conditions are never far from the surface, with numerous cases for which no readily available explanation was found of why a city moved up the urban hierarchy.
The closest thing to a general explanation is the observation that moves to the top are rarely the outcome of events that happened in the city or the result of local policy choices. Moves to the top are most often the product of events that occurred at another level, be they technological or international, or by choices made “from above” by national governments (or state governments in federations). This brings to mind the following quote from Glaeser (2000: 94): “While we do not know what policies a city can follow to increase its growth, we do that if states and the country as a whole favor particular cities they will grow”. This is not necessarily something local economic development strategists like to hear. It does however suggest that as much energy should be devoted to lobbying higher-tier governments and influencing national (or state) policies as to purely local strategies.
REFERENCES
Black, D. et V. Henderson. 1999. "Spatial evolution of population and industry in the United States" American Economic Review, vol. 89, no 2, p. 321-327.
Bosker, M., S. Brakman, H. Garretsen et M. Schramm. 2008. "A century of shocks: the evolution of the German city size distribution 1925-1999 " Regional Science and Urban Economics, vol. 38, p. 330-347.
Braudel, F. 1979. Civilisation matérielle, économie et capitalisme : 3- Le temps du monde, Armand Colin, Paris.
Brakman, S., H. Garretsen et M. Schramm. 2004. "The strategic bombing of German cities during World War II and its impact on city growth" Journal of Economic Geography, vol 4, no 2, p. 201-218.
Chandler T. et G. Fox. 1974. 3000 Years of Urban Growth, Academic Press, New York.
Cheshire, P. C. et S. Magrini. 2006. "Population growth in european cities: weather matters – but only nationally" Regional Studies, vol. 40, no 1, p. 23-37.
Córdoba, J. C. 2008. "On the distribution of city sizes" Journal of Urban Economics, vol. 63, p. 177-197.
Davis, R. D. et D. E. Weinstein. 2002. "Bones, bombs, and break points: the geography of economic activity", American Economic Review, vol. 92, no 5, p. 1269-1289.
Desmet, K. et M. Fafchamps.2005. "Changes in the spatial concentration of employment across US counties: a sectoral analysis: 1972-2000", Journal of Economic Geography vol. 5, p. 261-284.
Eaton J. et Z. Eckstein. 1997. "Cities and growth: theory and evidence from France and Japan" Regional Science and Urban Economics, vol. 27, p. 701-731.
Eeckhout, J. 2004. "Gibrat’s Law for (All) Cities" American Economic Review, vol. 94, no 5, p. 1429-1451.
Florida, R. 2002. The Rise of the Creative Class, Basic Books: New York.
Gabaix, X. 1999. "Zipf’s law for cities: an explanation" Quarterly Journal of Economics, vol. 114, p. 739-767.
Glaeser, E. 2000. "The new economics of urban and regional growth" in G. Clark, M. Feldman, et M. Gertler (eds.) The Oxford Handbook of Economic Geography, Oxford University Press, Oxford.
Glaeser, E. 1994. "Cities, Information, and economic growth". Cityscape, vol. 1, no 1, p. 9-77. Glaeser, E. et J. Gottlieb.2006. "Urban resurgence and the consumer city* Urban Studies, vol. 43,
no 8, p. 1275-1299.
Guérin-Pace, F. 1995. "Rank-size distribution and the process of urban growth". Urban Studies, vol. 32, no 1, p. 551-562.
Henderson, V. 1997. "Medium sized cities", Regional Science and Urban Economics, vol. 27, p. 583-612.
Ioannides, Y. et H. G. Overman. 2003. "Zipf’s Law for Cities: an empirical examination", Regional
Science and Urban Economics, vol. 33, no 2, p. 127–137.
Krugman, P. 1991. "Increasing returns and economic geography". Journal of Political Economy, vol. 99, no 3, p. 483-499.
Krugman, P. 1995. Development, Geography, and Economic Theory, M.I.T. Press, Cambridge, MA.
Moriconi-Ebrard, F. E. 1994. Geopolis, pour comparer les villes du monde Paris, Anthropos. Polèse, M. et R. Shearmur. 2004. "Culture, language and the location of high-order service
functions: the Case of Montreal and Toronto" Economic Geography, vol. 80, no 4, p. 329-350. Polèse, M. et R. Shearmur. 2006. "Growth and location of economic activity: the spatial dynamics
of industries in Canada 1971-2001" Growth and Change, vol. 37, p. 3362-395.
Rappaport J. 2004. "Moving to nice weather", Research Working Paper 03-07 Federal Reserve Bank of Kansas City.
Rappaport J. et S. Sachs. 2003. "The United States as a coastal nation", Journal of Economic Growth, vol. 8, p. 5-46.
Rodríguez-Pose, A. et J. Sánchez-Reaza. 2005. "Economic polarization thrrough trade: trade liberalization and regional inequality in Mexico" in Kanbur and Venables op cit.
Romer, P. 1986. "Increasing returns and long-run growth". Journal of Political Economy, vol. 94, p. 1002-1037.
Rosen, K.T. et M. Resnick. 1980. "The size distribution of cities: an examination of the Pareto Law and Primacy", Journal of Urban Economics, vol. 8, p. 165-86.
Sharma, S. 2003. "Persistence and stability in city growth". Journal of Urban Economics, vol. 53, p. 300-320.