HAL Id: hal-01297363
https://hal.sorbonne-universite.fr/hal-01297363
Submitted on 4 Apr 2016
HAL is a multi-disciplinary open access
archive for the deposit and dissemination of sci-entific research documents, whether they are pub-lished or not. The documents may come from teaching and research institutions in France or abroad, or from public or private research centers.
L’archive ouverte pluridisciplinaire HAL, est destinée au dépôt et à la diffusion de documents scientifiques de niveau recherche, publiés ou non, émanant des établissements d’enseignement et de recherche français ou étrangers, des laboratoires publics ou privés.
J.H. Salmon, A.C. Rat, J. Sellam, M. Michel, J.P. Eschard, Francis Guillemin,
D. Jolly, Bruno Fautrel
To cite this version:
J.H. Salmon, A.C. Rat, J. Sellam, M. Michel, J.P. Eschard, et al.. Economic impact of lower-limb osteoarthritis worldwide: a systematic review of cost-of-illness studies. Osteoarthritis and Cartilage, Elsevier, 2016, 24 (9), pp.1500-1508. �10.1016/j.joca.2016.03.012�. �hal-01297363�
M
AN
US
CR
IP
T
AC
CE
PT
ED
Economic impact of lower-limb osteoarthritis worldwide: A systematic
review of cost-of-illness studies
JH Salmon1,2, AC Rat3,4, J Sellam5, M Michel1, JP Eschard1, F Guillemin4, D Jolly2,6, B Fautrel7
1
Rheumatology Department, Maison Blanche Hospital, Reims University Hospitals, Reims, F-51092, France.
2
University of Reims Champagne-Ardenne, Faculty of Medicine, EA 3797, REIMS, F-51095, France.
3
Rheumatology Department, CHU de Nancy, Hôpitaux de Brabois, Vandoeuvre-lès-Nancy, France.
4
Université de Lorraine, Université Paris Descartes, Apemac, EA4360, 54000 Nancy, France; INSERM, CIC-EC 1433, 54000 Nancy, France.
5
Rheumatology Department, Saint-Antoine Hospital, Inserm UMR S_938, Sorbonne Universités UPMC Univ Paris 06, Assistance Publique - Hôpitaux de Paris (AP-HP), DHU i2B, Paris, France.
6
Department of Research and Innovation, Robert Debré Hospital, Reims University Hospitals, Reims, F-51092, France.
7
Rheumatology Department, Université Pierre et Marie Curie Curie - Paris 6, GRC08, Institut Pierre Louis de d'Epidémiologie et Santé Publique, Pitié-Salpêtrière Hospital, 47-83 Boulevard de l'Hôpital, 75013, Paris, France.
jhsalmon@chu-reims.fr, ac.rat@chu-nancy.fr, jeremie.sellam@sat.aphp.fr, mmichel@chu-reims.fr, jpeschard@chu-reims.fr, francis.guillemin@chu-nancy.fr, djolly@chu-reims.fr, bruno.fautrel@psl.aphp.fr
Correspondence and reprint requests to: Pr Bruno FAUTREL, Service de Rhumatologie,
Groupe Hospitalier Pitié-Salpêtrière, 83 boulevard de l'Hôpital, 75651 Paris cedex 13. Tel: +33 1 421 77801, Fax: +33 1 421 77802. Email: bruno.fautrel@psl.aphp.fr.
M
AN
US
CR
IP
T
AC
CE
PT
ED
IntroductionMany studies have explored the economic burden of rheumatic diseases, mainly inflammatory arthritides and musculoskeletal disorders such as back problems (1–3). OA is the most frequent or prevalent chronic joint disease and a major contributor to functional disability and loss of autonomy in older adults (4). According to the World Health Organization in 2010, among 289 diseases, OA has become the 11th leading cause of years lived with disability, an increase from 16th to 11th within only 10 years (5). Moreover, OA has become a research priority in the European Community (Horizon 2020 Framework Programme) (6).
For a long time, OA, corresponding to a whole-joint disease involving cartilage, subchondral bone and synovium, was considered only a consequence of aging (7). Hip and knee OA causes the greatest burden to the population in terms of pain, stiffness and disability, thereby leading to the need for prosthetic joint replacement for the most severe cases (8). The disease may have various personal, social and economic consequences for patients, their environment and society: reduced productivity or premature exit from the workplace, autonomy loss, need for help, as well as increased healthcare use and sometimes institutionalization (9).
OA prevalence is expected to increase because of several concomitant factors: population growth and aging due to increasing life expectancy, increased overweight and obesity prevalence, and lack of disease-modifying OA drugs able to modify the progression of the disease. Thus, the burden to society is expected to increase substantially, at least for hip or knee replacement surgery (10). In addition, OA prevalence could result in increased cardiovascular morbidity as an indirect consequence of reduced physical activity and increased need for nursing home facilities for the elderly population (11).
The economic consequences of OA need to be investigated, especially those related to hip and knee OA. The present study aimed to provide, via a systematic review of the literature, an
M
AN
US
CR
IP
T
AC
CE
PT
ED
overview of the economic consequences – overall costs as well as cost breakdown – of hip and knee OA worldwide.
M
AN
US
CR
IP
T
AC
CE
PT
ED
MethodsResearch question and literature search
We performed a systematic search of articles in EMBASE, MEDLINE via PubMed, Scopus and Cochrane databases across the period from 1966 to December 2014. We used the Participants, Interventions, Comparisons and Outcomes (PICO) strategy for the research question as follows: population, OA; intervention, analysis of costs of illness; control, different treatments and no treatment OA; and outcome, direct and indirect costs (12). The algorithm used to search article titles, abstracts and key words in EMBASE, MEDLINE and Scopus was ("Osteoarthritis"[Mesh]) AND "Cost of Illness"[Mesh]), (Direct cost AND Osteoarthritis), (Indirect cost AND Osteoarthritis). To optimize our research, we used only one keyword, “osteoarthritis,” in the search equation for the Cochrane database.
Article selection
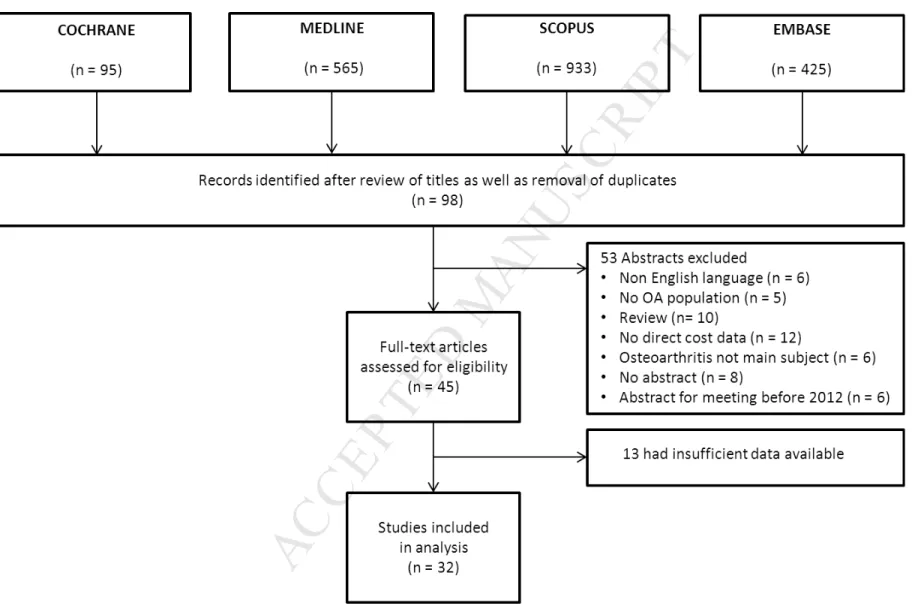
The titles and abstracts of all articles identified were independently screened by 2 rheumatologists (JHS and MM) who used predefined criteria to identify relevant articles; disagreements were resolved by consensus. Articles without an abstract and those in non-English or -French languages were excluded (Figure 1). Abstracts were excluded if 1) OA was not the main subject, 2) no cost data were reported, 3) no primary data were reported (e.g., literature review), 4) data focused only on surgical procedures, and 5) the abstract was from a society meeting before 2012. The full texts of the remaining articles were then retrieved. We excluded articles that had insufficient, imprecise or incomplete data (e.g., indirect costs only, lack of direct cost breakdown).
M
AN
US
CR
IP
T
AC
CE
PT
ED
Data extractionData extracted were the database (insurance- or clinic-based), sample size (population-based or worker sample) and country of the study; patient demographics (gender, occupation profile [i.e., workers only or not]); and disease characteristics (OA definition [i.e., self-reported or based on American College of Rheumatology (ACR) criteria (13,14)], involved joints, clinical expression and symptom intensity, radiologic features and Kellgren & Lawrence stage).
Costs
All costs were extracted from articles that described assessing them from a payer or societal perspective. Direct costs included medical doctor (MD) visits; hospitalizations, including emergency room visits, imaging or biologic work-up; treatment costs that were drug-related or not; joint replacement surgery; and complementary and alternative medicine use (acupuncturist, herbalist, and osteopathy). In addition, non-medical costs (transport, auxiliary devices and temporary caregivers) were included when available. Indirect costs included all types of productivity loss: temporary or long-term sick leave as well as disability status. Total costs were the sum of direct and indirect costs. With incomplete data, the corresponding author of the article was contacted by email to collect additional relevant information.
Extracted or elicited costs were converted to an annual cost and to 2013 euros (€) by using the Consumer Price Index of the relevant countries and the 2013 Purchasing Power Parities (Organization for Economic Cooperation and Development, www.oecd.org) between these countries and the European Union average (15).
Statistics
Costs are presented as mean ± SD and 95% confidence interval (95% CI). Direct and indirect costs per patient per year were summarized separately across studies and countries. Average
M
AN
US
CR
IP
T
AC
CE
PT
ED
costs were weighted by study sample size and were used to calculate the overall mean annual costs induced by hip or knee OA.
M
AN
US
CR
IP
T
AC
CE
PT
ED
Results Literature searchWe obtained 98 article titles with abstracts through the meta-search, and 45 abstracts were selected. The assessment of full texts resulted in 32 articles selected for the review (Figure 1) (16–47).
Selected studies
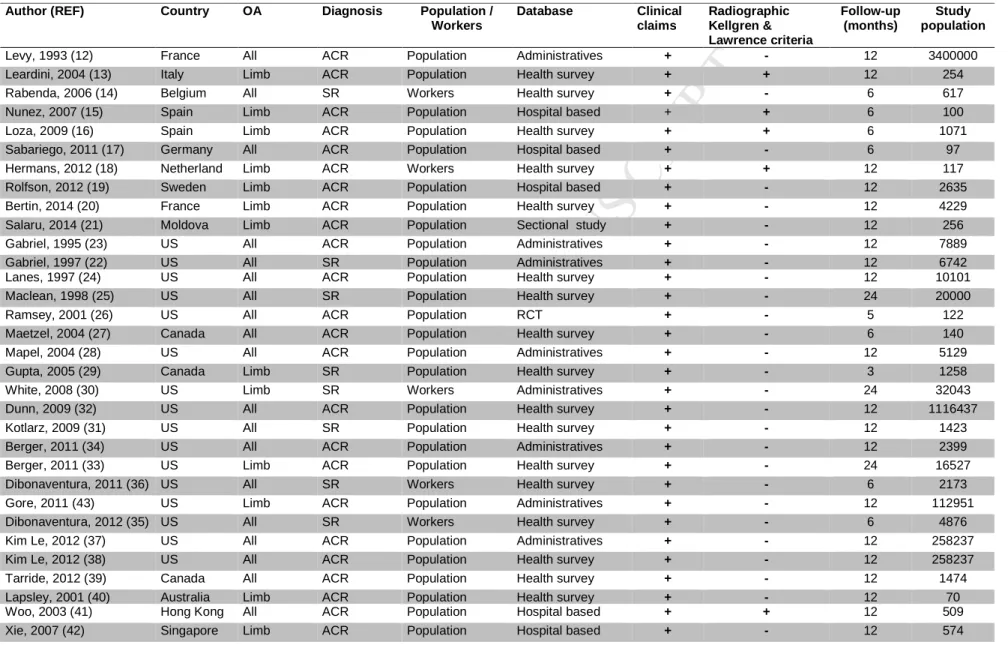
The 32 articles were heterogeneous (Table 1). Data sources were national surveys (n=18), insurance or administrative databases (n=8), convenience sample from hospital-based cohorts (n=5) or a randomized clinical trial (n=1). Sample sizes varied from 70 to 3,400,000. Seventeen studies focused on the presence of comorbidities in OA patients. Studies were conducted in North America (n=19), Europe (n=10), and Australasia (n=3). Periods of publication were 1995-2000 (n=5), 2000-2005 (n=6), 2005-2010 (n=8), and after 2010 (n=13).
OA characteristics
Most of the articles (n=27) included all types of OA patients, without restriction on age, gender or occupation; 5 focused on workers (< 65 years old). The diagnosis of OA was reported by the patient (n=8) or based on ACR criteria (n=24). In these latter articles, only 5 included radiographic data to assess OA severity based on Kellgren & Lawrence stage. The median patient follow-up was 12 months (interquartile range [IQR] 6–12).
A total of 19 articles estimated the overall OA economic burden without separating OA subtypes (upper limb, lower-limb and spine): 9 reported on only lower-limb OA (knee and/or hip OA) and 4 on general OA, with most lower-limb OA (> 50% [28,46,47] and > 60% [34]). Among these 13 latter articles, the mean age was reported in 9: mean 57 ± 9 years or median 65.8 years (IQR 56.9–69.2). All articles described symptomatic OA patients.
M
AN
US
CR
IP
T
AC
CE
PT
ED
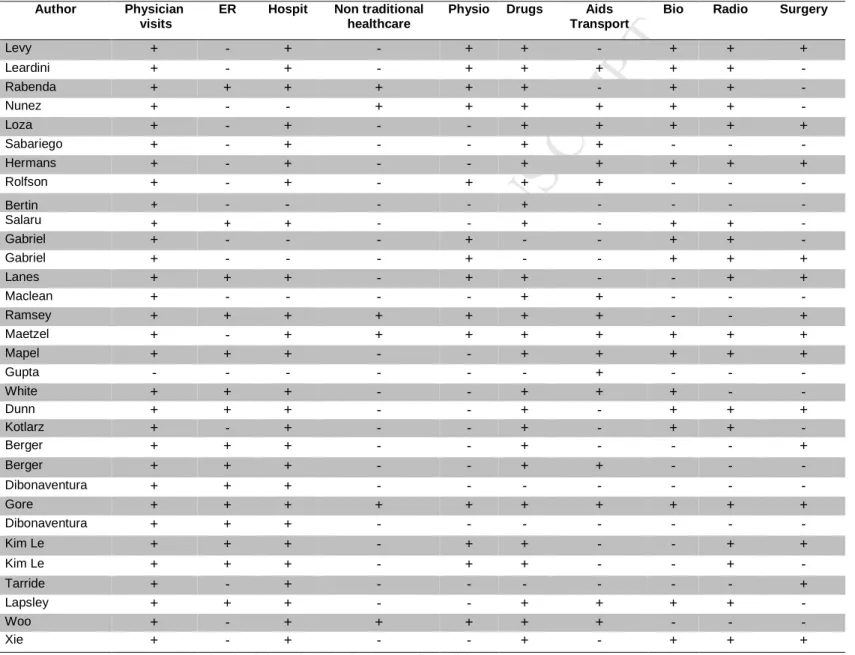
Cost structureOverall, 31 articles reported annual direct costs per patient with OA. The reported direct cost categories varied (Table 2). Only 16 articles reported indirect costs. Only 4 studies explicitly stated that the human capital approach had been used to estimate the indirect costs of OA (17,25,45,48,49). Absenteeism was reported in 14 articles, and only 2 described absenteeism and presenteism according to the method of Lofland et al. (39,40,50).
Cost estimates for all OA
The supplemental table provides a summary of mean annual direct costs per patient (in 2013 €). The annual total cost per patient varied from 0.3 to 19.5 k€/year, direct cost per patient from 0.2 to 15.3 k€/year and indirect cost per patient from 0.05 to 9.4 k€/year. The weighted average annual costs per patient were 0.35, 2.4 and 0.06 k€/year for total, direct and indirect costs, respectively. The study by Levy et al. represented a significant weight because of the number of patients (3,400,000) and was an outlier in terms of cost estimates (16), which were far lower than those of other studies. This justified a sensitivity analysis excluding this study to explore the stability of our cost estimates. Consequently, a specific sensitivity analysis was conducted with removal of this paper: the weighted average annual costs per patient were then 8.5, 6.7 and 5.4 k€/year for total, direct and indirect costs, respectively.
Cost estimates for hip and knee OA
Table 3 provides a summary of mean annual direct costs per patient (in 2013 €). After adjustment to 2013 €, annual total costs per patient varied from 0.7 to 12 k€/year, direct costs per patient from 0.5 to 10.9 k€/year and indirect costs per patient from 0.2 to 12.3 k€/year. The weighted average annual costs per patient were 11.1 k€/year, 9.5 k€/year and 4.4 k€/year
M
AN
US
CR
IP
T
AC
CE
PT
ED
for total, direct (Figure 2a) and indirect costs (Figure 2b), respectively. A sensitivity analysis was conducted because of the substantial weight of the study by Gore et al. (number of patients 112,951) (47). The weighted average annual direct cost without the Gore et al. study decreased from 9.5 to 6.8 k€/year (Figure 2a). Direct costs varied according to consideration of surgery. In fact, the weighted average annual direct costs per patient in populations without surgery, with surgery or awaiting surgery were 6.7, 10.8 (3 k€/year without Gore et al.) and 7.4 k€/year, respectively. The impact of the design of the study on costs was important: the weighted average annual total cost per patient was 10 k€/year for hospital-based cohorts (direct cost 2.1 k€/year and indirect cost 5.5 k€/year); 12 k€ for administrative databases (direct cost 10.2 k€/year and indirect cost 4.2 k€/year) and 6.8 k€/year for national surveys (direct cost 6.2 k€/year and indirect cost 6.4 k€/year).
M
AN
US
CR
IP
T
AC
CE
PT
ED
DiscussionWe performed a systematic review of the literature of the economic consequences – overall costs as well as cost breakdown (direct and indirect) – of hip and knee OA worldwide. Depending on the database and the diagnosis, OA articles reported different cost estimates for the disease, with a multiplication factor of 22-fold (hip and knee OA) and 65-fold (all OA) between the lowest and highest estimate. We found a gradient depending on the continent: direct costs in North America were 6.7 k€/year for all OA and 10 k€/year for hip and knee OA. In Europe, direct costs were 0.7 k€/year and 1 k€/year respectively. This situation can be explained by the higher frequency of obesity and related comorbidities in the United States than in European countries (51).
This is the first systematic review of the literature to specifically focus on the costs of hip and knee OA, which are a major contributor to global disability-adjusted life years (5). Puig-Junoy J et al reported recent data on hip and knee osteoarthritis costs (52). However, this paper was a literature review on the cost of osteoarthritis in general, as opposed to a focus on hip and knee osteoarthritis costs in our review. Moreover we have included four new articles (23-25,44). The burden to society is expected to be high (prevalence of 10% to 20%) because of the prevalence of symptomatic disease (53–59). The costs induced could be as high as 408 to 817 billion €/year and 350 to 700 billion €/year for total and direct costs, respectively, in Europe (59).
Our review highlights the substantial heterogeneity in how the cost of OA has been estimated over the world during the last decades. Several sources of heterogeneity could be mentioned and taken into account when interpreting the results of this review. Variable definitions of hip and knee OA have been used – clinical, radiological or both (53) Most studies included symptomatic OA patients and only 5 included patients with a diagnosis by radiographic criteria. OA diagnosis was based on ACR criteria (13,14) or sometimes only on self-reported
M
AN
US
CR
IP
T
AC
CE
PT
ED
information, which is known to feature inadequate sensitivity or specificity as compared with clinical examination for ascertainment (60). Actually, from a public health perspective, a diagnosis based on both clinical and radiological features is recommended (53). In addition, some authors recently suggested separating OA by phenotypes, reflecting different risk factors, comorbidities and potentially pathogenic pathways (7,61). Comorbidities such as obesity are closely related with lower-limb OA (62).
We could not assess this new “view” of OA because the reviewed articles did not provide enough details on medical history or comorbidities. However, integrating these phenotypic specificities in future epidemiological and economic analyses will be interesting; such phenotypes could have substantial impact on both functional outcome (health resource use) and loss of autonomy (due to comorbidities), thereby resulting in major differences in cost estimates (34,37,47).
As another source of heterogeneity, the patient selection method could have affected the results and led to selection bias or recruitment. Populations studied from administrative, hospital and national health survey databases could be substantially different, which questions the external validity of the results. In the same way, different countries or continents are represented by totally different health systems and cultural or genetic backgrounds, which may affect health resource use and productivity loss (48). The characteristics of OA and the severity of structural damage contribute to the heterogeneity. However, these data are often difficult to assess.
Finally, although some methodological consensus has been reached to determine the reference case for economic assessment in rheumatic diseases (63,64), we lack standardized methods for homogeneous estimates of the economic burden of such diseases. Some costs such as physiotherapy, emergency room visits, and complementary and alternative medicine use are not systematically included in direct cost estimates. Yet, the rates of use and expenditures for
M
AN
US
CR
IP
T
AC
CE
PT
ED
alternative therapies by adults with OA were high and can underestimate direct costs (30). Only 4/13 articles of hip and knee OA included surgery in direct costs, even though joint surgery is considered an important cost driver in hip and knee OA (65) because of the costs of the procedure and the increasing use of knee and hip replacement in the recent and coming years (66,67). This trend could result in a four-fold demand for knee arthroplasty in OECD countries by 2030 (68). There are substantial variations in total hip replacement and total knee replacement implant costs within and across hospitals. For example, the average implant cost per case ranged from $1797 to $12,093 for knee and from $2392 to $12,651 for hip (69). These differences can be explained by socio-economic determinants and physician prescription patterns, with countries with higher medical expenditures and obesity prevalence having significantly higher utilization rates (68). Substantial costs associated with total joint replacement can be balanced by their expected benefits in the medium or long-term; however, their incremental cost effectiveness ratio varies greatly depending on the studies, ranging from $1026 to 28 100/QALY (70). Out-of-pocket costs may be sometimes substantial (35,71). In addition, costs incurred for caregivers may be included, but only one article provided estimated caregiver costs related to OA (33).Finally, the method commonly used to estimate indirect costs of OA was the human capital approach (17,25,45,48), which often maximizes indirect costs as compared with the friction cost method and induces larger variations in the magnitude of indirect costs estimated (72). All these elements contribute to the difficulty in providing a clear idea of the costs due to OA (37,47).
Conclusions
Despite unstable estimates due to methodological issues in articles, this review confirmed that hip and knee OA induces substantial costs to society. With the aging of the population and the increasing prevalence of obesity in many developed countries, the economic burden of
lower-M
AN
US
CR
IP
T
AC
CE
PT
ED
limb OA could be even higher in the coming years (5). Hence, the disease is considered a public health problem and should be a research priority (6). Additional studies are needed to better assess the economic consequences of OA, especially with long-term studies, taking into account disease phenotypes and multimorbidity.
Authors’ contributions: The design of the study was conceived by JHS, BF, and DJ. Data
collection, management and analysis were performed by JHS and BF. All authors participated in the interpretation of the results and manuscript writing. All have read and approved the final version of the manuscript for publication.
Funding: None
M
AN
US
CR
IP
T
AC
CE
PT
ED
References1. Badley EM. The economic burden of musculoskeletal disorders in Canada is similar to that for cancer, and may be higher. J Rheumatol. févr 1995;22(2):204‑6.
2. Fautrel B, Guillemin F. Cost of illness studies in rheumatic diseases. Curr Opin Rheumatol. mars 2002;14(2):121‑6.
3. Smith E, Hoy DG, Cross M, Vos T, Naghavi M, Buchbinder R, et al. The global burden of other musculoskeletal disorders: estimates from the Global Burden of Disease 2010 study. Ann Rheum Dis. août 2014;73(8):1462‑9.
4. Felson DT, Zhang Y, Hannan MT, Naimark A, Weissman BN, Aliabadi P, et al. The incidence and natural history of knee osteoarthritis in the elderly. The Framingham
Osteoarthritis Study. Arthritis Rheum. oct 1995;38(10):1500‑5.
5. Vos T, Flaxman AD, Naghavi M, Lozano R, Michaud C, Ezzati M, et al. Years lived with disability (YLDs) for 1160 sequelae of 289 diseases and injuries 1990-2010: a systematic analysis for the Global Burden of Disease Study 2010. Lancet. 15 déc 2012;380(9859):2163‑
96.
6. Horizon 2020 - European Commission [Internet]. Horizon 2020. [cité 13 avr 2015]. Disponible sur: http://ec.europa.eu/programmes/horizon2020/
7. Bijlsma JWJ, Berenbaum F, Lafeber FPJG. Osteoarthritis: an update with relevance for clinical practice. Lancet. 18 juin 2011;377(9783):2115‑26.
8. Litwic A, Edwards MH, Dennison EM, Cooper C. Epidemiology and burden of osteoarthritis. Br Med Bull. 2013;105:185‑99.
9. Brooks PM. Impact of osteoarthritis on individuals and society: how much disability? Social consequences and health economic implications. Curr Opin Rheumatol. sept
2002;14(5):573‑7.
10. Nemes S, Gordon M, Rogmark C, Rolfson O. Projections of total hip replacement in Sweden from 2013 to 2030. Acta Orthop. juin 2014;85(3):238‑43.
11. Bähler C, Huber CA, Brüngger B, Reich O. Multimorbidity, health care utilization and costs in an elderly community-dwelling population: a claims data based observational study. BMC Health Serv Res. 2015;15(1):23.
12. PICO ontology | Cochrane Linked Data (beta) [Internet]. [cité 3 sept 2015]. Disponible sur: http://linkeddata.cochrane.org/pico-ontology
13. Altman R, Alarcón G, Appelrouth D, Bloch D, Borenstein D, Brandt K, et al. The American College of Rheumatology criteria for the classification and reporting of osteoarthritis of the hip. Arthritis Rheum. mai 1991;34(5):505‑14.
14. Altman R, Asch E, Bloch D, Bole G, Borenstein D, Brandt K, et al. Development of criteria for the classification and reporting of osteoarthritis. Classification of osteoarthritis of the knee. Diagnostic and Therapeutic Criteria Committee of the American Rheumatism Association. Arthritis Rheum. août 1986;29(8):1039‑49.
15. Consumer Prices (MEI) [Internet]. [cité 13 avr 2015]. Disponible sur: http://stats.oecd.org/Index.aspx?DatasetCode=MEI_PRICES
16. Levy E, Ferme A, Perocheau D, Bono I. [Socioeconomic costs of osteoarthritis in France]. Rev Rhum Ed Fr 1993. juill 1993;60(6 Pt 2):63S ‑ 67S.
17. Leardini G, Salaffi F, Caporali R, Canesi B, Rovati L, Montanelli R, et al. Direct and indirect costs of osteoarthritis of the knee. Clin Exp Rheumatol. déc 2004;22(6):699‑706.
18. Rabenda V, Manette C, Lemmens R, Mariani A-M, Struvay N, Reginster J-Y. Direct and indirect costs attributable to osteoarthritis in active subjects. J Rheumatol. juin
M
AN
US
CR
IP
T
AC
CE
PT
ED
19. Núñez M, Núñez E, Segur JM, Maculé F, Sanchez A, Hernández MV, et al. Health-related quality of life and costs in patients with osteoarthritis on waiting list for total knee replacement. Osteoarthr Cartil OARS Osteoarthr Res Soc. mars 2007;15(3):258‑65.
20. Loza E, Lopez-Gomez JM, Abasolo L, Maese J, Carmona L, Batlle-Gualda E, et al. Economic burden of knee and hip osteoarthritis in Spain. Arthritis Rheum. 15 févr
2009;61(2):158‑65.
21. Sabariego C, Brach M, Stucki G. Determinants of major direct medical cost categories among patients with osteoporosis, osteoarthritis, back pain or fibromyalgia undergoing outpatient rehabilitation. J Rehabil Med. juill 2011;43(8):703‑8.
22. Hermans J, Koopmanschap MA, Bierma-Zeinstra SMA, van Linge JH, Verhaar JAN, Reijman M, et al. Productivity costs and medical costs among working patients with knee osteoarthritis. Arthritis Care Res. juin 2012;64(6):853‑61.
23. Rolfson O, Ström O, Kärrholm J, Malchau H, Garellick G. Costs related to hip disease in patients eligible for total hip arthroplasty. J Arthroplasty. août 2012;27(7):1261‑6.
24. Bertin P, Rannou F, Grange L, Dachicourt J-N, Bruel P, Emery C, et al. Annual Cost of Patients with Osteoarthritis of the Hip and Knee in France. J Musculoskelet Pain. 18 juill 2014;22(4):356‑64.
25. Salaru V, Mazur-Nicorici L, Revenco N, Lozan O, Sadovici V, Mazur M. SAT0452 Direct and Indirect Costs of Osteoarthritis the Republic of Moldova. Ann Rheum Dis. 1 juin 2014;73(Suppl 2):757‑757.
26. Gabriel SE, Crowson CS, Campion ME, O’Fallon WM. Direct medical costs unique to people with arthritis. J Rheumatol. avr 1997;24(4):719‑25.
27. Gabriel SE, Crowson CS, O’Fallon WM. Costs of osteoarthritis: estimates from a geographically defined population. J Rheumatol Suppl. févr 1995;43:23‑5.
28. Lanes SF, Lanza LL, Radensky PW, Yood RA, Meenan RF, Walker AM, et al. Resource utilization and cost of care for rheumatoid arthritis and osteoarthritis in a managed care setting: the importance of drug and surgery costs. Arthritis Rheum. août 1997;40(8):1475
‑81.
29. MacLean CH, Knight K, Paulus H, Brook RH, Shekelle PG. Costs attributable to osteoarthritis. J Rheumatol. nov 1998;25(11):2213‑8.
30. Ramsey SD, Spencer AC, Topolski TD, Belza B, Patrick DL. Use of alternative therapies by older adults with osteoarthritis. Arthritis Rheum. juin 2001;45(3):222‑7.
31. Maetzel A, Li LC, Pencharz J, Tomlinson G, Bombardier C, Community Hypertension and Arthritis Project Study Team. The economic burden associated with osteoarthritis,
rheumatoid arthritis, and hypertension: a comparative study. Ann Rheum Dis. avr 2004;63(4):395‑401.
32. Mapel DW, Shainline M, Paez K, Gunter M. Hospital, pharmacy, and outpatient costs for osteoarthritis and chronic back pain. J Rheumatol. mars 2004;31(3):573‑83.
33. Gupta S, Hawker GA, Laporte A, Croxford R, Coyte PC. The economic burden of disabling hip and knee osteoarthritis (OA) from the perspective of individuals living with this condition. Rheumatol Oxf Engl. déc 2005;44(12):1531‑7.
34. White AG, Birnbaum HG, Janagap C, Buteau S, Schein J. Direct and indirect costs of pain therapy for osteoarthritis in an insured population in the United States. J Occup Environ Med Am Coll Occup Environ Med. sept 2008;50(9):998‑1005.
35. Kotlarz H, Gunnarsson CL, Fang H, Rizzo JA. Insurer and out-of-pocket costs of osteoarthritis in the US: evidence from national survey data. Arthritis Rheum. déc 2009;60(12):3546‑53.
M
AN
US
CR
IP
T
AC
CE
PT
ED
36. Dunn JD, Pill MW. A claims-based view of health care charges and utilization for commercially insured patients with osteoarthritis. Manag Care Langhorne Pa. déc
2009;18(12):44‑50.
37. Berger A, Bozic K, Stacey B, Edelsberg J, Sadosky A, Oster G. Patterns of pharmacotherapy and health care utilization and costs prior to total hip or total knee replacement in patients with osteoarthritis. Arthritis Rheum. août 2011;63(8):2268‑75.
38. Berger A, Hartrick C, Edelsberg J, Sadosky A, Oster G. Direct and indirect economic costs among private-sector employees with osteoarthritis. J Occup Environ Med Am Coll Occup Environ Med. nov 2011;53(11):1228‑35.
39. Dibonaventura MD, Gupta S, McDonald M, Sadosky A, Pettitt D, Silverman S. Impact of self-rated osteoarthritis severity in an employed population: cross-sectional analysis of data from the national health and wellness survey. Health Qual Life Outcomes. 2012;10:30. 40. Dibonaventura M dacosta, Gupta S, McDonald M, Sadosky A. Evaluating the health and economic impact of osteoarthritis pain in the workforce: results from the National Health and Wellness Survey. BMC Musculoskelet Disord. 2011;12:83.
41. Le TK, Montejano LB, Cao Z, Zhao Y, Ang D. Health care costs in US patients with and without a diagnosis of osteoarthritis. J Pain Res. 2012;5:23‑30.
42. Le TK, Montejano LB, Cao Z, Zhao Y, Ang D. Healthcare costs associated with osteoarthritis in US patients. Pain Pract Off J World Inst Pain. nov 2012;12(8):633‑40.
43. Tarride J-E, Haq M, O’Reilly DJ, Bowen JM, Xie F, Dolovich L, et al. The excess burden of osteoarthritis in the province of Ontario, Canada. Arthritis Rheum. avr
2012;64(4):1153‑61.
44. Lapsley HM, March LM, Tribe KL, Cross MJ, Brooks PM. Living with osteoarthritis: patient expenditures, health status, and social impact. Arthritis Rheum. juin 2001;45(3):301‑6.
45. Woo J, Lau E, Lau CS, Lee P, Zhang J, Kwok T, et al. Socioeconomic impact of osteoarthritis in Hong Kong: utilization of health and social services, and direct and indirect costs. Arthritis Rheum. 15 août 2003;49(4):526‑34.
46. Xie F, Thumboo J, Fong K-Y, Lo N-N, Yeo S-J, Yang K-Y, et al. Direct and indirect costs of osteoarthritis in Singapore: a comparative study among multiethnic Asian patients with osteoarthritis. J Rheumatol. janv 2007;34(1):165‑71.
47. Gore M, Tai K-S, Sadosky A, Leslie D, Stacey BR. Clinical comorbidities, treatment patterns, and direct medical costs of patients with osteoarthritis in usual care: a retrospective claims database analysis. J Med Econ. 2011;14(4):497‑507.
48. Xie F, Thumboo J, Fong K-Y, Lo N-N, Yeo S-J, Yang K-Y, et al. Direct and indirect costs of osteoarthritis in Singapore: a comparative study among multiethnic Asian patients with osteoarthritis. J Rheumatol. janv 2007;34(1):165‑71.
49. Koopmanschap MA, Rutten FF. Indirect costs in economic studies: confronting the confusion. PharmacoEconomics. déc 1993;4(6):446‑54.
50. Lofland JH, Pizzi L, Frick KD. A review of health-related workplace productivity loss instruments. PharmacoEconomics. 2004;22(3):165‑84.
51. Ng M, Fleming T, Robinson M, Thomson B, Graetz N, Margono C, et al. Global, regional, and national prevalence of overweight and obesity in children and adults during 1980-2013: a systematic analysis for the Global Burden of Disease Study 2013. Lancet Lond Engl. 30 août 2014;384(9945):766‑81.
52. Puig-Junoy J, Ruiz Zamora A. Socio-economic costs of osteoarthritis: a systematic review of cost-of-illness studies. Semin Arthritis Rheum. avr 2015;44(5):531‑41.
M
AN
US
CR
IP
T
AC
CE
PT
ED
53. Guillemin F, Rat AC, Mazieres B, Pouchot J, Fautrel B, Euller-Ziegler L, et al. Prevalence of symptomatic hip and knee osteoarthritis: a two-phase population-based survey. Osteoarthr Cartil OARS Osteoarthr Res Soc. nov 2011;19(11):1314‑22.
54. Jordan JM, Helmick CG, Renner JB, Luta G, Dragomir AD, Woodard J, et al. Prevalence of knee symptoms and radiographic and symptomatic knee osteoarthritis in African Americans and Caucasians: the Johnston County Osteoarthritis Project. J Rheumatol. janv 2007;34(1):172‑80.
55. Jordan JM, Helmick CG, Renner JB, Luta G, Dragomir AD, Woodard J, et al. Prevalence of hip symptoms and radiographic and symptomatic hip osteoarthritis in African Americans and Caucasians: the Johnston County Osteoarthritis Project. J Rheumatol. avr 2009;36(4):809‑15.
56. Andrianakos AA, Kontelis LK, Karamitsos DG, Aslanidis SI, Georgountzos AI, Kaziolas GO, et al. Prevalence of symptomatic knee, hand, and hip osteoarthritis in Greece. The ESORDIG study. J Rheumatol. déc 2006;33(12):2507‑13.
57. Salaffi F, De Angelis R, Grassi W, MArche Pain Prevalence, INvestigation Group (MAPPING) study. Prevalence of musculoskeletal conditions in an Italian population sample: results of a regional community-based study. I. The MAPPING study. Clin Exp Rheumatol. déc 2005;23(6):819‑28.
58. Grotle M, Hagen KB, Natvig B, Dahl FA, Kvien TK. Prevalence and burden of osteoarthritis: results from a population survey in Norway. J Rheumatol. avr 2008;35(4):677‑
84.
59. Principaux tableaux - Eurostat [Internet]. [cité 24 juill 2015]. Disponible sur: http://ec.europa.eu/eurostat/web/population-demography-migration-projections/population-data/main-tables
60. Peat G, Thomas E, Duncan R, Wood L, Hay E, Croft P. Clinical classification criteria for knee osteoarthritis: performance in the general population and primary care. Ann Rheum Dis. oct 2006;65(10):1363‑7.
61. Courties A, Gualillo O, Berenbaum F, Sellam J. Metabolic stress-induced joint inflammation and osteoarthritis. Osteoarthr Cartil OARS Osteoarthr Res Soc. 29 mai 2015; 62. Richmond SA, Fukuchi RK, Ezzat A, Schneider K, Schneider G, Emery CA. Are joint injury, sport activity, physical activity, obesity, or occupational activities predictors for osteoarthritis? A systematic review. J Orthop Sports Phys Ther. août 2013;43(8):515‑B19.
63. Maetzel A, Tugwell P, Boers M, Guillemin F, Coyle D, Drummond M, et al.
Economic evaluation of programs or interventions in the management of rheumatoid arthritis: defining a consensus-based reference case. J Rheumatol. avr 2003;30(4):891‑6.
64. Hiligsmann M, Cooper C, Guillemin F, Hochberg MC, Tugwell P, Arden N, et al. A reference case for economic evaluations in osteoarthritis: an expert consensus article from the European Society for Clinical and Economic Aspects of Osteoporosis and Osteoarthritis (ESCEO). Semin Arthritis Rheum. déc 2014;44(3):271‑82.
65. Bitton R. The economic burden of osteoarthritis. Am J Manag Care. sept 2009;15(8 Suppl):S230‑5.
66. Pabinger C, Geissler A. Utilization rates of hip arthroplasty in OECD countries. Osteoarthr Cartil OARS Osteoarthr Res Soc. juin 2014;22(6):734‑41.
67. Kurtz S, Ong K, Lau E, Mowat F, Halpern M. Projections of primary and revision hip and knee arthroplasty in the United States from 2005 to 2030. J Bone Joint Surg Am. avr 2007;89(4):780‑5.
68. Pabinger C, Lothaller H, Geissler A. Utilization rates of knee-arthroplasty in OECD countries. Osteoarthr Cartil OARS Osteoarthr Res Soc. oct 2015;23(10):1664‑73.
M
AN
US
CR
IP
T
AC
CE
PT
ED
69. Robinson JC, Pozen A, Tseng S, Bozic KJ. Variability in costs associated with total hip and knee replacement implants. J Bone Joint Surg Am. 19 sept 2012;94(18):1693‑8.
70. Nwachukwu BU, Bozic KJ, Schairer WW, Bernstein JL, Jevsevar DS, Marx RG, et al. Current status of cost utility analyses in total joint arthroplasty: a systematic review. Clin Orthop. mai 2015;473(5):1815‑27.
71. Lapsley HM, March LM, Tribe KL, Cross MJ, Brooks PM. Living with osteoarthritis: patient expenditures, health status, and social impact. Arthritis Rheum. juin 2001;45(3):301‑6.
72. Xie F. The need for standardization: a literature review of indirect costs of rheumatoid arthritis and osteoarthritis. Arthritis Rheum. 15 juill 2008;59(7):1027‑33.
M
AN
US
CR
IP
T
AC
CE
PT
ED
Table 1: Characteristics of studies of osteoarthritis (OA) costs
+/– cost category explicitly/not explicity reported in the study
Author (REF) Country OA Diagnosis Population /
Workers Database Clinical claims Radiographic Kellgren & Lawrence criteria Follow-up (months) Study population
Levy, 1993 (12) France All ACR Population Administratives + - 12 3400000
Leardini, 2004 (13) Italy Limb ACR Population Health survey + + 12 254
Rabenda, 2006 (14) Belgium All SR Workers Health survey + - 6 617
Nunez, 2007 (15) Spain Limb ACR Population Hospital based + + 6 100
Loza, 2009 (16) Spain Limb ACR Population Health survey + + 6 1071
Sabariego, 2011 (17) Germany All ACR Population Hospital based + - 6 97
Hermans, 2012 (18) Netherland Limb ACR Workers Health survey + + 12 117
Rolfson, 2012 (19) Sweden Limb ACR Population Hospital based + - 12 2635
Bertin, 2014 (20) France Limb ACR Population Health survey + - 12 4229
Salaru, 2014 (21) Moldova Limb ACR Population Sectional study + - 12 256
Gabriel, 1995 (23) US All ACR Population Administratives + - 12 7889
Gabriel, 1997 (22) US All SR Population Administratives + - 12 6742
Lanes, 1997 (24) US All ACR Population Health survey + - 12 10101
Maclean, 1998 (25) US All SR Population Health survey + - 24 20000
Ramsey, 2001 (26) US All ACR Population RCT + - 5 122
Maetzel, 2004 (27) Canada All ACR Population Health survey + - 6 140
Mapel, 2004 (28) US All ACR Population Administratives + - 12 5129
Gupta, 2005 (29) Canada Limb SR Population Health survey + - 3 1258
White, 2008 (30) US Limb SR Workers Administratives + - 24 32043
Dunn, 2009 (32) US All ACR Population Health survey + - 12 1116437
Kotlarz, 2009 (31) US All SR Population Health survey + - 12 1423
Berger, 2011 (34) US All ACR Population Administratives + - 12 2399
Berger, 2011 (33) US Limb ACR Population Health survey + - 24 16527
Dibonaventura, 2011 (36) US All SR Workers Health survey + - 6 2173
Gore, 2011 (43) US Limb ACR Population Administratives + - 12 112951
Dibonaventura, 2012 (35) US All SR Workers Health survey + - 6 4876
Kim Le, 2012 (37) US All ACR Population Administratives + - 12 258237
Kim Le, 2012 (38) US All ACR Population Health survey + - 12 258237
Tarride, 2012 (39) Canada All ACR Population Health survey + - 12 1474
Lapsley, 2001 (40) Australia Limb ACR Population Health survey + - 12 70
Woo, 2003 (41) Hong Kong All ACR Population Hospital based + + 12 509
M
AN
US
CR
IP
T
AC
CE
PT
ED
Table 2: Direct cost categories reported in articles
ER: emergency room; Physio: physiotherapists; Bio: biology; Radio: radiology
Author Physician visits
ER Hospit Non traditional healthcare
Physio Drugs Aids Transport
Bio Radio Surgery
Levy + - + - + + - + + + Leardini + - + - + + + + + - Rabenda + + + + + + - + + - Nunez + - - + + + + + + - Loza + - + - - + + + + + Sabariego + - + - - + + - - - Hermans + - + - - + + + + + Rolfson + - + - + + + - - - Bertin + - - - - + - - - - Salaru + + + - - + - + + - Gabriel + - - - + - - + + - Gabriel + - - - + - - + + + Lanes + + + - + + - - + + Maclean + - - - - + + - - - Ramsey + + + + + + + - - + Maetzel + - + + + + + + + + Mapel + + + - - + + + + + Gupta - - - + - - - White + + + - - + + + - - Dunn + + + - - + - + + + Kotlarz + - + - - + - + + - Berger + + + - - + - - - + Berger + + + - - + + - - - Dibonaventura + + + - - - - Gore + + + + + + + + + + Dibonaventura + + + - - - - Kim Le + + + - + + - - + + Kim Le + + + - + + - - + - Tarride + - + - - - + Lapsley + + + - - + + + + - Woo + - + + + + + - - - Xie + - + - - + - + + +
M
AN
US
CR
IP
T
AC
CE
PT
ED
Table 3: Annual costs per patient for hip and knee OA
Annual costs (k€/year)
Author Country OA n Total Direct Indirect
Mean±±±±SD 95% CI Mean±±±±SD 95% CI Mean±±±±SD 95% CI
Leardini, 2004 Italy Limb 254 3 2.3–3.6 1.3 1 - 1.5 1.7 1.1–2.3
Nunez, 2007 Spain Limb 100 - - 1.8 1.3–2.3 - -
Loza, 2009 Spain Limb 1071 1.7 ± 2 1.6–1.9 1.5 ± 1.8 1.4–1.6 0.2 ± 0.7 0.2–0.3 Hermans, 2012 Netherland Limb 117 10.8 ± 13.2 8.4–13.2 2.4 ± 1.2 2.2–2.6 9.6 ± 13.2 7.2–12
Rolfson, 2012 Sweden Limb 2635 6.9 6.7–7.7 1.3 - 5.6 -
Bertin, 2014 France Limb 4429 - - 0.8 - - -
Salaru, 2014 Moldova Limb 256 0.7 - 0.5 - 0.2 -
Gupta, 2005 Canada Limb 1258 11.5 ± 11.4 10.9–12.2 2.2 ±2.1 2–2.3 12.3 ± 11.6 11.6–12.9
White, 2008 US Limb 32043 12 - 7.8 - 4.2 -
Berger, 2011 US Limb 16527 - - 8.4 8.2–8.6 - -
Gore, 2011 US Limb 112951 - - 10.9 ± 18.5 10.8–11 - -
Lapsley Australia Limb 70 - - 0.6 0.5–0.7 - -
Xie, 2007 Singapore Limb 574 a 80 b 6.8 ± 4.4 6.4–7.2 6.2 ± 4.3 5.8–6.5 1.6 ± 2.3 1.5–1.7 * Europe 5.1 1 3.8 * North America 12 10 4.5 * Asia 6.8 6.2 1.6 * Oceania - 0.6 - * Total 11.1 9.5 4.4 * Weighted mean 95% CI, 95% confidence interval
M
AN
US
CR
IP
T
AC
CE
PT
ED
Supplemental table: Annual costs per patient for all OA
Annual costs (k€/year)
Author Country OA n Total Direct Indirect
Mean ±SD 95% CI Mean ±SD 95% CI Mean ±SD 95% CI
Levy, 1993 France All 3400000 0.3 - 0.2 - 0.05 -
Rabenda, 2006 Belgium All 617 2 - 0.6 - 1 -
Sabariengo, 2011 Germany All 97 - - 1.8 1.4–2.2 - -
Gabriel, 1995 US All 7889 a 116 b 3.6 - 3.2 - 0.5 - Gabriel, 1997 US All 6742 - - 4.2 - - - Lanes, 1997 US All 10101 - - 0.6 - - - Maclean, 1998 US All 20000 - - 5.3 - - - Ramsey, 2001 US All 122 - - 3.2 2.5–3.9 - -
Maetzel, 2004 Canada All 140 3 - 1.9 - 0.9 -
Mapel, 2004 US All 5129 - - 4.6 ± 22.4 4–5.3 - - Dunn, 2009 US All 1116437 - - 5.1 5–5.2 - - Kotlarz, 2009 US All 1423 8.7 - - - - - Berger, 2011 US All 2399 19.5 ± 21.8 18.7 - 20.5 15.3 ± 18.7 15.4–16.9 4.3 ± 7.1 4–4.6 Dibonaventura, 2011 US All 2173 12.5 - 3 - 9.4 - Dibonaventura, 2012 US All 4876 10.9 - 5.5 - 5.4 -
Kim Le, 2012 US All 258237 - - 5.6 5.5–5.7 - -
Kim Le, 2012 US All 258237 - - 15.3 15.2–15.4 - -
Tarride, 2012 Canada All 1474 - - 2.1 2–2.2 - -
Woo, 2003 Hong Kong All 509 4.1 - 3.4 - 0.6 -
* Europe 2 0.7 1
* North America 8.9 6.7 5.9
* Asia 4.1 3.4 0.6
* Total 0.35 2.4 0.06
* Total without Levy and al. 8.5 6.7 5.4
M
AN
US
CR
IP
T
AC
CE
PT
ED
Table 2: Direct cost categories reported in articles
Author Physician
visits
ER Hospit Non traditional
healthcare
Physio Drugs Aids
Transport
Bio Radio Surgery
Levy + - + - + + - + + + Leardini + - + - + + + + + - Rabenda + + + + + + - + + - Nunez + - - + + + + + + - Loza + - + - - + + + + + Sabariego + - + - - + + - - - Hermans + - + - - + + + + + Rolfson + - + - + + + - - - Bertin + - - - - + - - - - Salaru + + + - - + - + + - Gabriel + - - - + - - + + - Gabriel + - - - + - - + + + Lanes + + + - + + - - + + Maclean + - - - - + + - - - Ramsey + + + + + + + - - + Maetzel + - + + + + + + + + Mapel + + + - - + + + + + Gupta - - - + - - - White + + + - - + + + - - Dunn + + + - - + - + + + Kotlarz + - + - - + - + + - Berger + + + - - + - - - + Berger + + + - - + + - - - Dibonaventura + + + - - - - Gore + + + + + + + + + + Dibonaventura + + + - - - - Kim Le + + + - + + - - + + Kim Le + + + - + + - - + - Tarride + - + - - - + Lapsley + + + - - + + + + - Woo + - + + + + + - - - Xie + - + - - + - + + +
ER: emergency room; Physio: physiotherapists; Bio: biology; Radio: radiology +/– cost category explicitly/not explicity reported in the study