damage
Damage modelling of composites:
validation
of an interlaminar damage model at the element
level in an industrial application
In this paper, the LMS Samtech Samcef finite
element code is used to assess the damage
tolerance of composite structures.
Delamina-tion (ply separaDelamina-tion), which is one of the most
dangerous and predominant failure modes in
laminated composites, is addressed. Two
meth-ods are used. The first one is based on a pure
fracture mechanics approach, namely VCE
(vir-tual crack extension), while the second method
relies on cohesive elements and on continuum
damage mechanics. These methods are
im-plemented in the commercial version of LMS
Samtech Samcef . This means that, besides the
commercial FE solver, no additional (and costly)
plug-ins providing such capabilities are required
to solve the problem. Another advantage is that
the user does not have to implement academic
methods or models that may be described in the
literature. Even if the openness of LMS Samtech
Samcef is available via material user routines, a
native implementation in a commercial software
program always provides a more reliable
solu-tion.
F
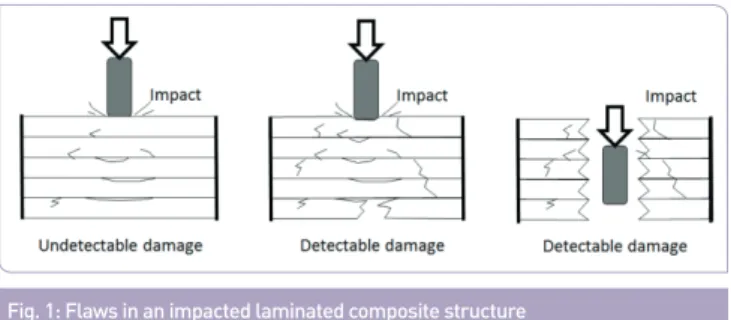
igure 1 illustrates the damage in a laminated structure resulting from an impact at different energy levels. When the impact energy is low, that is for a quasi-static loading, flaws (and especially delaminations) appear inside the part but this damage is invisible (or barely visible) from the outside. Although the user is not aware of it, initial damage is present in the structure. As such an initial damage will penalize the mechanical performance of the composite material, it must be taken into account in the design of the part. This situation is studied here.In this paper, the authors assess the dangerousness of initial interlaminar cracks and predict the non-linear mechanical re-sponse and the propagation of delamination in a composite part submitted to a quasi-static loading and including initial defects.
Here, we concentrate on the element level of the pyramid of tests illustrated in Figure 2. Additional validations of the LMS Samtech Samcef damage laws for damage tolerance of compos-ites at the coupon and component levels can be found in [1-4].
By
Michael Bruyneel, R&D Team Manager (1) & Lecturer (2), Jean-Pierre Delsemme, Product Manager (1), Philippe Jetteur, Scientific Advisor (1), Fabrice Germain, Team leader, Engineering Services (1), Nourrédine Boudjemaa, Composite Material Stress Analysis Expert (3)
(1) SAMTECH s.a. (2) Aerospace and Mechanical Engineering Department,
University of Liège (3) LATECOERE
Fig. 1: Flaws in an impacted laminated composite structure
Fig. 2: Building block approach including the composite structure and virtual and experimental material testing. With courtesy of Airbus Innovations Works.
modes, respectively, see Figure 3) are computed at each node modelling the crack fronts, as illustrated in Figure 4.
First, the total energy release rate is given by a finite difference on the potential energy p with respect to a local virtual crack propagation DA, where pinit and ppert correspond to the energy associated to the initial and perturbed crack size, respectively:
Then the contributions to the different modes are evaluated based on GT and on the relative displacements Ui and reaction forces Ri in the local coordinate system attached to each node modelling the crack front:
Once computed, these values are inserted in a failure criterion, for instance (1), in order to check whether or not the crack will propagate:
In (1), GIc, GIIc and GIIIc are the fracture toughness values, which are determined based on specific (sometimes standar-dized) tests such as DCB (double cantilever beam) and ENF (end notched flexure). See [5] for more details.
(see e.g. [ , ]), that a very fine mesh is needed in the vicinity of the crack front to obtain accurate results. The second reason is linked to the simulation of the crack propagation itself. In order to keep a model with a reasonable size, the mesh refinement should follow the crack front during propagation. For com-posites, re-meshing is a difficult task, because the crack fronts don’t remain straight during propagation and only hexahedral (or prismatic) solid elements can be used when 3D laminates are modelled [7]. Moreover, the strategy for the crack propa-gation itself is either based on a geometric parameterization – which is very difficult to implement when several cracks must be managed – or based on nodes release [8]. In both cases, a general and robust solution procedure is difficult to implement and only simple cracked configurations have been successfully studied.
The cohesive elements approach
In the cohesive elements approach, zero thickness interface ele-ments are defined between the hexahedral eleele-ments represen-ting the plies (Figure 5).
A specific material model including damage is assigned to these interface elements. In LMS Samtech Samcef , the approach des-cribed in [9] is implemented and extended in [10,5] in order to propose exponential, bi-triangular and polynomial constitutive laws for the interface (Figure 6). A potential ed including the damage variables dI, dII and dIII is defined in order to represent the 3 modes of crack propagation of Figure 3. Only the compo-nents of the strain tensor relevant in the interface are conside-red (e33, g31 and g32). As usual in continuum damage mechanics, the damage di impacts the initial material stiffness, here noted k0. The damage does not appear when the crack tends to be closed, that is for <e33>_.
The damage variables take their values between 0 (initial value; no damage) and 1 (final value; completely damaged interface). The value of the damage increases with the loading, which is associated to the so-called thermodynamic forces. In order to manage mixed mode behaviours, an equivalent thermodynamic Fig. 3: The 3 modes of a crack propagation
Fig. 5: Interface element Fig. 4: Computation of the energy release rate at the nodes modelling the
crack front
(1) i
force Y is defined based on the pure contributions YI, YII and YIII, in order to represent the global effect of the loading:
Here, a is equal to 1. In [9], a single damage variable d is used to represent the damage, assuming that damage is damage, whatever may be the influencing mode. Details can be found in [5,9].
With the cohesive elements approach, a coarser mesh can be used compared to VCE. Moreover, the crack propagation is simulated in a natural way as it is related to the local loss of mechanical properties of the material assigned to the interface. For instance in pure mode loading, once the energy below the curve of Figure 6 (which is directly linked to the fracture toughness) is dissipated, damage is equal to 1 and the interface is locally broken. With LMS Samtech Samcef , defining zero-thickness interface elements in an existing mesh is a very simple task. Consequently, there is no inconvenient associated to the meshing process. Using the cohesive laws of Figure 6 requires more parameters compared to VCE. However, this is no more an issue today as the procedure to identify these parameters is available at the coupon level based on, for instance, the DCB and ENF tests as explained in [1].
Application
The test case is illustrated in Figure 7. It is a laminated com-posite element made of carbon/epoxy skin and stiffener, supported at its edges along direction 1 and submitted to a pull test. Initial delaminations (i.e. initial cracks) are defined between each ply in the middle region of the structure, on a square zone, as well as at the noodle location. Thus, 83 initial crack fronts are taken into account in the structure (Figure 7). The initial cracks are modelled by double nodes. Solid shell elements are used. The laminates are made up of plies oriented at 0°, 90°, 45° and -45°. The dimensions, stacking sequences, number of plies and base material properties are not reported here, for confidentiality reasons. Simulation is used here as a predictive tool, and the physical and virtual test results are finally compared in order to estimate the efficiency of the finite element software.
First, VCE is used to detect the most dangerous cracks in the problem. The model of Figure 8 includes 1,028,080 degrees of freedom. Refinements are defined in the vicinity of the crack fronts in order to satisfy the requirements on the mesh
size needed to obtain accurate results [5]. It then comes that elements of an in-plane size of about 0.5mm are used in the zones of interest. Two elements are used along each ply thic-kness; that is, multi-layer elements are not used. A very large number of contact elements (14,186) is defined in the model (Figure 9). It is indeed essential to avoid ply penetration in order to obtain physical and accurate results. A given value of the vertical load is imposed on the upper face, via rigid body elements. A linear static analysis is conducted. The evolution of the failure criterion (1) for these initial cracks is also provided. It is clear from Figure 10 that 3D effects appear in the problem, even if a simple pull test is conducted. Indeed, not only mode I but also mode II are present in the problem and their magni-tude is of the same order (mode III is not represented). The results of Figure 10 indicate that the cracks at the noodle
loca-Fig. 7: Location of the cracks in the composite element submitted to a pull test
Fig. 8: Finite element model for VCE
Fig. 9: Deformation of the element and ply penetration avoided thanks to contact elements
damage
elements approach. The model is illustrated in Figure 11, with the 3D cohesive elements defined in the extension of each initial crack (Figure 12). The model includes a total of 126,697 degrees of freedom, and 3,054 interface elements. The internal voids in Figure 12 correspond to the initial cracks, modelled with double nodes: interface elements are not defined at these locations but contact elements are used to avoid penetration. One element is used along each ply thickness. A vertical displacement is imposed on the upper face. A non-linear static analysis is conducted as the mechanical properties in the interfaces will evolve according to the non-linear laws of Figure 6. Here, the bi-triangular law is used. The evolution of the damage inside the interface elements is illustrated in Figures 13 and 14. It is clear that delamination is initiated at the nodal location, as previously predicted with the VCE method. Howe-ver, the final collapse is due to the skin/stiffener separation. The reaction/displacement curve is plotted in Figure 15. The test result is compared to the prediction obtained by simulation: a very good agreement is obtained. The evolution of the composite element stiffness is well represented and the simulation over-estimates the maximum force by only 5%. The first crack propagation is indicated by a black circle in Figure 15, for a level of reaction force which is far from the maximum value the composite part can sustain. The computation time is 74 minutes. Even though a parallel solver is available in LMS Samtech Samcef , a single processor is used here (Bi-Xeon 5160 3GHz machine, 16 GB central memory, 64-bit RedHat AS 4 UP4).
Conclusion
Modelling and solving delamination problems in composites are known to be difficult, and the virtual testing capabilities offered by LMS Samtech Samcef comply with the indus-trial reality. Some of the needs identified at the indusindus-trial level include using large-size finite element models to effi-Fig. 11: Finite element model for the cohesive elements approach
Fig. 13: Damage evolution in the interfaces for an increasing value of the imposed displacement
Fig. 14: Damage evolution in the interfaces for an increasing value of the imposed displacement (continued)
ciently represent reality; taking a large number of cracks in the structure into consideration in order to provide a safe design; modelling contact conditions over large areas; and obtaining accurate results. LMS Samtech Samcef efficiently answers these industrial concerns with features such as easy definition of cracks and delamination zones; estimation of the propagation load via the VCE method; more advanced capabilities through the cohesive elements approach for interlaminar crack propaga-tion and estimapropaga-tion of the overall structural behaviour during the fracture process; a library of softening material laws for interlaminar behaviours; efficient strategies for treating contact conditions; accurate results (compared to reference solutions); and a parallel solution procedure for large-scale problems. n
References
[1] Bruyneel M., Delsemme J.P., Goupil A.C., Jetteur P., Lequesne C.,
Naito T., Urushiyama Y. “Damage modeling of laminated compo-sites: validation of the inter-laminar damage law of LMS Samtech Samcef at the coupon level for UD plies”. 11th World Congress on Computational Mechanics (WCCM XI), July 20-25, 2014, Barcelona, Spain.
[2] Bruyneel M., Delsemme J.P., Goupil A.C., Jetteur P., Lequesne C.,
Naito T., Urushiyama Y. “Damage modeling in laminated compo-sites: validation of the intra-laminar damage law of LMS Samtech Samcef at the coupon level for UD plies”. European Conference on Composite Materials (ECCM16), June 22-26, 2014, Seville, Spain.
[3] Bruyneel M., Degenhardt R. and Delsemme J.P. “An industrial
solution to simulate post-buckling and damage of composite panels”. JEC Composites Magazine, 48, May 2009.
[4] Galucio A.C., Jetteur P., Trallero D. and Charles J.P. “Toward
numerical fatigue prediction of composite structures: application to helicopter rotor blades”. 3rd ECCOMAS Thematic Conference on the Mechanical Response of Composites, September 2011, Hannover, Germany.
[5] Bruyneel M., Delsemme J.P., Jetteur P., Germain F. “Modeling
inter-laminar failure in composite structures: illustration on an industrial case study”. Applied Composite Materials, 16(3),
149-162, 2009.
[6] Krueger R. “An approach to assess delamination propagation
simulation capabilities in commercial finite element codes”. NASA/ TM-2008-215123, 2008.
[7] Krueger R., Rinderknecht S., Koning M. “Two- and
Three-Dimen-sional Finite Element Analyses of Crack Fronts in a Multidirectional Composite ENF Specimen“, ISD-Report No. 97/1, University of Stuttgart, 1997.
[8] Orifici. A, R. S., Thomson, Degenhardt R., Bisagni C., Bayandor J.
“An analysis tool for design and certification of post-buckling com-posite aerospace structures“. International Journal of Structural
Stability and Dynamics, 10, pp. 669-683, 2010.
[9] Allix O. and Ladevèze P. “Interlaminar interface modeling for
the prediction of laminate delamination“, Composite Structures, 22, 235-242, 1992.
[10] Jetteur, Ph., “Modèle Matériau pour l’Elément d’Interface“,
SAMTECH Report RS-246, 2006.
damage
Fig. 15: Reaction/displacement curves from SAMCEF prediction and test
Computational times (in minutes) needed to solve the industrial problem
4 553,889 6,700 285 Number of processors Size of the problem dof Maximum load (N) CPU to reach 2.35mm (minutes) Mean le (mm) 2 2 3 7 1 1 1 553,889 6,700 854 293,332 6,530 524 112,122 6,720 44
More information
More information
Additional tests run on a variant of this problem (different dimensions, material, stacking sequence, boundary conditions) showed a small sensitivity of the solution to the mesh size when the cohesive element approach is used (Figure a). The LMS Samtech Samcef parallel solver can be used to decrease the computational time even more (Figure b and Table 1). Here, a speedup of 3 is obtained with 4 processors, resulting in an efficiency of 75%.
Fig. a: Different mesh refinements of the model (le = average in-plane element length)