THE EVOLUTION OF REGIONAL INEQUALITY: LESSONS FROM EUROPE AND NORTH AMERICA
Mario Polèse
Inédit / Working paper, no 2011-03
THE EVOLUTION OF REGIONAL INEQUALITY: LESSONS FROM EUROPE AND NORTH AMERICA
Mario Polèse
Paper for inclusion in a document to be published by ECLAC
(Economic Commission for Latin America and the Caribbean), Santiago de Chile.
Institut national de la recherche scientifique Centre - Urbanisation Culture Société
Montreal
Mario Polèse
Centre - Urbanisation Culture Société Institut national de la recherche scientifique 385, Sherbrooke Street East
Montreal (Quebec) H2X 1E3 Phone: (514) 499-4000 Fax: (514) 499-4065
www.ucs.inrs.ca
This document can be downloaded without cost at:
www.ucs.inrs.ca/sites/default/files/centre_ucs/pdf/Inedit03-11.pdf
Abstract
This paper examines the geography and the evolution of regional income (or product) inequality in Europe and in North America with the objective of drawing lessons for Latin America. A broad census exists in the literature, certainly among economists, that economic integration and growth will on the long run favour the convergence of per capita income (and product) across nations and regions. The data presented in the paper is consistent with this consensus. Yet, some regional disparities are more stubborn than others. The North/South divide in the UK is an example. A simple model is proposed to explain why regional disparities might be more acute in some nations, event at comparable levels of development. The model seems to apply fairly well to South American nations.
Key Words:
Regional Inequality; Regional Disparities; Regional Development
Résumé
Ce texte propose un examen de la géographie et de l‟évolution des inégalités régionales de revenu (ou de produit) en Europe et en Amérique du Nord, dans le but d‟en tirer des leçons pour l‟Amérique latine. Il existe aujourd‟hui un large consensus dans la littérature, notamment chez les économistes, voulant que l‟intégration et le développement économiques mènent à long terme à une convergence du revenu (ou produit) par habitant entre pays et entre régions. Les données présentées confirment ce consensus. Toutefois, certaines disparités régionales sont plus durables que d‟autres. La division Nord/Sud de l‟Angleterre en est un exemple. Un modèle simple est proposé pour expliquer pourquoi les disparités seraient plus aigues dans certains pays, y compris à des niveaux comparables de développement. Le modèle semble bien s‟appliquer aux pays de l‟Amérique du Sud.
Mots clés :
INTRODUCTION
Should we expect per capita income (or product) disparities between regions to widen or to lessen over time? The answer, as we shall see, is not the same for all nations. The history of regional inequality in rich nations suggests that some regional disparities are more difficult to overcome than others. In this paper, we look at the evolution and the geography of regional inequality in Europe and in North America1, with the objective of, drawing hopefully useful lessons for Latin America.
REGIONAL INCOME INEQUALITY IN INDUSTRIALIZED NATIONS
An abundant literature exists on the subject of regional income (or product) inequality within nations (Coulombe 2000, 2007, Barro and Sala-i-Martin 2004, Duranton and Monastrioitis 2002, Kanbur and Venables 2005, Meliciani 2006, Petrakos et al 2005, Puga 1999, Ramírez et al 2009, Ramón-Berjano 2010, Rodriguez-Pose and Gill 2004, Rodriguez-Pose and Sánchez-Reaza 2005, Silva-Lira 2003, Williamson 1965). Much has been written on the opposing forces which, on the one hand, propel regional inequality, driven by agglomeration, increasing returns and cumulative causation (Krugman 1991, Lucas 1988, Myrdal 1957, Romer 1986) and those, on other hand, that favour convergence via factor mobility, trade, and falling distance costs (Barro and Sala-i-Martin 1995, Puga 1999). The general consensus, certainly among mainstream economists, is that economic growth and economic integration will on the long run reduce per capita income disparities between regions.
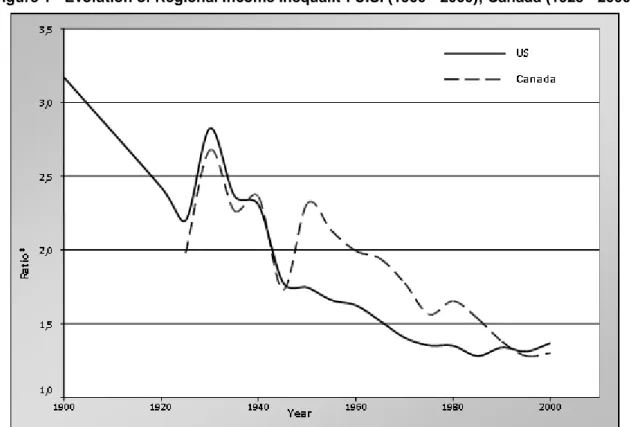
The evidence largely supports the convergence view2. For almost all industrialised nations where data is available, income or product disparities have fallen sharply since the Second World War (Barro and Sala-i-Martin 1995). Figure 1 shows long-term trends for Canada and the US. Regional income disparities have fallen in both nations over the last century. In the United States, the ratio between average per capita income in the two richest states and in the two poorest has fallen from 3.2 to in 1900 to 1.4 in 2000; in Canada, ratio between the two richest and in the two poorest provinces fell from 2.7 in 1930 to 1.3 today. Both nations, especially the United States, have a tradition of high labor mobility, certainly when compared to many other industrialized nations. Labor mobility is not the only factor which explains the decline in regional income disparities.Both the United States and Canada witnessed extraordinary economic growth during the 20th century. Each economy became progressively more integrated as railways, highways,
1
Many of the arguments presented here are based on Polèse (2009) to which the reader is referred for fuller explanations. 2
Technical issues surrounding the measurement of regional per capita income (or product) convergence are not discussed are as they are not central to the arguments presented.
telephone lines, air traffic and – more recently – high-speed Internet connections crisscrossed the nation. People, goods, information, and capital move far more freely today than a century ago. The American and Canadian experience can hardly be used as an argument against the virtues of economic integration.
Figure 1 - Evolution of Regional Income Inequalit*. U.S. (1900 - 2000); Canada (1925 - 2000)
*Ratio of per capita income in the two richest States (Provinces) to that in the two poorest. Author‘s calculations. Sources: BEA (on-line); Stat Can. (periodic)
The European experience since the Second World War, although for a shorter time period, points in the same direction. Income differences between the first member nations of the EU (formally, the European Economic Community) – the most ambitious economic integration project in modern times – have fallen sharply since the 1950s. Per capita income levels in Germany and in France, for example, are today pretty much the same. Regional income disparities within Western European nations declined significantly between 1950 and 1980, the period of most rapid growth and integration, during which the continent‟s transportation infrastructures were not only rebuilt but also greatly expanded. Figure 2 shows trends for five Western European nations from 1950 to 1990. With the notable exception of the U.K. (to which we shall return) regional disparities declined systematically between 1950 and 1990.
9
In sum, it is difficult to argue – based on North American and West European experiences – that economic integration and economic growth do not over time promote greater income equality between regions. The positive relationship between economic growth and greater regional income equality is further illustrated by the sudden upsurge in inequality in both the U.S. and in Canada during the Great Depression of the 1930s, which then fell again just as abruptly following the rapid expansion of both economies with the beginning of the Second World War.3 However, spatial income inequalities never totally disappear, if only because of the friction of space and the costs of migration. Regional income (or product) disparities have stabilized in most industrialized nations since the 1980s. The monetary and psychological costs of migration mean that some level of disparity is “normal”. In Canada, a very large nation, the great majority of spatial earnings differences fall within the 20% to 25% range and have stabilized at that level over the last two
3
The sudden surge in regional disparity in Canada following World War II should not be misinterpreted. This is solely attributable to the entry into the Canadian Federation of Newfoundland in 1949, Canada‘s poorest Province at the time.
decades (Shearmur and Polèse 2005)4. This is probably as good a reference point as any, suggesting that most observed regional income disparities in industrialized nations are not a cause for concern.5.
However, some disparities are more stubborn than others, with Italy a classical example in Europe. Italy‟s South – the Mezzogiorno – seems to be an eternally lagging region. Note Italy‟s position on top on figure 2, despite an overall decline in inequality. Per capita product in Lombardy – in the North – is more than twice that for the South, a ratio which has hardly budged over the last twenty-five years. More surprisingly, disparities have begun to grow again in some nations,6 which has given rise to much soul searching by members of the regional policy
4
Shearmur and Polèse (2005) examined the evolution of income and earning differences in Canada between 1971 and 2001 for 382 territorial units.
5 Seen in this light, the EU criterion for identifying regions eligible for aid – per capita GDP 25% below the EU average – seems quite appropriate. It is unfortunate, however, that the EU uses GDP rather than income figures. Using GDP can create distortions, especially in resource-rich regions.
6
Rodríguez-Pose and Gill (2004) observe an increase in regional disparities in the EU between 1990 and 2000 as measured by the variance of the log of regional GDP per capita. Geppert and Stephan (2008) also observe a widening of disparities in Europe.
11
community, especially in the EU. Figure 3 shows trends from 1995 to 20057. The (new) high level of regional disparity in Germany is the result of a unique event, reunification in 1990 bringing poorer East Germany into the federation, and as such requires little further comment. Britain‟s stubborn disparities is more intriguing, and a continuing subject of concern for both academics and practitioners (Godchild and Hickman 2006). Wage inequalities have widened between London and the rest of Britain (Duranton and Monastiriotis 2002). In GDP terms, Greeter London generates a per capita product about twice that of some Northern English regions (Figure 4), an unusually high disparity for an industrialized nation.
The “normal” functioning of the market cannot fully explain the persistent income gap between the North and South of Italy or between the North and the South of England. Britain has, arguably, Western Europe‟s freest labor market, as well as a dense network of cities, and generally good infrastructure. It is, by any measure, a fully intergraded, advanced, economy. The roots of its stubborn North-South divide lie elsewhere.
7
AGGLOMERATION AND REGIONAL GROWTH IN THE KNOWLEDGE ECONOMY
There is no evidence that regional disparities are universally widening in industrialized nations. Britain is somewhat of an exception. Most of the evidence, we saw, points in the direction of lessening disparities, which tells us that regional income convergence is not incompatible with agglomeration and urbanization. But, different national conditions can produce different results. The widening of regional income disparities in some nations cannot simply be attributed the concentration of economic activity in cities, a universal attribute of development The answer lies in part in the interplay between the rise of the knowledge economy, geography, and what has come to called endogenous growth theory (Lucas 1988, Romer 1986). In a nutshell, endogenous growth theory postulates that the standard mechanics of decreasing returns do not apply to human capital. Quite to the contrary, the more human capital is concentrated and brought together, the higher the productivity (and thus wage) of each individual player. This is a core component of agglomeration economies in developed nations.
The impact of increasing returns in determining whether local wages will rise (or fall) very much depends on the industrial composition of the economy. It is reasonable to assume that increasing returns to human capital are more widespread in knowledge-rich economies. In less developed economies where few industries rely on highly educated workers we would not expect increasing returns to outweigh the standard supply and demand effects for labor, where an increase in supply pushes wages down8. In economies based on brainpower, the opposite will often be true. We may reasonably assume that the number of industries subject to increasing returns has grown. In the knowledge economy, it is entirely plausible that the cumulative growth effects may in many instances overpower the more traditional supply and demand effects of migration. The more educated and skilled people a place attracts the more productivity will rise. If brains are the primary rare resource that drives growth, then the more a place can accumulate the better.
This view of the world in which brains (imagination, innovation…) drive local economies has become somewhat of a mantra among urban growth gurus in recent years. Florida (2002) has built an entire growth strategy around it, in which he proposes his recipe for attracting what he calls the creative class. Florida has been highly successful in marketing his message. Almost every town and region has its strategy for attracting young educated professionals. Every city today aspires to be a magnet for talent and brains or however one to wishes to designate this lucky group. In the end, whether Florida‟s recipe for attracting brains is effective is immaterial. What matters is that this game necessarily implies winners and losers. Migration is selective by its very nature. If one place attracts brains another place necessarily loses them.
8
However, if skilled labor is scarce (and valued) interpersonal wage disparities between skilled and unskilled workers might be very high. There is no necessary correlation between the level of interpersonal and interregional income disparities.
13
What then matters is where modern knowledge-intensive industries locate. If location is systematically skewed towards certain places, the probability of producing self-reinforcing wage disparities grows. Knowledge-intensive industries, notably in the service sector, are normally drawn to the largest urban centers (Polèse and Shearmur 2006, Polèse and Rubiera 2006). Figure 5 illustrates the relationship between city-size and employment in professional, scientific, and technical services for the U.S. and Canada. Such service industries are drawn to large cities for two complementary reasons: production requires frequent face-to-face contacts; transport costs of the product (images, music, text, advice…) are almost zero thanks to information technology. Combining the two – agglomeration pressures on the production side and low transport costs on the consumption side – it is easy to imagine a self-reinforcing cycle in which the most dynamic industries are subject to increasing returns and concentrate in the largest cities, drawing in skilled labor, further driving up productivity and wages, in turn drawing in yet more skilled labor. In this scenario, wages will continue to grow more rapidly in knowledge-rich locations; that is, so long as the cumulative growth effects of the in-migration of skilled labor continue to outweigh other effects, which can be a long time. It is no coincidence that the highest per capita personal incomes among major US metropolitan areas, New York aside, are found in Greater Boston and in the San Francisco Bay Area (which includes Silicon Valley).
In short, the mechanics of regional growth are changing as brains replace brawn, putting an even greater premium on urban size and corresponding accumulations of human capital. Only a few places will attain the necessary size. However, the scenario described above need not automatically lead to entrenched regional disparities. It very much depends on how the centers which draw in brains are distributed over the national landscape. Regional disparities are more likely to unfold where such centers are concentrated in one part of the nation, which brings us to the role of geography and trade.
TRADE AND THE DYNAMICS OF REGIONAL GROWTH
Many factors can explain why, even at comparable levels of development, some nations exhibit more pronounced levels of regional disparity than others. Smaller nations should ceteris paribus have lower regional disparities. However, for Europe, Felsenstein and Portnov (2005) find no necessary relationship between country size and levels of regional inequality. They conclude that other intermediating factors such as social cohesion, natural resource endowments, agglomeration economies, and openness to trade may be as important. We shall look at trade and agglomeration economies. If both are pulling economic activity in the same direction, the potential for regional inequality is heightened, as we shall see.
In a model proposed some ten years ago, Paelinck and Polèse (1999) posit, for any nat ion, that economic activity will with time shift in the direction of the nation‟s most important trading partner. The greater the weight of trade in national GDP, the greater the will be the geographical pull of the trading partner. Replacing the term “trading partner” with the concept of “continental core”, the wealthiest regions within a nation will, following Paelinck and Polèse (1999), develop in areas where distance from the core is minimized, while the poorest regions will arise where distance is maximized.
In Europe, the continental core is often referred to as the Blue Banana (generally attributed to the French geographer, Roger Brunet), a banana shaped area stretching from London to Milan, the area with the densest concentration of population and economic activity9 (Map 1). The geography of regional disparity in Europe is largely consistent with Paelinck and Polèse (1999), using deviations from the national average in per capita GDP (Map 2). Spain‟s two wealthiest regions outside Madrid lie in the north, closest to the Blue Banana, across from south-western France, traditionally among the least developed. By the same token, Poland‟s wealthiest areas, outside Warsaw, lie in the west closest to the continental core, bunched up against Germany‟s poor east. In Hungary, the richest province outside Budapest lies on its western border across from Austria‟s poorest.
9
15
This cartographic regularity is basically a stylized restatement of the importance of market accessibility as a determinant of industrial location. Numerous studies for Europe have confirmed the existence of a positive relationship between per capita GDP (or other welfare measures) and market potential with a strong centre-periphery gradient, with the highest values in the core of the traditional Blue Banana somewhere between Basel and Rotterdam (Breinlich 2006, Meliciani 2006, Niebuhr 2006). The main intervening factor is the presence of national boundaries.
In North America, Mexico and Canada provide further evidence of the geographic pull of trading partners and the role of borders. For both nations, the US constitutes by far the most important trading partner, further consolidated with the signing of NAFTA in 1994. For Canada, Apparicio
et al (2007) found a strong positive relationship between employment growth and continental
market accessibility for each of the three decades between 1971 and 2001, after controlling for other factors such as city size, education levels and industrial structure. The strength of the positive relationship has grown over time, specifically for manufacturing employment growth. Shearmur and Polèse (2007) observe a positive relationship with local employment growth since 1981 using simple South-North coordinates.
The polarizing effects of trade are even clearer in Mexico. Several authors have suggested that NAFTA sharpened the north-south divide (Esquival et al 2003, Rodriguez-Pose and Sánchez-Reaza 2005). Because of Mexico‟s funnel-like shape, the geography of regional inequality follows a clearly discernable path (Figure 8), recalling Italy‟s north-south split. Per capita GDP increases almost systematically along a south-north continuum with the highest values for states located on the US border and along the Caribbean coast facing the southern US. With the exception of the Mexico City region, which has the nation‟s highest per capita GDP, the highest values are for the State of Nuevo León, home to the industrial metropolis of Monterrey, located on the principal highway between Mexico City and the Texas border, the main entry point to US core markets. For Mexico, a simple correlation analysis for its 2444 Municipios between income levels in 2000 and distance from the US border yielded an R coefficient of 0.414, significant at the 0.001 level10.
Map 3 (Mexico) brings out the importance of trade corridors, specifically corridors linking the capital or largest city with continental cores or dominant trading partner. Note the high per capita GDP value for the State of Querétaro, home to the city of the same name, located on the Mexico City-Texas highway, which registered the most rapid population of growth (1990-2000) of any major metropolitan area (population over 100,000) not directly located on the US border. Map 4
10Municipios were classified into the three classes, depending on distance, where ―3‖ identifies States contiguous to the US. T he income variable used was the percentage of employed labour force earning more than the equivalent of five minimum wages. T he data is drawn from the 2000 Mexican census. I thank Isabel Angoa and Enrique Bueno (Facultad de Economía, Universidad Autónoma de Puebla ) for their help in obtaining the data and doing the calculations
(population change in the US and Canada) further illustrates the impact of trade corridors11. Large parts of North America are losing population, a reflection not only of the continuing pull of major cities and trade corridors, but also of the impact of past legacies of colonization, industrial specialization, and resource exploitation. The great dry “overexploited” interior, dubbed the
Empty Quarter by Garreau (1981) is losing population, as are the resource (forestry, fishing,
mining…) regions of Canada and the US Appalachian Corridor, traditional home to coal mining and steel-basing industries. However, equally revealing is the concentration of growth along highway systems, along for example highways I-55, I-44, and I-35, linking Chicago with Monterrey and along I-95 and I-85, linking New York with Atlanta.
Summing up, two forces are at play: a) agglomeration and the rise of the knowledge economy, pulling economic activity and populations towards urban conurbations; b) trade and globalization, which may or may not pull activity in the same direction, depending on the nation‟s geography and location of trade partners. The antagonism between these two forces will produce different geographies of inequality, depending on national attributes. In the following section, we propose a simple model for depicting the interplay between agglomeration and trade.
THE INTERPLAY BETWEEN AGGLOMERATION AND TRADE: THREE STYLIZED SCENARIOS
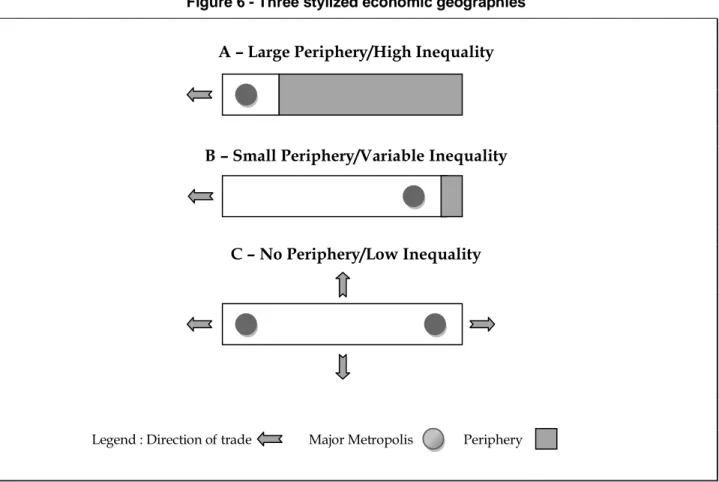
In our simple model, national economies are subject to two spatial processes : 1) long-term shifts of economic activity in the direction of dominant trading partners; 2) continuing concentration of knowledge-rich activities in and around the largest city or cities. The first process values locations close to the dominant trading partner, while the second values locations in or near the largest city. The location of the largest city or cities and of the dominant trading partners can vary. In figure 6, three stylized cases are pictured. For the sake of simplicity, only one large city and one dominant trading partner are posited for scenarios A and B.
In case A – large periphery/persistent disparity – the nation‟s largest city and its chief trading partner are located on the same side of the nation; that is, on the left-hand side on figure 10. In case A, both spatial processes value the same locations. The forces of agglomeration and of trade are pulling in the same direction. For export-oriented industries and industries subject to agglomeration economies there is little advantage in locating in the periphery – shaded in grey – except perhaps for the least knowledge-intensive. In this stylized scenario, the periphery‟s only advantage is lower wages, and thus also lowers per capita incomes. Unless the largest city moves – highly unlikely – or the direction of trade changes - possible - the income disparity is likely to be very stubborn, with little chance of it dampening over time.
11
Trends after 2001 reveal no dramatic changes in the patterns observed on Map 4. A map for population changes between 2001 and 2006 is available upon request from the author.
17
Figure 6 - Three stylized economic geographies
A – Large Periphery/High Inequality
B – Small Periphery/Variable Inequality
C – No Periphery/Low Inequality
Legend : Direction of trade Major Metropolis Periphery
The UK, specifically England, comes close to fulfilling the conditions of scenario A. To make England conform to scenario A, it needs simply to be stood on its head with the arrow facing south, placing the grey patch in the north. England meets both conditions: its chief trading partner (continental Europe) and its largest city (London) both point south. On the second condition, the pull of London is not only fuelled by “normal” national agglomeration, but also by its continental role as a business and financial center. The forces of national and continental (even international) agglomeration overlap, driving up the value of a single point in space: greater London in this instance. This sparks a corresponding east-west London-Bristol corridor. As scenario A predicts, England‟s “periphery” (the North of England) is large and remains problematic.
Scenario B presents the opposite scenario. Here, the forces of agglomeration and trade are pulling in opposing directions. The largest city is located at the opposite end of the nation from that of its dominant trading partner. In this case, the spread effects emanating from the largest city and from trade corridors cover a potentially large area. The European nation which comes closest to this
happier scenario is Austria, where Vienna, the largest city, lies at the extreme eastern edge of the nation, with most of the nation crisscrossed by trade corridors between it and dominant trade partners to the west.
In short, the further the largest city is from the continental core (or dominant trading partners), the smaller the relative size of the periphery. We should expect the majority of locat ions lying in the path between the two to exhibit incomes above the national average. The evidence for Europe (Map 2) is consistent with this scenario: high income regions in Spain, Italy, Hungary, Poland, and Sweden are, as a rule, located between the capital and respectively its northern (for the first two nations), western (second two), and southern boundaries.
Let us now drop the two simplifying assumptions underlying scenarios A and B: one major metropolis; one dominant trading partner (or one continental core). Dropping the first condition: the greater the number of major cities, approaching the largest in size, and the more spatially dispersed they are, the more equal regional income distributions should be. For Europe, Cuadrado-Roura (2001) identifies the regional presence of at least a mid-sized city, with a corresponding city system, as the first condition for regional convergence. For Canada, Coulombe (2000) found that inter-provincial income convergence is in part driven by a corresponding convergence in urbanization levels. Stated more abstractly, if agglomeration economies are present everywhere they cannot act as a factor in regional income inequality. Dropping the second condition : the more spatially diversified the direction of trade, the more equal regional income distributions should be. If all locations provide the same market access, then proximity to markets no longer acts as a factor in regional income inequality, which brings us to scenario C.
Scenario C presents a case with two large urban metropolises and with no dominant trading partner. No periphery emerges. We would expect to find a fairly equal spatial distribution of per capita income across the nation. Scenario C is a fairly accurate, if somewhat stylized, depiction of the US, imagining the Pacific coast on the left and the Atlantic to right. One could add a third metropolis – Chicago – in the middle, but this does alter the basic pattern. Scenario C depicts an economic geography in which the forces of trade and of agglomeration do not combine to produce systematically poorer and richer regions. The US has no dominant trading partner. The US trades in almost equal proportions with Canada (to the north), Mexico (south), Europe (east), and Asia (west). The “periphery” which might emerge is in the centre, which is what has happened, as witnessed by population decline in the central regions of the US (recall figure 9), which are also today among the poorest (Economist 2005).
19
COUNTERVAILING FORCES: INDUSTRIAL STRUCTURE; AMENITIES
The three scenarios above abstract from intervening factors other than distance (from markets) and size. In industrialized nations, two factors have shown themselves to be of particular importance in recent years : a) the impact of natural resources and inherited industrial structures; b) the impact of rising incomes and aging populations.
Let us start with natural resources. The history of Canada is replete with examples of the contrary effects of natural resources on regional development. Like many Latin American nations, Canada‟s initial economic take-off was based on natural resources, and many Canadian regions remain dependant on natural resources. High resource demand generates local jobs and income (oil is a current example), creating growing regional economies. However, the long-term effects often act in the opposing direction, arresting growth. Polèse and Shearmur (2002, 2006a) coined the term “Intrusive Rentier Syndrome” to help explain why many local resource-based economies in Canada have found it difficult to diversify into other sectors and to generate sustained economic growth. The “Intrusive Rentier” is basically a regional adaptation of what economist call the Dutch Disease, with reference to the epoch when the Dutch Guilder (before the Euro) was suddenly driven up following the discovery of North Sea oil, undermining the international competitiveness of Dutch merchandise and service exports.
The term “Rentier” refers to firms, generally large and highly capitalized, that are able to earn a premium (a “rent”) due to a particularly rich local resource, be it trees, minerals, oil or something else. Large paper mills, mines, aluminum plants, and smelters are typical examples in Canada. They are “Intrusive” because they “artificially” drive up local wages, thus undermining the competiveness of other export sectors. In addition, they often foster a mindset that is not necessarily conducive to business start-ups and innovation. During their field visits, Polèse and Shearmur (2002) encountered numerous small and medium-sized firms with recruitment problems despite high local unemployment, an anomaly explained by their inability to compete with wages offered by large paper mills or aluminum plants. Higher wages also act as a disincentive for small firms to invest in workers; once trained, the most competent will move to better paying jobs at a large plant or mine. When added to an initial distance-cost disadvantage in peripheral areas, it is not difficult to understand why a diversified manufacturing base has failed to flourish in many Canadian resource-based regional economies. The Intrusive Rentier also helps to explain an a priori counter-intuitive result: high wage rates and net out-migration (recall the declining populations in Map 4 of much of north-eastern Canada ).
The Intrusive Rentier Syndrome is not limited to peripheral resource-based economies. The evidence for Europe and the US suggests that the Intrusive Rentier can take hold in well-established industrial regions. In recent years, the most stubbornly problematic regional
economies in Western Europe and in the U.S. are those with histories of mining, heavy industry, and large plants. In the US, the so-called “Rustbelt” (basically the stretch of area between Chicago and Pittsburgh) remains a zone of high unemployment and slow growth. In Europe, examples are French Lorraine, Belgian Wallonia, and the English Midlands, all of which share histories of large plants and (formally) high wages, but also of continuing high unemployment rates and high out-migration. All exhibit GDPs per capita below the national average (recall figure 7), despite the presence of large urban centers and locations close to the heart of Europe. The granddaddy of great industrial cities, Manchester, England (the birthplace of the Industrial Revolution), has consistently underperformed since the Second World War (Peck and Ward 2002). In such regions, the obstacles to growth go well beyond wages and economics and are in part sociological and institutional.
In industrialized nations, resource endowments have entered the picture at another level in recent times. Natural amenities - sun, sand or mountains – increasingly influence migratory choices and industry location as retired populations grow and as tastes evolve towards more hedonistic and green pursuits, both in Europe and in North America (Cheshire and Magrini 2006, Rappaport 2007, 2009). In both the US and in France, the „sun and surf‟ factor has favoured what were historically peripheral low income areas (the South). In France, the attraction of the south has led to an almost complete reversal of the traditional division between (rich) Paris and the rest of the nation (Davezies 2008). Traditionally lagging regions such Languedoc-Roussillon and Aquitaine are now among the most rapidly growing. Equally in Spain, the attraction of sun and surf has spurred the growth of traditionally lagging Andalusia. In all these cases, amenity-led migration has contributed to regional income equalization.
Not so in Britain. Amenity-led migration has further reinforced the pull of the already richer South of England, although admittedly the sun does not shine there very often; but more so than in the North. All advantages, even natural, are relative as Cheshire and Magrini (2006) remind us. The South of England of England is favored on all counts, not only on the classical factors of agglomeration and trade, but also on the amenity factor and on the industrial legacy factor. The most industrially challenged areas, regional economies histrionically rooted in mining and metal-bashing industries, are located in the North. The combination of all these factor goes a long way in explaining why regional income disparities have remained a major problem in Britain.
CONCLUSION: IMPLICATIONS FOR LATIN AMERICA
In this paper, we examined factors that might cause regional per capita income (or product) disparities to be more pronounced in some nations than in others, focusing on the experience of North America and Europe. Looking first at the evolution of regional disparities, the historical evidence is unequivocal: economic growth and economic integration will over time cause
21
regional (per capita) incomes to convergence. In the US, Canada, and Western Europe, regional income (or product) disparities have declined sharply over the last century. The lesson for Latin America is obvious. Economic growth and further economic integration, both within and between nations, should over time contribute to a reduction of regional disparities. This also suggests that the currently high levels of regional disparity in Latin America (CEPAL 2010, Ramírez et al 2009) are in part a reflection of insufficiently integrated markets, both internally and externally. Within nations, this points in the direction of continued investments in transportation and communications infrastructures, tying all parts of the nation together; but also in the direction of flexible labor markets, open business environments, and universally accessible basic social services (notably, primary and secondary education). These are fundamental building blocks and require little additional comment.
The evidence also suggests that regional income (or product) disparities, once they have fallen to an acceptable level, will eventually stabilize. Disparities will never totally disappear, if only because of the costs of migration. However, even in highly integrated industrialized nations, some regional disparities are more difficult to overcome. The evidence suggests that the rise of the knowledge economy, which puts a premium on the agglomeration of human capital, has caused regional disparities to widen in some cases. The income disparity between Greater London (and surrounding South of England) and the rest of Britain is a case in point. By the same token, globalization and growing international trade may in some cases widen internal disparities, specifically favoring some regions over others. Mexico is a case point (although, admittedly, not yet a fully an developed nation).
Building on the experience of North America and Europe, a simple model was proposed for explaining national differences in regional inequality, focusing on the interplay between the forces of trade and agglomeration. The model posits three possible scenarios from highest to lowest disparity conditions. Regional disparities will be highest (scenario A: figure 6), where the forces of trade and of agglomeration both favor the same regions. A cursory glance at the evidence suggests that the model‟s predictions also hold for Latin America. Scenario A would predict that regional disparities are highest in Peru, Argentina, and Brazil, which is consistent with CEPAL (2010) and also with the findings of Ramírez et al (2009) who rank nations on three indicators of regional income divergence12. CEPAL (2010), using an indicator similar to that on figure 1 for the US and Canada (i.e. the ratio of the richest to the poorest region) finds ratios above seven for the same three nations. Peru is almost a textbook example of scenario A, with one dominant city – Lima – also propitiously located for trade. The Argentine case is less extreme; other large cities exist, though none comes close to equaling Buenos Aires. However,
12
For the most recent year (2001) Peru is ranked either in the number or two spot, while Argentina is consistently in the number two spot. However, Argentina‘s position improves once the indicator is weighted by regional population size.
consistent with scenario A, regions in Argentina‟s “distant” northwest, poorly located for trade, systematically register per capita incomes several multiples below that of the capital (Cao and Vaca 2006). Brazil also fulfils most of the conditions of scenario A, where both the forces of agglomeration and of trade point south.
The North American and European experience also brings out the role of trade corridors and of the forces of agglomeration at a continental level. South America‟s densest core of economic activity – an area roughly delimited by Belo Horizonte to the north and Buenos Aires to the south – recalls Europe‟s Blue Banana. By the same token, the growing strength of the Chilean economy heralds the possible emergence of a bi-polar (by-coastal) model, at least in the southern cone, recalling the US experience. We can thus (cautiously) predict that a consolidation of trade links (together with necessary transport infrastructures) between Argentina and Chile, but also between the continental core and other parts of the continent should contribute to the reduction of regional inequality in Argentina and possibly also in Peru. Current investments in transport infrastructures linking Brazil‟s urbanized south with Bolivia and Peru are a step in the right direction. Recalling the fate of North America‟s declining landlocked center, the challenge is the reduction in size of South America‟s “peripheral” interior.
Finally, North America and Europe teach us that the most intractable regional problems are often linked to economies built on natural resource rents (coal and iron ore yesterday, oil today) that historically generated high-wage jobs; that is, relative to the rest of the national economy. Local economies built on high-rent natural resource create income and jobs, but can also distort local labor markets, undermining the region‟s competitiveness, making it difficult to diversify into other industries and build a sustainable economic base. The economic landscapes of North America and Europe are scattered with mining communities and old industrial cities that are unable to compete in the modern knowledge economy; a useful warning for Latin America, where numerous growing local economies are founded on mining, oil or natural gas, and where heavy industry often looms large.
References
APPARICIO P., G. DUSSAULT, M. POLÈSE and R. SHEARMUR. 2007. Transport Infrastructures and
Local Economic Development: A Study of the Relationship between Continental Accessibility and Employment Growth in Canadian Communities. INRS, Montreal : http://projetic.ucs.inrs.ca
BARRO, R.J and X. SALA-I-MARTIN. 1995. Economic Growth, 2nd Edition, McGraw Hill, New York. BEA (on line) Bureau of Economic Analysis, U.S. Dept. of Commerce, www.bea.doc.gov/bea/regional
BREINLICH, H. 2006. ―The spatial income structure in the European Union—what role for Economic Geography?‖. Journal of Economic Geography 6(5): 593-617
CAO, H. and J. VACA. 2006. ―Desarollo regional en la Argntina: la centenaria vigenvia de un patrón de asimettría territorial―. EURE: Revista Latinoamericna de Esudions Urbanas Regionales, Vol. XXX II No 95: pp 95-111
CEPAL. 2010. Panorama del desarrollo territorial en América Latina y el Caribe. Documento de proyecto, Comisión Económica para América Latina y el Caribe (CEPAL), Santiago de Chile.
CHESHIRE, P. C. and S. MAGRINI. 2006. ―Population Growth in European Cities: Weather Matters – But only Nationally‖. Regional Studies, Vol. 40. 1: 23-37.
COULOMBE, S. 2007. ―Globalization and Regional Disparity: A Canadian Case Study‖. Regional Studies 41.1: 1-17
COULOMBE, S. 2000. ―New Evidence of Convergence across Canadian Provinces: The Role of Urbanisation‖. Regional Studies, 34.8: 713-725.
CUADRADO-ROURA J. R. 2001. ―Regional Convergence in the European Union: From Hypothesis to Actual Trends‖. Annals of Regional Science, 35: 333-356
DAVEZIES, L. 2008. La république et ses territoires; La circulation invisible des richesses. Seuil, Paris. DURANTON, G. and V. MONASTIRIOTIS. 2002. ―Mind the gaps: the evolution of regional earnings
inequalities in the U.K., 1982-1997‖. Journal of Regional Science, Vol. 42 (2): pp 219-256.
ECONOMIST, The. 2005. ―The poorest part of America. Not here, surely?‖. The Economist, December 10th 2005: 31-32.
ESQUIVAL G, D. LEDERMAN, M. MESSMACHER, R. VILLORO. 2003.―Why NAFTA Did Not Reach the South‖. In Development Strategy for the Mexican Southern States, World Bank, Washington, D.C. EUROSTAT. 2010. Eurostat Regional Statistic, http://epp.eurostat.ec.europa.eu/portal/page/portal/region
_cities/regional_statistics/data/main_tables
FELSENSTEIN D. and B.A. PORTNOV. 2005. ―Understanding Regional Inequalities in Small Countries‖.
Regional Studies, 39 (5): 647. In FLORIDA, R. 2002. The Rise of the Creative Class, Basic Books,
New York.
FLORIDA, R. 2002. The Rise of the Creative Class. Basic Books: New York. GARREAU, J. 1981. The Nine Nations of North America. Houghton Mifflin, Boston
GEPPERT, K. and A. STEPHAN. 2008. ―Regional disparities in the European Union: Convergence and agglomeration‖. Papers in Regional Science, 87 (2): 193-217.
GODCHILD, and P. HICKMAN. 2006. ‖Towards Regional Strategy for the North of England? An Assessment of the ‗Northern Ways‘‖. Regional Studies, 40 (1): 121-133.
INEGI (on-line) Instituto Nacional de Estadística Geografía e Informática www.inegi.gob.mx/inegi/ default.aspx.
KANBUR, K. and A.J. VENABLES. 2005. Spatial Inequality and Development. Oxford University Press, Oxford.
KRUGMAN, P. 1991. ―Increasing Returns and Economic Geography‖. Journal of Political Economy, 99, 3: 483-499.
LUCAS, R. 1988. ―On the Mechanics of Economic Development‖. Journal of Monetary Economics, 22: 3-42.
MELICIANI, V. 2006. ―Income and Employment Disparities across European Regions: The Role of National and Spatial Factors‖. Regional Studies 40 (1): 75 -91.
MYRDAL, G. 1957. Economic Theory and Underdeveloped Regions. Harper Torchbooks, New York. NIEBUHR, A. 2006. ―Market access and regional disparities‖. The Annals of Regional Science, 20 (2):
313-334.
PAELINCK, J. and M. POLÈSE. 1999. ―Modeling the Regional Impact of Continental Economic Integration: Lessons from the European Union for NAFTA‖. Regional Studies, Vol. 33, no 8: 727-738. PECK, J. and K. WARD. 2002. ―Placing Manchester‖ in PECK, J. and K. WARD. 2002. City of Revolution:
Restructuring Manchester, Manchester University.
PETRAKOS, G., A. RODRÍGUEZ-POSE, and A. ROVOLIS. 2005. "Growth, integration, and regional disparities in the European Union". Environnement and Planning A, 37 (10): 1837-1855.
POLÈSE, M. 2009. The Wealth and Poverty of Regions: Why Cities Matter. University of Chicago Press. POLÈSE, M. and R. SHEARMUR. 2006. ‖Growth and Location of Economic Activity: The Spatial
Dynamics of Industries in Canada 1971-2001‖. Growth and Change, 37 (3): 362-395.
POLÈSE, M. and R. SHEARMUR. 2006a. ―Why Some Regions will Decline: A Canadian Case Study with Thoughts on Local Economic Development‖. Papers in Regional Science, 85 (1): 23-46.
POLÈSE, M, F. RUBIERA-MOROLLÓN and R. SHEARMUR. 2007. ―Observing Regularities in Location Patterns: An Analysis of the Spatial Distribution of Economic Activity in Spain‖. European Urban and
Regional Studies, 14 (1): 157-180.
PUGA, D. 1999. ―The rise and fall of regional inequalities‖. European Economic Review 43(2): 303-334. RAMÍREZ, J.C., I. SILVA-LIRA and L.M. CUERVO. 2009. Economía y territorio en Latin América y el
caribe. CEPAL, Santiago de Chile.
RAMÓN-BERJANO, C. 2010. ―Argentina: Regional Development and Evolution of Disparities‖. Regions, no 279: 26-29.
RAPPAPORT, J. 2007. ―Moving to nice weather‖. Regional Science and Urban Economics, 37 (3): 375-398.
RAPPAPORT J. and S. SACHS. 2003. ―The United States as a Coastal Nation‖. Journal of Economic
Growth, Vol. 8: 5-46.
RODRÍGUEZ-POSE, A. and N. GILL. 2004. ―Is there a global link between regional disparities and devolution?‖. Environment and Planning A, 36, no 12 : 2097-2117
RODRÍGUEZ-POSE, A. and J. SÁNCHEZ-REAZA. 2005. ―Economic Polarization thrrough Trade: Trade Liberalization and Regional Inequality in Mexico‖ in KANBUR and VENABLES op cit.
ROMER, P. 1986. ―Increasing Returns and Long-Run Growth‖. Journal of Political Economy, 94: 1002-1037.
SHEARMUR, R. and M. POLÈSE. 2005. La géographie du niveau de vie au Canada, 1971-2001. INRS, Montreal, www.ucs.inrs.ca/default.asp?p=rr.
SHEARMUR, R. and M. POLÈSE. 2007. ―Do Local Factors Explain Local Employment Growth: Evidence from Canada 1971-2001‖. Regional Studies, 41 (4): 453-471.
SILVA-LIRA, I. 2003. Disparidades, competividad territorial y desarrollo local regional en América Latina. Serie Gestión pública 33, CEPAL, Santiago de Chile.
25
STAT. CAN. (periodic) Provincial Economic Accounts. Catalogue # 13-213, Statistics Canada, Ottawa. WILLIAMSON, J.G. 1965. ―Regional Inequality and the Processes of National Development : A Description
27
29