Publisher’s version / Version de l'éditeur:
Applied Spectroscopy, 50, 8, pp. 970-976, 1996
READ THESE TERMS AND CONDITIONS CAREFULLY BEFORE USING THIS WEBSITE. https://nrc-publications.canada.ca/eng/copyright
Vous avez des questions? Nous pouvons vous aider. Pour communiquer directement avec un auteur, consultez la
première page de la revue dans laquelle son article a été publié afin de trouver ses coordonnées. Si vous n’arrivez pas à les repérer, communiquez avec nous à PublicationsArchive-ArchivesPublications@nrc-cnrc.gc.ca.
Questions? Contact the NRC Publications Archive team at
PublicationsArchive-ArchivesPublications@nrc-cnrc.gc.ca. If you wish to email the authors directly, please see the first page of the publication for their contact information.
NRC Publications Archive
Archives des publications du CNRC
This publication could be one of several versions: author’s original, accepted manuscript or the publisher’s version. / La version de cette publication peut être l’une des suivantes : la version prépublication de l’auteur, la version acceptée du manuscrit ou la version de l’éditeur.
Access and use of this website and the material on it are subject to the Terms and Conditions set forth at
Comparison of IR techniques for the characterization of construction
cement minerals and hydrated products
Delgado, A. H.; Paroli, R. M.; Beaudoin, J. J.
https://publications-cnrc.canada.ca/fra/droits
L’accès à ce site Web et l’utilisation de son contenu sont assujettis aux conditions présentées dans le site
LISEZ CES CONDITIONS ATTENTIVEMENT AVANT D’UTILISER CE SITE WEB.
NRC Publications Record / Notice d'Archives des publications de CNRC:
https://nrc-publications.canada.ca/eng/view/object/?id=cb50a727-d24b-4903-bb49-dd0eba541eeb https://publications-cnrc.canada.ca/fra/voir/objet/?id=cb50a727-d24b-4903-bb49-dd0eba541eebhttp://www.nrc-cnrc.gc.ca/irc
Com pa rison of I R t e c hnique s for t he c ha ra c t e riza t ion of c onst ruc t ion
c e m e nt m ine ra ls a nd hydra t e d produc t s
N R C C - 3 9 0 0 8
D e l g a d o , A . H . ; P a r o l i , R . M . ; B e a u d o i n , J . J .
S e p t e m b e r 1 9 9 6
A version of this document is published in / Une version de ce document se trouve dans:
Applied Spectroscopy, 50, (8), pp. 970-976, 1996
The material in this document is covered by the provisions of the Copyright Act, by Canadian laws, policies, regulations and international agreements. Such provisions serve to identify the information source and, in specific instances, to prohibit reproduction of materials without written permission. For more information visit http://laws.justice.gc.ca/en/showtdm/cs/C-42
Les renseignements dans ce document sont protégés par la Loi sur le droit d'auteur, par les lois, les politiques et les règlements du Canada et des accords internationaux. Ces dispositions permettent d'identifier la source de l'information et, dans certains cas, d'interdire la copie de documents sans permission écrite. Pour obtenir de plus amples renseignements : http://lois.justice.gc.ca/fr/showtdm/cs/C-42
Comparison of
IR
Techniques for the Characterization of
Construction Cement Minerals and Hydrated Products
ANA. H. DELGADO, RALPH M. PAROLI,* and JAMES J. BEAUDOIN
Institute for Research in Construction, National Research Council of Canada, Ottawa, Ontario KiA OR6, CanadaThe influence of FT-IR sampling techniques on the characterization of cement system", was investigated. Three FT-IR techniques were
used to study tricalcium silicate (C3S), hydrated C3S, calcium hy-droxide, and calcium silicate hydrate (C-S-H). They include
trans-mission spectroscopy (TS), photoacoustic spectroscopy (PAS), and
diffuse reflectance infrared Fourier transform spectroscopy (DRIFTS). The TS technique (using KBr pellets) was the most la-bor-intensive but was found to give the simplest spectra with well-defined bands. The PAS technique was found to be the simplest technique but yielded bands at lower wavenumber than TS. DRIFTS was determined to be a good alternative for cement pow-ders since it provided spectra similar to those for the TS technique. DRIFTS required more sample preparation than PAS but less sam-ple preparation than the KBr pellet technique.
Index Headings: Portland cementj Tricalcium silicate (C3S)j Calcium silicate hydrate(C-S-H);Fourier transform infrared (FT-IR) troscopy; Transmission spectroscopy (TS); Diffuse reflectance spec-troscopy (DRIFTS); Photoacoustic specspec-troscopy (PAS).
INTRODUCTION
Investigation of existing buildings, or the testing of the materials from which they are constructed, constitutes a high proportion of work in the construction area. This area requires the availability of a wide range of testing techniques capable of providing detailed information on both the chemical and physical conditions of the cons tit-nent materials of the building structure. These techniqnes are needed to detect cracking, voids, corrosion, or other forms of degradation and to identify the reason for such problems. In most cases, these investigations involve ex-isting residential and/or commercial buildings. Therefore, it is necessary to use nondestructive techniques to obtain quick and accurate information without causing damage to the finish and decoration of the structure. Hence, there is a continuous need for developing new analytical tech-niques or adapting existing ones.
Cement is one of the most common building materials in the construction industry. Ordinary Portland cement (OPC) is obtained by heating to approximately
1300-1450 °C a mixture of calcareous and argillaceous raw materials and grinding it. The calcareous materials, whose main constituent is calcium carbonate, include limestone, chalk, marlsea shells, etc. Magnesium and oth-er alkaline earth carbonates also occur in considoth-erable quantities in dolomitic and other low-grade limestones, The argillacous materials, on the other hand, are mainly clays with a widely varying composition, Tricalcium sil-icate (C3S) and l3-dicalcium silicate (C,S) are the
impor-tant silicate minerals in Portland cement.) These two
sil-Received 24 April 1995; accepted 7 March 1996.
*Author to whom correspondence should be sent.
icates together make up 70-80% of the Portland cement.' However, the main component is tricalcium silicate (3CaO·SiO,),t which imparts strength. Gypsum or CSH, (CaS04·2H,O) is added to cement in small amounts to control the setting properties of the cement. Portland ce-ment, as ordinarily prepared, is a fine-grained mnltiphase material with four major phases. The phases are sum-marized in Table I.
Table I shows the complexity of the Portland cement material, which becomes even more complex npon hy-dration. Calcium silicate hydrate is formed upon hydra-tion of alite (C3S, which contains Fe, AI, Mg, Cr, and Zn) and belite (C2S, where Ca is replaced by Na, AI, Mg, K, Cr, and Mn).' The principal hydration products of OPC are calcium silicate hydrate (C-S-H), calcium hy-droxide, ettringite, andlor the monosulphate/C4AH13solid
solution. To understand the complex reactions occurring during the hydration process of cement, it is important to know the hydration behavior of its individnal compo-nents, For example, tricalcium silicate reacts with a lim-ited amount of water and forms calcium silicate hydrates of given composition CxSxH, and Ca(OH),. Most of the hydration reaction occurs within a month. However, com-plete hydration occurs only after several years under nor-mal curing conditions. In a fully hydrated C3S paste,
about 60-70% of the solid is C-S-H2
The following reactions illustrate the basic hydration process of C3S:'
3CaO·SiO,
+
xH,O --> YCaO·Si02·(x+y-3)H,O+
(3-y)Ca(OH), (I)generally represented as:
2[3CaO·Si02]
+
7H,O --> 3CaO·2SiO,AH20+
Ca(OH)2. (2)The amonnt of Ca(OH)2 produced in the hydration of C2S is less than in C3S. The dicalcium silicate phase
hy-drates much more slowly than the tricalcium silicate phase. The stoichiometry of the above chemical reaction is not completely known, since it is difficnlt to estimate
the composition of CIS and HIS ratios. According to
Bensted,3 in the C-S-H gel-like solid formed upon hy-dration, the CaO:SiO, ratio is close to 1.5; however, de-pending on the nature of the cement, water/cement ratio, and temperature, this composition can change from 1.5 to 1.8.
Various analytical techniques have been used to study cement and its hydration products. They inclnde thermal analysis (e.g., DTA),4..6 solid-state high-resolution 29Si
NMR, X-ray diffraction,7,8 infrared spectroscopy,3.4,5,8-17
t Mineralogical notation isllsedin cement chemistry, Le" C = CaO; S
= SiOz; H = H20; S= 503'
TABLE I. Major phases present in Portland cemenU Tricalcium silicate (3CaO,Si02)
Alite (or substitutedC3S) Dicalcium silicate (2CaO,SiOz) Belite (or substituted CzS) Tricalcium aluminate (3CaO·Alz03) Ferrite 4CaO·Alz03·Fez03
Other components
aSee Refs.2 and 3,
C3S (is a synthesized product).
C3S which contains Fe, AI,Mg, Cr. and Zn, Once hydrated, will provide strength to cement.
CzS is primarilyセM、ゥ」。ャ」ゥオュN
CzS where Ca is replaced by Na, AI.Mg,K, Cr, and Mn.
C3A.
C4AF is a solution of average composition fromezFtoC6AzR
Sulfates resulting from the addition of 4% gypsum CaS04,2HzO(CSHz)to clinker during grinding.
scanning electron microscopy (SEM),"·13 Raman,'·l6 and Fourier transform (FT)-Raman microspectroscopyl'
Infrared spectra in the transmission spectroscopy (TS) mode of cements and related materials have been ob-tained by using the traditional KBr or Nujol mull sam-pling techniques. Bensted and his co_worker3- 4,10-13,16
have studied hydration behavior of cements using both the KBr pellet and Nujol mull techniques. Infrared spec-tra obtained of 'Y- and I3-C,S, C,S, and the hydration products of the latter have been obtained by using the ),';:I3Illlld NaCI prism.' Ramirez et al.l7have also used the
pellet technique to study simulated corrosion of reinforc-ing steel in concrete by salt intrusion. In the last decade, new infrared sampling techniques, such as ATR, have been shown to be useful in the analysis of the cement of variable composition." Recently, Bonen et aI.I ' analyzed commercial and synthetic clinker minerals by Fourier transform infrared (FT-IR) and FT-Raman microspectros-copy. In spite of this, the KBr pellet and the Nujol mull techniques continue to be the most widely used. KBr pel-let, however, is very time-consuming, and Nujol mull can obliterate crucial IR regions.
Specimen preparation can be reduced greatly by using other IR sampling techniques such as photoacoustic (PAS) or diffuse reflectance infrared Fourier transform spectroscopy (DRIFTS). These techniques not only pro-vide spectral information similar to that obtained by TS but also reduce sample preparation and analysis time.
Because of the complexity of the OPC system, it is difficult to study the hydration process of individual com-ponents (the hydration reaction of one component may be hindered by another). For example, hydration of the tricalcium aluminate (C,A) occurs very quickly,
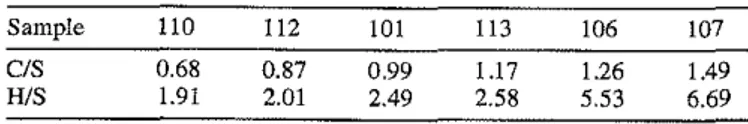
interfer-TABLE II. C-S-H preparations.a
Sample 110 112 101 CIS 0.68 0.87 0.99 HIS 1.91 2.01 2.49 aSee Ref. 6. 113 1.17 2.58 106 1.26 5.53 107 1.49 6.69
ing with the hydration of C,S. The latter, upon hydration, is responsible for strength; thus, it is important to isolate and understand the hydration process. This procedure is greatly facilitated through the use of pure calcium silicate hydrate in research investigations.
In this study, synthetic C,S and calcium silicate
hy-drate (C-S-H) of different CIS and HIS compositions
were prepared in the laboratory' and studied by infrared spectroscopy with the use of different sampling tech-niques. Results obtained from FT-IR analysis of pow-dered synthetic C,S, calcinm hydroxide, and six C-S-H preparations with the use of three techniques-TS, PAS, and DRIFTS-are presented and compared.
EXPERIMENTAL
Synthetic C,S and six synthetic calcium silicate hy-drate preparations with a wide range ofCIS and HIS ra-tios (supplied by Lafarge Coppee Recherche, France) were studied. Details of specimen preparation have been described elsewhere.' Hydrated C,S with a waterlsolid ratio of 0.5 was also studied. TheCIS and HIS ratios of six C-S-H preparations are given in Table. II. Powdered tricalcium silicate (C,S), calcium hydroxide, and the six calcium silicate hydrate (C-S-H) preparations were an-alyzed by FT-IR spectroscopy using three sampling tech-niques: TS (KBr pellet), PAS, and DRIFTS. The analysis was performed with a Nicolet FT-IR (Model 800) con-nected to a Balston air dryer (Model 75-60).
KBr pellets were prepared as follows: We mixed 750 mg of KBr crystals, ground with 2 or 5 mg of sample. Approximately half of the KBrlsample mixture was trans-ferred to a l3-mm-diameter die, placed under vacuum in a RIIK 25-ton ring press for 10 min. The mixture was pressed under vacuum with a load of 10 tons for 2 min, released, pressed to 10 tons for 30 s, released, and pressed again for 30 s.
The photoacoustic spectra were obtained with an MTEC photoacoustic cell (Model 200). Samples were an-alyzed without any sample preparation, except for slight
TABLEill. Experimental parameters for theFT-IRanalysis.
Techniques Parameters Detector Number of scans Resolution Background
Mirror setting (velocity) Purgegas -_.._.. __...⦅MセN ---...----r---Thansmission (KBrpellet) DTGS 32 4 cm-1 KEr pellet 30 (0.63 em/,) Dry air Diffuse reflectance (DRIFTS) (SH003 option) Photoacoustic 128 4cm-1 KBr Powder 10 (0.16em/,) Helium(5roLls) Photoaealistic (PAS) Photoacoustic 128 8cm-)
MTEC carbon black standard reference membrane 20
(0.32em/,)
Helium (5 tnL/s)
MMMセMMMMMMMMMMMMMM
Tricnkillm SiHca!e/KBrpellet Calcium Cal'bonate
500 460 874 1000
[IJ
3640 2981 2873 2AI2 I Mセャ "", MMセセiG]GセG[][BセZZZZMセ 4000 3500 3000 2500 2000 Wavenumbers (cm-1) 500 940 9\°8 8 83 527 453 813 I , w r w p ' F " セセセN 2500 2000 1500 1000 Wavenumber!>H」ュセャI I 3000 3500 4000FlO, 1. Infrared spectrum of tricalcium silicate obtained by TS,
grinding of the hydrated C3S. Powdered samples were
placed in a lO-mm-diameter stainless steel pan and scanned. The background was scanned with the use of a carbon black standard reference membrane under the same conditions as the sample. Helium was used as a purge gas at a flow rate of 5 mLls.
The diffuse reflectance spectra were obtained with the DRIFTS sample head option SH003 on the MTEC Model 200 photoacoustic cell. Samples were diluted to approx-imately 1% by weight with KBr crystals and ground to a powder for about a minute. All spectra were ratioed against a background obtained from pure ground KBr scanned the same day. Helium gas (5 mLls) was used to purge the sample.
Experimental parameters used with each FT-IR tech· nique are summarized in Table III. The DRIFTS spectra were converted to Kubelka-Munk units by using the KLB routine from the SX Nicolet software. The auto-matic or manual baseline-correction normalize routines from the OMNIC software (Nicolet Instruments) were used to correct the baseline of the spectra before plotting. All stack spectra were normalized before plotting.
FIG. 3. Infrared spectrum of calcium carbonate obtained by PAS.
RESULTS AND DISCUSSION
The infrared absorption spectrum of C3S obtained by
using the KBr pellet technique is displayed in Fig. 1. The spectrum shows a strong broad band in the 1200-800-em-I region, with maxima at 940, 908, and 883 」ュセャL
and two sharp bands at 813 and 527 em-I. The bands in
the QRPPMXPPM」ュセQ region and that at 813 em-I can be
attributed to the antisymmetrical and symmetrical stretch-ing vibrations of Si04 , respectively, whereas the band at
527 cm- I is ascribed to the out-of-plane bending vibra-tions of Si04 •The bands below 500 cm-1 are due to the
in-plane bending vibration of Si04 • Such bands are
typ-ical for anhydrous trtyp-icalcium silicate.1
•3The spectrum also
shows a broad and unresolved band between 1600 and 1400 」ュセャ and another weak one at セSVTP em-I. The latter can hardly be seen, because of the scale used. These bands do not result from any pure C3S vibrations. The
band at 3640 cm-1 is typical of free OH groups. This
observation suggests that the C3S may have been partially
hydrated. The 3640-cm-1band is useful for diagnosis of
the initiation of the hydration process.3 It has also been
I
Iャ⦅セセ
セpZLLZLa]s
QTセセ
_ _87S---, Calcium HydrOXide 400 600 800 C-S-H·l07 C-S-H-106 C-S-B-ll3 8 1j
C-S-H-101 C-S-H-1I2 C-S-H-lto CJS(w/so.s) C.S 2200 2000 1800 1600 1400 1200 1000 Wavenurnbers(em- l) 500 874 1000 2500 . 2000 1500 Wavenombers(em-I) 1414 KBr DRlFl' 3000 3500 3640 4000FIG. 2. Infrared spectrum of calcium hydroxide obtained by TS,
DRIFTS, and PAS techniques.
FIG.4. Infrared spectra of cement preparations obtained byTSin the
RRPPMTPPM」ュセQ region.
972 Volume 50, Number 8, 1996
T--TABLEV. IR bands(em-I)for 110 and 112byKBr, DRIFTS and PAS techniques.·
C-S-H-107 110 112
C-S-H-106 KBr DRIFTS PAS KBr DRIFTS PAS
C-S-H-Il3 3740W 3743 vw 3483 m,b C-S-H-1Ol 3441 m,b 3425 row 3402 m,b 3436 m.b
セ
3356 m.b 3347 m.b € C-S-H-112 1646 w 1636 w 1635 w 1637 w 1635 w 1634 wセ
1490 m 1490 m 1489 m 1483ill 1483 m 1474 m CoS-HollO 1436 m 1437 m 1429 m 982 vs 978 vs 979vs 974 vs 972vs 964vs 868 sh 867 sh 865 sh 876m 876ill 875ill 667 w 668w 664w 667 w 668 w 667 w c)S(w/so.sl 456 s 457 s 448 s 454 s 445 s 450s c,SaNote: w= weak; vw= very weak;ill = medium; b = broad; mw =
4000 3800 3600 3400 3200 3000 2800 2600 2400 medium weak; vs = very strong; s = strong,
WavenumbersHセュMャI
FIo. 5. Infrared spectra of cement preparations obtainedby TS in the 4000-2400-cm-1region.
reported I' that splitting of the band in the lOOO-850-cm-1
region results from the presence of silicate phases. Since calcium hydroxide is one of the hydration products of Portland cement and C3S, the calcium hydroxide
spec-trum shown in Fig. 2 was obtained by three different sampling techniques. Spectra show bands at 3640 cm- I and between 1600 and 1400 cm-I that are similar to those
observed in the C3S. The spectra obtained by the KEr
technique and by PAS show an unresolved broad band with two maxima (-1480 and 1420 cm- I) in the same spectral range as those at 1473 and 1420 cm-I observed
in Fig. 1. Therefore, the bands between 1600 and 1400 cm-I are likely to be due to hydration of C
3S. The band
maximum may differ slightly from spectrum to spectrum, depending on the broadness of the band. Pressure applied during the KEr pellet preparation, as well as particle size, can affect the band shape (Christiansen effect).
Atmospheric CO, attacks some compounds in cements and its hydration products3 Exposure of cement to CO,
TABLE IV. IR bands (em-') for CJS and CJS(w/sll•S) by KBr,
DRIFTS and PAS techniques."
C,S C3S(w!so.s)
KBr DRIFTS PAS KBr DRIFTS PAS
3640 vw 3642vw 3644 s 3644 m 3641 m 3446 m,b 3364 m.b 1806 w.b 1653 w 1650 w,b 1643 w 1557 w 1473 w 1473 w 1480W 14880 m 1479 m,b 1479 m 1420w 1420 w 1436 sh 1424 m 1387 995 sh 940vs 938 vs 935 s 972vs 965 vs 958 vs 908 m 883 s 884 s 880VB 866 sh 866 sh 861 sh 856 sh 855 sh 813 sh 816 m 814 m 668 w 651 W 668 w 652 w 527 s 522 s 518 s 453 sh 454 sh 450 s 453 s 456s 453 s 440 sh 438 s
• Note: vw = very weak; s = strong; ill = medium; b = broad;w =
weak; sh = shoulder; vs = very strong; s = strong.
results very quickly in carbonation. The calcium carbon-ate spectrum (shown in Fig. 3) was obtained by the PAS technique to determine whether the cement had carbon-ated. The strong bands in thiN600-1300-cm-1region and
at 874 cm-1observed in the spectrum are due to the
anti-symmetrical stretch and out-of-plane bending of the C-O, respectively, and the medium intensity one at 712 cm-I is due to the angular bending of the O-C-O.3 The
medium band at 2512 em-I may be a combination of the 874- and l400-cm-1bands, and that at 1795 cm- I is
prob-ably an overtone of the 874-cm-1band. However, in
min-erals containing hydroxyl ions, the carbonate bands may be displaced to a higher wavenumber. I The spectrum also shows the presence of free OH groups at 3640 cm- I, which can be due to calcium hydroxide impurities; a weak broad band at 3374 em-I, typical of bonded OH; and bands at 2981 and 2873 cm- I, which may be over-tones and combinations of the bands centered at 1444 cm- I. With the exception of the bands at 3640 cm-I and
in the l600-l300-cm-1region, no other carbonate bands
are observed in the C,S spectrum.
A comparison of the spectrum of Ca(OH), and CaC03 with that of C3S suggests that the latter has undergone
mainly hydration rather than carbonation. A level of 1% carbonate in silicates can be easily detected in the
1600-l400-cm-1region. I
TABLE VI. IR bands(em-I) for 101 and 113 by KBr, DRIFTS and PAS techniques."
101 113
KBr DRIFTS PAS KBr DRIFTS PAS
3742 vw 3740vw 3527 m,b 3441 m.b 3433 m.b 3432 m,b 3402 m,b 3323 m.b 3360 m.b 3363 m.b 1789 vw 1789 vw 1652 w 1653 w 1635 w 1635 w 1636 w 1637 w 1488 m 1474 m 1474 m 1481 s 1482 s 1476 s 1437 sh 1427 sh 1423 sh 971 vs 969 vs 959vs 973 vs 969 vs 962vs 875ill 875ill 874m 874 sh 874 sh 867 sh 856ill 856 m 850 m 668 w 668 w 667 w 667w 668 w 665w 480 489 sh 482 sh 481 sh 455 s 457s 439s 455s 448 s 447s
aNote: vw = very weak;ill = medium; b= broad; w= weak; s = strong; sh=shoulder; vs = very strong.
APPLIED SPECTROSCOPY 973
--T---FIG. 7. Infrared spectrum of hydrated tricalcium silicate with a wa-ter/solid ratio of 0,5 obtained by TS, DRIFTS, and PAS techniques.
between 2900 and 2800 em-I. Such bands may result from the solvents used to dry the preparations.
The spectra for each preparation obtained by the three sampling techniques used in this study are shown in Figs. 6-13. The positions of the IR bands for the preparations studied are summarized, with respect to sampling tech-niques, in Tables IV-VII. Each table contains two prep-arations with C-S-H samples given by increasing CIS ratios.
The spectral features for the C3S sample present in the
TS spectrum (Fig. 6) are similar to those present in the DRIFTS and PAS spectra. Similarly, the spectrum for the hydrated tricalcium silicate with a water/solid ratio of0.5
[C3S(w/SO,s)), displayed in Fig. 7, shows similar spectral
bands, regardless of the sampling technique used to col-lect the spectrum. The shifting of the band at -940 em-I
in the anhydrous C3S (Fig. 6), to -970 cm-1for TS and
DRIFTS, and to セYVP cm-1 for PAS in the C
3S(W/SO.5)
spectrum is an indication of hydration of the tricalcium silicate. Shpynova et al.19reported that, after 15 years of
hydration, the 938-cm-1 band that they observed in the
anhydrous C3S gradually shifted to 989 cm-1, whereas
PAS SOO 1000 KBr 2500 2000 ISOO Wav.numbers (em-I) 3000 3500 4000 DRIFT
TABLE VII. IR bandsH」ュセャI for 106 and 107 byKBr, DRIFTS and PAS techniques.'
106 107
KEr DRIFTS PAS KBr DRIFTS PAS
3642 vw 3532 m,b 3543 m,b 3426 m,b 3459 m,b 3429 m,b 3337 m,b 3391 w,b 3319 m,b 3378 w,b 3047 vw,b 2979 vw 2978 vw 2977 vw 2979 vw 2978 vw 2977 vw 2875 vw 2870 vw 2866 vw 2867 vw 2869 vw 2872 vw 1636 w 1636 w 1643 w 1640 w 1658 w 1641 w 1486ill 1483 m 1473ill 1485 m 1489 m 1474 m 1424ill 1426ill 1418ill 1425 m 1427 m 1418ill
138 sh 1386 sh 1112 w 971 vs 968 vs 958 vs 971 vs 962 vs 955 vs 865 w 865 m 860 m 866 w 862 w 860 w 667w 668 m 663 w 671 w 668 w 660 w 491 sh 489 sh 482 sh 505 sh 492 sh 483 sh 456 s 451 s 446 s 466 s 453 s 446s 458
'Note: vw = very weak; m = medium; b =broad; w = weak; sh = shoulder; vs =very strong; s= strong.
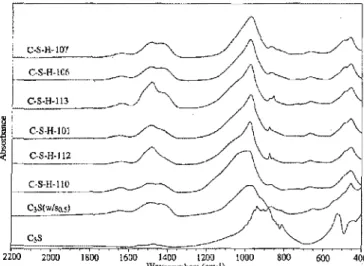
A general overview of the cement spectra, from 2200 to 400 cm-I obtained by TS and the use of the KBr pellet
technique, is displayed in Fig. 4. The spectra show that, as the CIS ratio increases, the broad band at -940 cm-1
due to stretching vibration of the Si04 not only becomes
nan'ower but also shifts to higher wavenumber. In addi-tion, a weak band in the 1600-1500-cm-1 region starts
to appear, whereas the 500-cm-1band almost disappears.
Figure 5 displays the 4000-2400-cm-1 region for the
spectra shown in Fig. 4. As can be observed, the free OH band in the hydrated C3S spectrum with a water/solid
ratio of 0.5 is more intense than in other spectra. The DRIFTS and PAS spectra displayed a similar trend in both regions. In general, the spectra obtained by the three different sampling techniques do not differ greatly from one sampling technique to another. This result suggests that either technique can be used to study the hydration of cement. Itis important to note that almost all spectra, regardless of the sampling technique used, show bands
CoS-HollO DRlFr PAS 500 K8r 2500 2000 1500 Wavenumbers (em-I) 3000 3500 4000 DRIFT PAS 500 1000 2500 2000 1500 Wavenumbelll (em-I) KBr 3000 3Soo 4000
FIa. 6. Infrared spectrum of tricalcium silicate obtained by TS, DRIFTS, and PAS techniques.
FIG. 8. Infrared spectrum of C-S-H-110 obtained by TS, DRIFrS, and PAS techniques.
974 Volume 50, Number8, 1996
C-S-H-1l2 C-S-H-I13 DRIFT PAS 500 1000 2500 2000 1500 Wavenurnbers(em-I) KBr 3000 3500 4000 PAS DRIFT 500 1000 KBr 2500 2000 1500 Wavenumber!(em-I) 3000 3500 4000
FlG. 9. Infrared spectrum of C-S-H-1I2 obtained by TS, DRIFTS, and PAS techniques.
FIG. 11. Infrared spectrum of C-S-H-113 obtained by TS, DRIFTS, and PAS techniques.
the band at 878 cm-I remained unaffected. A similar shift
was also observed by Bensted and Varma.20 Other
spec-tral bands observed in Fig. 7 are the free OR stretching absorption bands at セSVTP cm-'I resulting from the
cal-cium hydroxide; the broad band in the 3500-3200-cm-1
region from the OR stretching vibrations of the C-S-H; and a weak broad band at セ 1650 em- I , which may be
assigned to the water bending vibrations.3The shifting of
the 940-cm-1band to higher wavenumber in the C-S-H
suggests the possibility of continuous changes in the C3S
structure as hydration takes places. Hence, a more com-pact and highly condensed framework may form, result-ing in changes in molecular interactions. Another indi-cation of hydration is the 500-cm-1band observed in Fig.
6, which is noticeably absent in Fig. 7. The chemical environment of the bending vibrations of the bonds changes as hydration occurs. This factor is probably re-sponsible for the appearance of a well-defined band at -460 em-I. Bensted3 has reported that IR bands below 600 cm-I observed in the C-S-H spectrum are wide and
flattened, indicating poor crystallinity; such bands are not suitable for characterization purposes. In addition, he
re-ported that broad bands in the C-S-H spectrum are con-sistent with the presence of poorly crystalline, nonstoi-chiometric, gel-like solid.
The infrared spectra obtained by using the KBr pellet technique (TS), DRIFTS, and PAS for preparations with
CiSratios of 0.68 (C-S-H-llO) and 0.87 (C-S-H-112), respectively, are displayed in Figs. 8 and 9. In general, the IR bands observed for the two preparations show bands similar to those observed in Fig. 7, with the ex-ception of the band at セVVP em-I, which is absent in the previous spectrum. The sharp peak superimposed in the DRIFTS spectrum at セVWP cm-l can be attributed
to atmospheric CO2 , as was observed by Ghosh and
Chatterjeel5 during the analysis of Portland cement by
attenuated total reflectance (ATR). They attributed this band to atmospheric CO2 _The main band at セVVP cm-l
can, however, be attributed to the Si-O-Si symmetric vibrations.18
Figures 10-13 display the spectra for the remaining four preparations studied. Once again, IR bands for the different preparations obtained by TS are also observed in the DRIFTS and PAS spectra. Generally, the bands in
CoS-HoWl C·S-H-106 DRIFT PAS soo 1000 KBr 2500 2000 1500 Wavenumber.(em-I) 3000 3500 4000 PAS DRlFf 500 1000 KBf 2500 2000 1500 Wavenumbers (em-') 3000 3500 4000
FIG. 10. Infrared spectrum ofcMsMhセャoャ obtained by TS, DRIFTS, and PAS techniques.
FIG. 12. Infrared spectrum of C-5-H-106 obtained by TS, DRIFTS, and PAS techniques.
APPLIED SPECTROSCOPY 975
---(J
sults of this study: The 3640-cm-1 band contains OH
stretching vibrations of Ca(OH)2' The 3450-cm- 1 band is attributed to OH stretching vibrations of the C-S-H. The
QWPPMQUPPM」ュセQ band corresponds to the bending of the
OH groups in the C-S-H and may be representative of hydrated samples. The 1200-800-cm-1 region is
attrib-uted to the stretching vibrations of Si04 , and the
500-400-cm-1region is associated with the bending vibration
of Si04 •
ACKNOWLEDGMENTS
The authors are grateful Mr. Bob Myers for preparing the cement mixtures and to Ms. Genevieve Sauve for her assistance in acquiring some of the data presented in this paper.
1. Infrared Spectroscopy for Characterization and Evaluation 'of
Ce-ments and Related Materials (Cement Research Institute of India,
New Delhi, RB-6-76, 1976), pp. 1-48.
2. V S. Ramachandran and R. F. Feldman, "Cement Science", in
Concrete Admixtures Handbook: Properties, Science, and Tech-nology, V S. Ramachandran, Ed. (Noyes Publications, Park Ridge, New Jersey, 1984), Chap. l.
3. J. Bensted, "Applications of Infrared Spectroscopy to Cement Hy-dration", paper delivered at the Construction Materials Group and Institute of Materials Meeting on Techniques for Characterization of Cement Hydration, London (1994) (Society of Chemical Indus-try).
4. J.Bensted and S.P.Varma, Cement Techno!. 5,440 (1974).
5. J.Bensted, World Cement Techno!. 11,395 (1980).
6. J. J. Beaudoin, V S. Ramachandran, and R. F. Feldman, Cement and Concrete Res.20, 875 (1990).
7. G. M. M. Bell, J. Bensted, F. P. Glasser, E. E. Lachowski,D. R. Roberts, and M. J. Taylor, Adv. Cement Res.3, 23 (1990). 8. J.D. Ortego,Y.Barroeta,F. K.Cartiedge, and H. Akhter, Environ.
Sci. Techno!.25, 1171 (1991).
9. Ch. M. Hunt, "Chemistry of Cement", in Proceeding of the Fourth
International Symposium Monograph 43 (United States Department
of Commerce, National Bureau of Standards, Washington, D.C. Va!. 1, 1962), p. 297.
10. J. Bensted, World Cement Techno!. 10,404 (1979). 11. 1.Bensted, World Cement Techno!. 8, 171 (1977). 12. J. Bensted, World Cement Techno!. 13, 117 (1982). 13. J. Bensted, World Cement Techno!. 13, 85 (1982). 14. J. Bensted,IICementa87,137 (1993).
15. S. N. Ghosh and A. K. Chatteljee, J. Mat. Sci. Lett. 10, 1454
(1975).
16. J. Bensted and S. P. Varma, Cement Techno!.5,256 (1974). 17. C.W. Ramirez, B. Borgard, D. Jones, andR. C. Heidersbach, Mat.
Performance December, 33 (1990).
18. D. Bonen, T J. Johnson, and S. L. Sarkar, Preprint: Cement and Concrete Res. 24, 959 (1994).
19. L. G. Shpynova, V. 1. Sinen'kaya, V 1. Chikh, and 1. 1. Nikonets, "Formation of 13-C2S and C,S Cement Stone Microstructure",
pa-per delivered at the VI International Congress on the Chemistry of Cement, Moscow (1974).
20. 1.Bensted and S.P.Varma, Cement Techno!. 5, 378 (1974).
Soo 1000 PAS DRIFI' KBr 2SOO 2000 1500 Wavenumbers (em-I) 3000 3500 4000
FlG. 13. Infrared spectrum of C-S-H-I07 obtained by TS, DRIFTS, and PAS techniques.
the PAS spectra seem to appear at a slightly lower wave-number than those in the TS and DRIFTS spectra.
CONCLUSION
C-S-H-I07
The IR spectra obtained by the TS technique are sim-pler and have better-defined bands than those obtained by either the DRIFTS or the PAS technique. However, the TS technique is very labor-intensive. The results suggest that DRIFTS is a good alternative for powdered samples such as cement, even though it gave slightly noisier spec-tra than the other two. It requires less sample preparation than the TS technique. The PAS technique was found to be the easiest technique of the three, since it requires hardly any sample preparation. The IR bands of the spec-tra obtained by this technique appeared at slightly lower wavenumber than those in TS and DRIFTS.
A comparison of the spectra obtained by the three FT-IR techniques leads to the conclusion that, although some small differences are observed in the spectra, any of the three techniques can be used to study cement and the associated hydration products. PAS was the easiest tech-nique. PAS bands were found to occur at lower wave-number than those from the KBr pellet and DRIFTS tech-niques. DRIFTS was found to be a good alternative for cement powders. DRIFTS requires more sample prepa-ration than PAS but much less than the KBr pellet tech-nique.
The following conclusions may be drawn from the