Publisher’s version / Version de l'éditeur:
Analytical and Bioanalytical Chemistry, 396, 3, pp. 1037-1044, 2010-01-01
READ THESE TERMS AND CONDITIONS CAREFULLY BEFORE USING THIS WEBSITE.
https://nrc-publications.canada.ca/eng/copyright
Vous avez des questions? Nous pouvons vous aider. Pour communiquer directement avec un auteur, consultez la première page de la revue dans laquelle son article a été publié afin de trouver ses coordonnées. Si vous n’arrivez pas à les repérer, communiquez avec nous à PublicationsArchive-ArchivesPublications@nrc-cnrc.gc.ca.
Questions? Contact the NRC Publications Archive team at
PublicationsArchive-ArchivesPublications@nrc-cnrc.gc.ca. If you wish to email the authors directly, please see the first page of the publication for their contact information.
NRC Publications Archive
Archives des publications du CNRC
This publication could be one of several versions: author’s original, accepted manuscript or the publisher’s version. / La version de cette publication peut être l’une des suivantes : la version prépublication de l’auteur, la version acceptée du manuscrit ou la version de l’éditeur.
For the publisher’s version, please access the DOI link below./ Pour consulter la version de l’éditeur, utilisez le lien DOI ci-dessous.
https://doi.org/10.1007/s00216-009-3205-y
Access and use of this website and the material on it are subject to the Terms and Conditions set forth at
Coupled thermogravimetry, mass spectrometry, and infrared
spectroscopy for quantification of surface functionality on
single-walled carbon nanotubes
Kingston, Christopher T.; Martínez-Rubí, Yadienka; Guan, Jingwen; Barnes,
Michael; Scriver, Christine; Sturgeon, Ralph E.; Simard, Benoit
https://publications-cnrc.canada.ca/fra/droits
L’accès à ce site Web et l’utilisation de son contenu sont assujettis aux conditions présentées dans le site LISEZ CES CONDITIONS ATTENTIVEMENT AVANT D’UTILISER CE SITE WEB.
NRC Publications Record / Notice d'Archives des publications de CNRC:
https://nrc-publications.canada.ca/eng/view/object/?id=3bfbe990-275e-4a6b-b8b7-c18dd5751914 https://publications-cnrc.canada.ca/fra/voir/objet/?id=3bfbe990-275e-4a6b-b8b7-c18dd5751914
ORIGINAL PAPER
Coupled thermogravimetry, mass spectrometry, and infrared
spectroscopy for quantification of surface functionality
on single-walled carbon nanotubes
Christopher T. Kingston&Yadienka Martínez-Rubí&
Jingwen Guan&Michael Barnes&Christine Scriver&
Ralph E. Sturgeon&Benoit Simard
Received: 30 June 2009 / Revised: 18 September 2009 / Accepted: 29 September 2009 / Published online: 17 October 2009 # 2009 Environment Canada
Abstract We have successfully applied coupled ther-mogravimetry, mass spectrometry, and infrared spectros-copy to the quantification of surface functional groups on walled carbon nanotubes. A high-purity single-walled carbon nanotube sample was subjected to a rapid functionalization reaction that attached butyric acid moieties to the nanotube sidewalls. This sample was then subjected to thermal analysis under inert desorption conditions. Resultant infrared and mass spectrometric data were easily utilized to identify the desorption of the butyric acid groups across a narrow temperature range and we were able to calculate the degree of substitution of the attached acid groups within the nanotube back-bone as 1.7 carbon atoms per hundred, in very good agreement with independent analytical measurements made by inductively coupled plasma optical emission spectrometry (ICP-OES). The thermal analysis technique was also able to discern the presence of secondary functional moieties on the nanotube samples that were
not accessible by ICP-OES. This work demonstrates the potential of this technique for assessing the presence of multiple and diverse functional addends on the nanotube sidewalls, beyond just the principal groups targeted by the specific functionalization reaction.
Keywords Single-walled carbon nanotubes .
Functionalization . Thermogravimetric analysis . ICP-OES . TG-MS-FTIR
Introduction
Single-walled carbon nanotubes (SWCNT) have garnered an ever increasing amount of attention by researchers of diverse backgrounds over the past 15 years thanks to their promise of delivering new generations of high-performance materials and technologies [1, 2]. Although substantial progress has been demonstrated on many fronts, new technology developments based on SWCNT have been slower than anticipated, largely due to their chemical inertness and tendency to agglomerate into large bundle structures, which makes it difficult to leverage their properties. As such, a great deal of effort has been directed in recent years towards the chemistry of SWCNT; that is, the control of exfoliating and adding diverse chemical addends to their sidewalls [3–5]. This field has matured rapidly and has reached the point where a vast array of functional moieties can be linked to SWCNT through both covalent and non-covalent interactions. Being able to “tune” the type, quantity, and location of functional groups on the SWCNT is an extremely valuable tool, particularly for applications in composite materials. It is important to match the chemistry of the SWCNT to that of the composite
Electronic supplementary material The online version of this article (doi:10.1007/s00216-009-3205-y) contains supplementary material, which is available to authorized users.
C. T. Kingston (*)
:
Y. Martínez-Rubí:
J. Guan:
M. Barnes:
B. Simard
Molecular and Nanomaterial Architectures Group, Steacie Institute for Molecular Sciences,
National Research Council Canada, Ottawa, ON K1A 0R6, Canada e-mail: Chris.Kingston@nrc-cnrc.gc.ca C. Scriver
:
R. E. SturgeonChemical Metrology Group,
Institute for National Measurement Standards, National Research Council Canada,
Ottawa, ON K1A 0R6, Canada DOI 10.1007/s00216-009-3205-y
matrix in order to maximize the transfer of properties between the two, while minimizing the number nanotube addend sites so as not to diminish the remarkable properties that are being exploited. Despite its obvious importance, the ability to characterize the types and quantities of functional groups attached to SWCNT has proven to be a difficult task. A number of methods have been applied to try to estimate the degree of functionalization of a carbon nanotube (CNT) sample, including titration [6] and deoxygenation [7] reac-tions, NMR [8], XPS [9,10] and fluorescence spectroscopy [11], as well as AFM, STM [12], and STEM imaging techniques [13]. Though each of these techniques has shown some capability at estimating the quantity of sidewall functional groups, they also have limitations. The chemical and fluorescence probes are sensitive to only certain functional groups, the imaging methods measure only individual or a small number of CNT, and NMR is more suited to high degrees of functionalization and long sidechain lengths. XPS is excellent for quantifying specific elemental compositions but, due to the asymmetry of the C1S peak in CNT, is very difficult to identify and quantify specific functional moieties.
Thermogravimetry (TG) is an important and frequently used tool for the characterization of SWCNT. When applied using an oxidizing atmosphere, TG can be used to measure the concentration of residual catalyst metals present in the sample [14, 15] and to assess sample purity [15–17]. Exercising control over the oxidizing conditions affords some ability to differentiate between sample components [18]. More recently, TG has been applied under inert desorption conditions to monitor adsorbates and functional addends attached to CNT samples [19–23]. In the majority of such cases, it is assumed that the total loss in sample mass can be attributed entirely to the liberation of the specific functional moieties being studied, which then allows the estimation of the degree of functionalization. Given the inhomogeneity of typical SWCNT samples and the varied chemical conditions to which they are exposed during typical purification and functionalization procedures, it is unlikely that there will be only a single chemical addend anchored to the SWCNT. Basic TG analysis should be coupled with quantitative analysis of the desorbed fragments in order to properly assess the state of functionalization of the SWCNT sample.
In this work, we present the results of recent efforts to apply a fully integrated approach encompassing thermogravimetry, mass spectrometry, and infrared spectroscopy (TG-MS-FTIR) as a new tool for both identifying and quantifying sidewall functional groups on SWCNT. The technique has the potential to measure average functionalization properties of more bulk-scale samples and should be equally applicable to essentially any functional groups, including multiple different groups on the same sample, thanks to the IR and MS detection channels.
Quantification data are correlated to analytical ICP-OES measurements of potassium-substituted acid groups.
Experimental
The SWCNT used in this study were synthesized using the two-laser vaporization process developed in our laboratory [24,25]. The as-produced SWCNT were then purified using an in-house protocol that leverages the differences in solubility of the SWCNT and impurity carbons through repeated flotation, sedimentation, and extraction cycles in multiple organic solvents. The process does not employ any acid or thermal oxidation steps which almost eliminates the introduction of new sidewall defects or functional groups that are typically observed following the application of most purification protocols found in the published litera-ture. The resulting purified material maintains the highly crystalline sidewall structure that is characteristic of laser vaporization methods, while removing the vast majority of the impurity carbonaceous material, as determined by multiple characterization techniques, including absorption and Raman spectroscopy, electron microscopy, and ther-mogravimetry. Thermogravimetric curves and representa-tive SEM images of the raw and purified SWCNT are presented in Fig. 1. Functionalization of the purified nanotubes was then carried out according to the following protocols.
Reaction with glutaric acid acyl peroxide Purified SWCNT were derivatized with butyric acid moieties by reaction with glutaric acid acyl peroxide using the rapid functionalization protocol developed in our laboratory [5]. This protocol offers exceptional flexibility towards attaching a wide array of addends to the SWCNT, typically in a matter of minutes under ambient conditions. The process begins with the reduction of SWCNT in a sodium naphthalide THF solution [26], which naturally exfoliates the nanotubes and imparts enhanced nucleophilic character. In a typical reaction, 24 mg (2 mmol) of purified SWCNT was suspended for about 30 min in 20 mL of dry THF using an ultrasonic probe. At that point, 16 mg (0.7 mmol) of sodium and 90 mg (0.7 mmol) of naphthalene were added to the suspension, under nitrogen. A green mixture was formed and the suspension was stirred overnight, providing the reduced SWCNT. About 2 mM of the diacylperoxide, glutaric acid acyl peroxide (GAP), was added directly to the reduced SWCNT. The reaction was stirred at room temperature for about 30 min and then filtered using a 3-µm-pore-size polytetrafluoroethylene (PTFE) membrane (Millipore). The product was washed with toluene, THF, water, and methanol. The functionalized SWCNT were repeatedly suspended in THF, methanol and DMF using an
ultrasonic bath. The suspensions were centrifuged and finally filtered to recover the product which was washed with acetone and dried under vacuum at 100 °C. The final dry powder is designated SWCNT-GAP. The degree of functionalization can be increased by repeating the redox process by reducing the previously functionalized SWNT (SWNT-GAP) and re-subjecting them to another reaction cycle with GAP.
Reaction of SWCNT-GAP with potassium In order to correlate the TG-MS-FTIR results (vide infra) with a traceable quantitative reference measurement, the butyric acid functionalized nanotubes (SWCNT-GAP) obtained after two functionalization cycles were titrated quantitatively with KOH for the purpose of quantitation of potassium by
ICP-OES. For this reaction, about 100 mg of SWCNT-GAP were suspended in 50 mL of 0.05 mol L−1KOH solution with the use of a sonication bath for 1 h, followed by 48 h of stirring. The mixture was subsequently filtered through a 3-µm PTFE filter and washed with deionized water to remove the excess of K. Butyric acid is a weak acid with a pKa of 4.82. This washing step has to be done carefully to prevent the hydrolysis of the salt and regeneration of the undissociated acid form. The washing step was stopped when the filtrate reached pH 7. For a control sample, purified but unfunctionalized SWCNT were also subjected to the same processing protocol, and designated SWCNT-K throughout the analysis.
Determination of potassium content by ICP-OES A refer-ence methodology based on inductively coupled plasma optical emission spectrometry (ICP-OES) was developed to independently determine surface functionality coverage of the SWCNT by quantitation of potassium released from surface carboxyl groups. The SWCNT were leached in a hot acidic environment. Under clean room conditions, test samples were weighed into pre-cleaned vessels to which 10 mL of sub-boil distilled nitric acid were added. The contents were reflux heated in a hot block (DigiPrep Jr, SCP Science) for approximately 10 h along with three procedural blanks. Following dilution to 25 g with deionized distilled water (Nanopure, Barnstead/Thermolyne, Boston, MA, USA), potassium content was determined by ICP-OES using a Perkin-Elmer Optima 3000 (Norwalk, CT, USA) radial view instrument fitted with a conventional cross-flow nebulizer with chemical resistant gem tips and alumina injector. The concentration of K in the sample solutions was achieved by monitoring two K emission lines (766.490 and 404.721 nm) which were corrected for background and any interelement interference as well as the procedural blank. An external calibration function was constructed based on response from standards gravimetrically prepared from high-purity KCl. Table1 summarizes optimized operating parameters for the ICP-OES. No significant difference was noted between the results determined using either emission line. The uncertain-ty of the data was determined primarily by the goodness of fit of the calibration function. No correction for moisture content was applied to the SWCNT and results are thus reported “as is”.
Assessment of surface functionality by TG-MS-FTIR TG analysis of SWCNT samples was performed on a Netzsch TG 209 F1 Iris® with simultaneous coupling of an Aëolos QMS403C mass spectrometer and a Bruker Tensor 27 Fourier transform infrared (FTIR) spectrometer via a TGA A588 TGA-IR module. The samples were characterized under inert desorption conditions in which the system was operated with UHP argon gas (BOC grade 5.3) and residual
Fig. 1 a TG (solid) and DTG (dashed) curves under oxidation conditions for raw (red) and purified (black) SWCNT. Representative SEM images of raw b and purified c SWCNT
oxygen was trapped using a Supelco Big-Supelpure O oxygen/water trap. Transfer lines between the TG instrument, mass spectrometer, and FTIR spectrometer were heated to a temperature of 200 °C to minimize the condensation of desorbates within the lines. Each TG measurement began with a buoyancy correction run performed on a clean empty crucible under identical gas flow and thermal ramp conditions as the sample analyses, which accounted for balance drift in the instrument due to increasing heat. Upon loading of the SWCNT samples, residual air was removed by three evacuation and Ar-backfill cycles and the sample was placed under run gas conditions, consisting of 25 sccm of argon for the protective gas and 50 sccm of argon for the purge gas. The thermal desorption measurements consisted of a heating from room temperature to 120 °C at a rate of 10 °C/min, an isothermal soak at 120 °C for 20 min, heating from 120 °C to 950 °C at a rate of 10 °C/min, followed by an isothermal soak at 950 °C for an additional 30 min. Infrared and mass data were collected concurrently with the TGA data; IR data were collected in the range of 500– 4500 cm−1at a resolution of 4 cm−1, and the MS data were recorded in the range of 1–80m/z.
Results and discussion
Raman spectra, normalized to the intensity of the G-band for both the purified (SWCNT) and functionalized (SWCNT-GAP) samples, of similarly prepared samples to those studied herein can be seen in Fig. 1 of Ref. [5]. The high purity and low levels of inherent defects of the purified material can be inferred from the narrow width and very low intensity of the disorder-induced D-band feature located at approximately 1,345 cm−1[27]. Infrared absorp-tion measurements of the purified SWCNT [5] show no evidence of the presence of functional groups, which is a further testament to the high purity and crystallinity of the material. Upon functionalization, the Raman spectra show a dramatic increase in the width and relative intensity of the D-band as well as the G + D band near 2,900 cm−1, both of which are indicative of a disruption in the sp2 lattice structure of the SWCNT backbone as a result of the
covalent attachment of the functional moieties. The other SWCNT Raman features remain unchanged following the functionalization reaction which indicates that the structure of the SWCNT has not been significantly compromised. This is also confirmed by TEM imaging [5] which show no noticeable visual change in the nanotube morphology following functionalization.
As a baseline, TG-MS-FTIR desorption measurements were performed on the purified nanotube sample. Ther-mogravimetry and infrared absorption data for the purified SWCNT are given in Fig.2. From the TG trace (Fig.2a) it is evident that the isothermal soak at 120 °C liberates a small amount of residual solvent in the sample. Using the mass after solvent desorption as the starting mass, the purified SWCNT show a weight loss of 5% following thermal desorption to 700 °C. This result is consistent with other reports of thermal desorption measurements per-formed on purified SWCNT materials, which show weight losses in the range of 5–20% under similar conditions [19–
23]. This suggests that there are low levels of adsorbates and/or functional groups present on the nanotubes after only the synthesis and purification steps, which is also consistent with observations made by other groups [7,11].
Fig. 2 a Thermogravimetric analysis of the purified SWCNT sample under desorption conditions. The TG (black) and DTG (red) traces represent the mass loss and rate of mass loss versus temperature, respectively. b 3D contour map of the IR spectra of the species desorbed from the purified SWCNT sample as a function of temperature
Table 1 ICP-OES operating conditions Argon flow rates
Plasma 15 lmin−1
Auxiliary 0.5 lmin−1
Nebulizer 0.8 lmin−1
RF power 1,300 W
Sample flow rate 1.0 ml min−1
Viewing height 15 mm
Similar desorption TG measurements performed on the as-produced (unpurified) SWCNT show a greater degree of weight loss at approximately 9% (see the supplementary information, Fig. S1). This can be attributed to the additional defect and adsorption sites present in the impurity carbonaceous material.
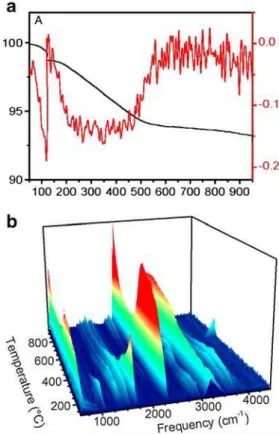
The FTIR measurements of the evolved gases show the presence of CO2through most of the temperature range as well as a carbonyl-containing fragment desorbing between 200–400 °C and some CH fragments desorbing at higher temperatures. The primary sources of oxygen for the generation of CO2in these measurements is interpreted to be adsorbed oxygen and water as well as small oxygen-containing fragments on the sidewalls of the nanotubes, such as hydroxyl, carbonyl, and acid groups (the oxygen trap reduces process gas oxygen levels to below 2 ppb, therefore, it is estimated that only 3 ng of carbon will be oxidized as a result of trace oxygen present in the gas flow). In comparison, the desorption TG and IR data for the functionalized SWCNT-GAP sample are given in Fig.3. The thermal desorption data show a total mass loss of 23%
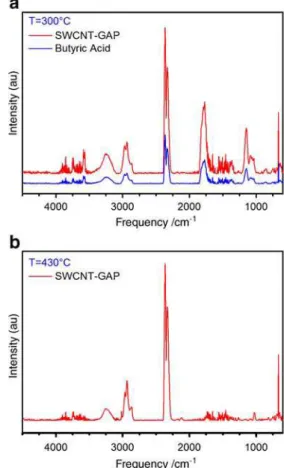
upon heating to 700 °C, markedly higher than that obtained for the purified sample. The differential ther-mogravimetry (DTG) data can be modeled well by three discrete mass-loss events centered at ∼210 °C, ∼300 °C, and ∼430 °C and accounting for ∼4 wt.%, ∼11 wt.%, and ∼8 wt.%, respectively. This suggests that there are three main substitution environments on the nanotubes, each liberating their addends at different temperatures. Looking to the FTIR contour plot, we can attempt to identify the species liberated during each of these events. It is clear that there are a number of IR absorption features that appear to be associated with the two lower-temperature desorption events, namely the bands at 1,170 cm−1, 1,790 cm−1, and 3,580 cm−1. Considering the individual IR spectra at the temperatures of the three desorption events, we see that the evolved gases from the two lowest temperature events show essentially identical IR signatures. For reference, the IR spectra obtained at 300 °C and 430 °C are shown in Fig. 4, along with a reference spectrum of butyric acid from the Bruker NIST/ EPA vapor phase IR library. The 300 °C spectrum shows the unmistakable presence of butyric acid as well as some CO2 and traces of CC- and CH-containing fragments.
Fig. 3 a Thermogravimetric analysis of the functionalized SWCNT-GAP sample under desorption conditions. The TG (black) and DTG (red) traces represent the mass loss and rate of mass loss versus temperature, respectively. The blue traces are Gaussian fits to the individual desorption events identified in the DTG, and the green trace is the fitted curve. b 3D contour map of the IR spectra of the species desorbed from the functionalized SWCNT-GAP sample as a function of temperature
Fig. 4 IR absorption spectra of the species desorbed from the functionalized SWCNT-GAP sample at temperatures of a 300 °C and b 430 °C
Additionally, we can see that the prominent butyric acid peaks correspond to the three features identified in the contour plot as coinciding with the two lower-temperature desorption events. The IR spectrum obtained at 430 °C, on the other hand, shows no evidence of butyric acid and contains only CO2 and some weak CC and CH signatures. If we integrate the IR intensity of the characteristic butyric acid features as a function of temperature, we see a striking correlation with the first two desorption events (Fig.5). Similarly, integrated mass spectrometric data (Fig. 6) for this sample confirms the evolution of small hydrocarbon fragments including CH3, C2H3, and C2H5, corresponding exclusively to the 430 °C desorption event.
These data clearly point to the butyric acid functional groups being liberated over the temperature range of 180–400 °C, and that there appears to be two discrete binding environments for the butyric acid to the SWCNT. Recent analysis of a similarly prepared func-tionalized SWCNT sample having undergone only one reaction cycle with GAP indicates that the lowest temperature desorption event at ∼210 °C is the result of residual physisorbed butyric acid. For this sample, two measurements were made in which the TG-MS-FTIR analysis protocol detailed above was preceded by overnight vacuum drying cycles at 120 °C and 150 °C, respectively (see the supplementary information, Fig. S2). Analysis following the 120 °C drying cycle showed the presence of three desorption events very similar to those observed in Fig. 3a, while analysis following the 150 °C drying cycle revealed the complete elimination of the lowest temperature butyric acid (boiling point =164 °C) desorption. These results suggest that the second desorption event observed in the thermal analysis of the SWCNT-GAP sample studied herein results from the liberation of covalently bound butyric acid. Therefore, we can estimate that the butyric acid ligands account for up to 11 wt.% of the functionalized SWCNT-GAP sample.
This would correspond to an upper-bound butyric acid substitution level of 1.7 carbon atoms per 100 in the nanotube backbone.
As a means of calibrating the data derived from the TG-MS-FTIR analysis, we subjected the SWCNT sam-ples to an analysis of their potassium content using ICP-OES, following the production of the potassium salt of the SWCNT-GAP-functionalized sample. The results of the potassium quantitation measurement for this, as well as purified SWCNT and purified SWCNT subjected to the KOH reaction are presented in Table2. Not surprisingly, the pristine purified SWCNT sample contained no detectable quantity of potassium. Following exposure to KOH, the purified nanotubes (SWCNT-K) showed a potassium con-centration of almost 4.6 mg/g, which is equivalent to approximately one bound potassium atom for every 1,000 carbon atoms in the SWCNT backbone. This indicates that even without intentional functionalization, there are active binding sites available on the SWCNT; probably acid and hydroxyl groups originating from the synthesis and purification processes [11]. This level of substitution is a factor of 10–50 lower than those observed for SWCNT purified by acid reflux techniques [11], which speaks to the effectiveness of our purification process at removing carbonaceous impurities with minimal modifi-cation of the SWCNT. The GAP-functionalized SWCNT sample showed a potassium concentration of 32 mg/g. If we assume that all such potassium is bound to butyric acid ligands, this correlates to a substitution level of one in 100 carbon atoms. This is a reasonable assumption since the
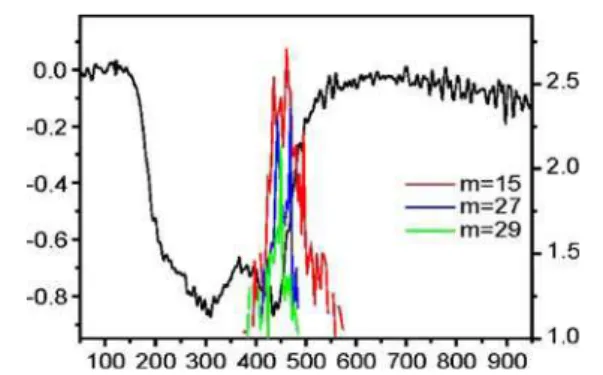
Fig. 6 Integrations of the mass spectrometric intensities as a function of temperature for the m=15, 27, and 29m/z channels as observed in the thermal desorption analysis of the functionalized SWCNT-GAP sample, overlaid on the DTG analysis of the SWCNT-GAP sample
Fig. 5 Integrations of the peak intensities as a function of temperature for the characteristic butyric acid IR absorption peaks as observed in the thermal desorption analysis of the functionalized SWCNT-GAP sample, overlaid on the DTG analysis of the SWCNT-GAP sample
Table 2 Concentration of potassium as determined by ICP-OES
Sample K concentration (mg/kg)
SWCNT <50
SWCNT-K 4,580 ±10
SWCNT-GAP 32,140 ±180
C–H-type ligands identified in the thermal analysis would be unavailable to the potassium during the titration reaction, there is an order of magnitude fewer previously existing binding sites on the SWCNT compared to butyric acid sites, and there is little possibility of intercalated potassium from the reaction. At this level of substitution, the butyric acid groups would account for 7.5% of the sample weight.
The TG-MS-FTIR assessment of butyric acid substi-tution levels is in good agreement with the ICP-OES determination, predicting 1.7% and 1% carbon substitu-tion, respectively. There are several factors that must be considered that can influence the substitution levels indicated by the two methods. For the TG-MS-FTIR analysis, the desorption of the butyric acid groups is accompanied by some oxidation process producing CO2, as well as the liberation of small quantities of CH-containing addends. The extinction coefficient for the symmetric stretching vibration of gas phase CO2 (2,350 cm−1) is approximately 40 times larger than that for the carbonyl stretch of small organic acids (1,780 cm−1) [28]. Given the relative intensities of these IR bands at the peak of the 300 °C desorption event, we estimate that there is approximately 20 times more butyric acid than CO2in the evolved gases. This estimate is supported by the MS data which shows that the m/z = 44 channel contributes only approximately 2% of the total ion current at 300 °C, after correcting for the carrier gas ions. These results provide further justification to our attributing the entire weight loss of this desorption to the liberation of butyric acid. Nevertheless, the estimated substitution levels would represent an upper bound. In the case of the ICP-OES measurements, there is the possibility that the potassium titration with the butyric acid was not done to completion, or that the post-reaction washing steps hydrolyzed some of the potassium salt back to the acid form. Thus, the potassium quantitation measurement would represent a lower bound to the butyric acid substitution levels. These considerations are in perfect agreement with our observed results, as the substitution levels calculated from the thermal data are slightly higher than those from the ICP-OES.
In addition to its capacity to assess the quantity of the target butyric acid groups, TG-MS-FTIR was also able to discern the presence of other functional moieties attached to the nanotubes, having identified ∼8 wt.% of CH-containing species. The ICP-OES measurements, or other similar chemical probing techniques, would be blind to such functional groups as they are unresponsive towards the chemical tags. Therefore, TG-MS-FTIR is a useful tool for assessing the total state of functionalization of the nano-tubes, including any secondary functionalization products. Since mass spectrometry and infrared spectroscopy are both
extremely mature characterization techniques there is a wealth of reference information available for use in the identification of desorbed species.
Conclusions
We have demonstrated that coupled TG-MS-FTIR desorp-tion analysis is a useful and flexible tool for the evaluadesorp-tion of the degree of functionalization of SWCNT samples. The calculated substitution levels of the target butyric acid groups are in good agreement with those determined from an independent ICP-OES reference measurement. This technique was also able to discern the presence of secondary functional moieties on the nanotube samples that were not accessible to our analytical reference measurement. This demonstrates the potential of the technique for assessing the presence of multiple and diverse functional addends beyond just the principal groups targeted by the specific functionalization reaction. TG-MS-FTIR provides a new tool for quantitation of the degree of functionalization of carbon nanotube samples and, as such, will require further validation with samples beyond what was investigated here. Nevertheless, TG-MS-FTIR desorption analysis appears to be a rapid and flexible approach capable of quantifying a broad range of sidewall functional groups.
References
1. Baughman RH, Zakhidov AA, de Heer WA (2002) Science 297:787–792
2. Terrones M (2003) Annu Rev Mater Res 33:419–501
3. Tasis D, Tagmatarchis N, Bianco A, Prato M (2006) Chem Rev 106:1105–1136
4. Hirsch A, Vostrowski O (2005) Top Curr Chem 245:193–237 5. Martínez-Rubí Y, Guan J, Lin S, Scriver C, Sturgeon RE, Simard
B (2007) Chem Commun 48:5146–5148
6. Hu H, Bhowmik P, Zhao B, Hamon MA, Itkis ME, Haddon RC (2001) Chem Phys Lett 345:25–28
7. Ogrin D, Chattopadhyay J, Sadana AK, Billups WE, Barron AR (2006) J Am Chem Soc 128:11322–11323
8. Zeng L, Alemany LB, Edwards CL, Barron AR (2008) Nano Res 1:72–88
9. Jung A, Graupner R, Ley L, Hirsch A (2006) Phys Stat Sol 243:3217–3220
10. Guan J, Martínez-Rubí Y, Dénommée S, Ruth D, Kingston CT, Daroszewska M, Barnes M, Simard B (2009) Nanotechnology 20:245701
11. Dementev N, Feng X, Borguet E (2009) Langmuir doi:10.1021/ la803947q
12. Zhang L, Zhang J, Schmandt N, Cratty J, Khabashesku VN, Kelly KF, Barron AR (2005) Chem Commun 43:5429–5431
13. Hong SY, Tobias G, Ballesteros B, Oualid FE, Errey JC, Doores KJ, Kirkland AI, Nellist PD, Green MLH, Davis BG (2007) J Am Chem Soc 129:10966–10967
14. Ramesh S, Brinson B, Johnson MP, Gu Z, Saini RK, Willis P, Mariott T, Billups WE, Margrave JL, Hauge RH, Smalley RE (2003) J Phys Chem B 107:1360–1365
15. Itkis ME, Perea DE, Jung R, Niyogi S, Haddon RC (2005) J Amer Chem Soc 127:3439–3448
16. Arepalli S, Nikolaev P, Gorelik O, Hadjiev VG, Holmes W, Files B, Yowell L (2004) Carbon 42:1783–1791
17. Trigueiro JPC, Silva GG, Lavall RL, Furtado CA, Oliveira S, Ferlauto AS, Lacerda RG, Ladeira LO, Liu JW, Frost RL, George GA (2007) J Nanosci Nanotech 7:3477–3486
18. Gozzi D, Latini A, Lazzarini L (2008) Chem Mater 20:4126–4134 19. Nayak RR, Lee KY, Shanmugharaj AM, Ryu SH (2007) Eur
Polym J 43:4916–4923
20. Montesa I, Muñoz E, Benito AM, Maser WK, Martinez MT (2007) J Nanosci Nanotech 7:3473–3476
21. Syrgiannis Z, Hauke F, Röhrl J, Hundhausen M, Graupner R, Elemes Y, Hirsch A (2008) Eur J Org Chem 15:2544–2550 22. Zhang L, Ni QQ, Fu Y, Natsuki T (2009) Appl Surf Sci
255:7095–7099
23. Zhang W, Sprafke JK, Ma M, Tsiu EY, Sydlik SA, Rutledge GC, Swager TM (2009) J Amer Chem Soc 131:8446–8454
24. Kingston CT, Jakubek ZJ, Dénommée S, Simard B (2004) Carbon 42:1657–1664
25. Kingston CT, Simard B (2006) J Nanosci Nanotech 6:1–8 26. Pénicaud A, Poulin P, Derré A, Anglaret E, Petit P (2005) J Amer
Chem Soc 127:8–9
27. Dillon AC, Yudasaka M, Dresselhaus MS (2004) J Nanosci Nanotech 4:691–703
28. Rao KN (1985) Molecular spectroscopy: modern research, vol III. Academic, Orlando