HAL Id: hal-01058719
https://hal-onera.archives-ouvertes.fr/hal-01058719
Submitted on 8 Oct 2014
HAL is a multi-disciplinary open access
archive for the deposit and dissemination of
sci-entific research documents, whether they are
pub-L’archive ouverte pluridisciplinaire HAL, est
destinée au dépôt et à la diffusion de documents
scientifiques de niveau recherche, publiés ou non,
Modelling ionospheric effects for L band GNSS receivers
at high latitudes.
D. Boscher, F. Carvalho, V. Fabbro, J. Lemorton, R. Fleury
To cite this version:
D. Boscher, F. Carvalho, V. Fabbro, J. Lemorton, R. Fleury. Modelling ionospheric effects for L band
GNSS receivers at high latitudes.. 8th European Conference on Antennas and Propagation (EUCAP
2014), Apr 2014, LA HAYE, Netherlands. pp.2695-2698. �hal-01058719�
Modelling ionospheric effects
for L band GNSS receivers at high latitudes
Boscher D.
1, Carvalho F.
2, Fabbro V.
3, Lemorton J.
3, Fleury R
41 ONERA (French Aerospace Lab) DESP (Space Environment Dept), Toulouse, FRANCE, [email protected], 2 CNES (French Space Agency), Toulouse, FRANCE, [email protected]
3 ONERA (French Aerospace Lab) DEMR (Electromagnetism and Radar Dept), Toulouse, FRANCE,
[email protected], [email protected]
4 Telecom Bretagne, Lab-STIC, Brest, FRANCE, [email protected]
Abstract— The main objective of this study was to figure out
a relationship between space weather environment phenomena (linked to solar and geomagnetic activity) and ionospheric events that impact L-band operating satellite systems (scintillations, electron content gradients), especially satellite navigation services, in the Nordic European area. A simple empirical model to forecast index of rate of change of the total electron content (ROTI) at high latitude has been developed associated with Kp geomagnetic prediction and the use of solar electron energy flux.
Index Terms— radiowave propagation, ionosphere,
scintillation, high latitude, solar and geomagnetic activity.
I. INTRODUCTION
When crossing the ionosphere layer, L-band satellite navigation signals are impacted by two kinds of effects: mean effects and dynamic effects. Mean effects are the group delay and the signal phase advance when going through the ionosphere. At the first order this delay depends on the total electron content (TEC) of the ionosphere layer. It leads to a positioning error of several meters to tens of meters. Most of it can be corrected in the case of Global Navigation Satellite Systems (GNSS) either using a dual frequency measurement, or using correction models (like Klobuchar, NeQuick, TEC grids in the case of augmentation systems) for single frequency measurements.
Dynamic effects are scintillation phenomena. These events generally occur over the equatorial region and the polar zone, but they may also occur at middle latitudes when the solar activity increases as during a solar maximum. These events impact the signal and cause very fast variations of the amplitude and of the phase. Therefore, the signal fades and GNSS receivers may lose lock. The main impact of the ionosphere dynamic effects on navigation systems is the unavailability of the satellite link as well as the reduced reliability of the available information. In general the understanding of scintillation phenomena is still insufficient, and the available models are still not adequate for all geographical areas and applications.
General correction models, which are usually precise for mid-latitude GNSS based applications, are inadequate at high latitudes. For this reason the present study was focused on high latitude phenomena. In order to provide a precise correction for
GNSS based applications used in this region, improved models are needed.
Ionosphere events observed at high latitudes are strongly linked to the solar activity and its impact on the magnetic field of the Earth, especially due to the solar wind. In the Northern area, the main effects of solar activity and of charged particles penetration in the Earth's atmosphere through the poles are: • The auroral oval evolution: the location of the auroral
oval, the outbreak of a transpolar auroral arc that crosses the diameter of the oval are linked to the intensity of the particle precipitation and generally depend on the solar wind - magnetosphere interaction, and reconnection in the magnetosphere tail. Many ionospheric events at high latitudes occur on the auroral oval.
• Drifting plasma clouds are small scale features following the polar cap convection pattern and causing density gradients, connected with the appearance of scintillation. • Sub-storms caused by reconnection in the Earth's
magnetic field and triggered by solar wind parameters. • Ionospheric storms caused by energetic events on the Sun,
such as flares or coronal mass ejections.
All of these events cause strong electron content gradients and scintillations at the ionosphere layer level. Unfortunately no sufficient prediction model exists for the intensity of these phenomena. Although a guess can be done on the occurrence and extension of an ionospheric disturbance according to the strength of a solar event, no reliable value can be given for the intensity of the disturbing phenomena. So the main objective of this study was to figure out a relationship between space weather environment phenomena (solar activity and geomagnetism) and ionospheric events that impact L-band operating satellite systems (scintillations, electron content gradients) in the Nordic European area.
A collaboration agreement has been signed between the French Space Agency (CNES) and the Norwegian Space Centre (NSC) with a common objective of better knowledge and prediction models on the ionosphere and related space weather matters. The French Aerospace Lab (ONERA) led this activity with contribution from Telecom Bretagne, and in collaboration with the Norwegian Mapping Authority (NMA).
II. DEVELOPMENT OF THE MODEL
The high-latitude ionosphere is a highly structured medium, comprising electron density irregularities over a large range of scale sizes. Different chemical and physical processes between the neutral and ionized atmosphere compete in the overall control of the ionization distribution. These processes are further complicated because the Earth's magnetosphere exerts a strong influence upon the polar ionosphere, involving electric fields, convection patterns, and particle precipitation. The high-latitude polar ionosphere is characterized by two regions, the polar cap and the auroral oval. Disturbances in the auroral and polar-cap ionosphere can have profound effects on radio signals traversing the high-latitude ionosphere. The most profound changes of the high-latitude ionosphere occur during geomagnetic storms and substorms, especially near the maximum of the sunspot cycle.
Empirical climatological models for the global polar ionosphere structure were developed in the 70's and 80's [1]. Then, numerical models have been studied. More recently auroral oval models have been developed giving the location of poleward, equatorward and diffuse auroral boundaries [2] [3]. In [3] is presented a new empirical model of the average auroral particle precipitation characteristics (in terms of energy flux) which was developed with the intent of providing a higher fidelity representation of the high latitude inputs that drive thermospheric dynamics, as particle precipitation in the auroral oval serves as an important connection between the magnetosphere and ionosphere/atmosphere. [4] compares the methods by [2] and [3] which calculate the size and location of the auroral ovals as a function of planetary Kp index, and provides a tool to forecast auroral activity.
However modelling the position errors in GPS or other localization system measurements is not an easy task. They are linked to the total electron content, and are also increased in case of scintillations which cause receiver loss of lock and are themselves related to the TEC rate of change index ROTI. A. Available measurements
For the purpose of this study, 50 Hz scintillation measurements with ISM (Ionospheric Scintillation Monitor) have been collected at several stations in Norway: Tromsoe and Vega since January 2012, Ny-Alesund since January 2013. However as the period of measurements was yet not long enough, ROTI measurements in Norway from the SATREF network of conventional GPS stations available since 1994 have been used.
B. Principle of the model
Different authors have linked the ROTI to the electron energy flux, getting it through several means.
In this study, we used the NOAA POES meteorological satellites data (5 satellites POES 15, 16, 17, 18, 19 from 1998) since they carry particle detectors which are used to observe auroral ovals as well as radiation belts and solar proton events. They can give TED flux (0.16, 0.84, 2.6, 1.98 keV) and MEPED flux (>30, >100, 300 keV) from the 0° detector. The
processing of all these measurements is explained in [5]. From that the electron energy flux can be calculated by integration:
dE
E
E
j
dp
vEfp
H
∫
∫
∞ ∞=
=
0 0 24
(
)
4
π
π
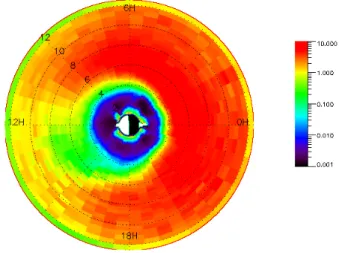
(1)Therefore good statistics of the electron flux were obtained, taking advantage of the 5 current POES satellites (POES 15 to 19) scanning at the same time several local times, and the fact that the first spacecraft have spend more than one solar cycle in orbit. The obtained statistics is very good, as for example more than 60,000 8s resolution points were obtained at extreme magnetic activity (for magnetic index Kp>8+). Averages of the electron energy flux in a McIlwain parameter L versus magnetic local time (MLT) maps were obtained by binning with McIlwain L (60 logarithmic values from L=1 to L=12) and MLT (48 values) and classifying according to the magnetic index Kp (10 values from Kp=0 to Kp=9).
Fig.1 and Fig. 2 show two of these maps for Kp=2 and Kp=5.
Fig. 1. Maps of electron energy flux in a McIlwain parameter L versus magnetic local time for Kp=2
Fig. 2. Maps of electron energy flux in a McIlwain parameter L versus magnetic local time for Kp=5
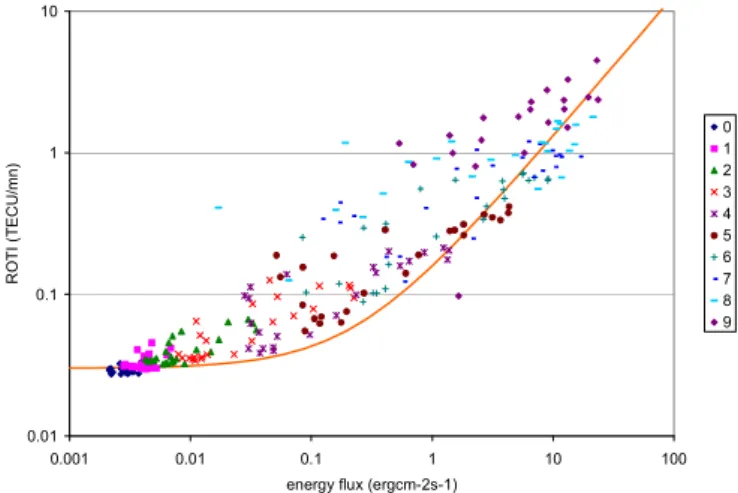
These maps were then correlated to the ROTI measurements made at two latitude distant magnetic stations: Tromsoe and Trondheim. The correlation was searched between ROTI (average of ROTI for fixed hour-fixed Kp) and energy flux for high elevation measurements (>60°). In fact high ROTI values are obtained for low calculated elevations, this being due to the thickness of ionosphere crossed by the GPS signal. Therefore, for final processing, a limitation on elevation to angles above 60° was adopted. Using that limitation, only GPS signals in the vicinity of the station (roughly longitudes between 13.5 and 24.5°E and latitudes between 67.7 and 69°N) are kept.
Fig 3 and Fig. 4 show the results where values of the correlation coefficient as high as 0.95 were obtained, limiting the statistics to lower Kp values (to take into account the fact that the statistics get poorer as the magnetic activity increases).
A simple law was derived:
ROTI = 0.03+0.1294 energy_flux (2) 0.01 0.1 1 10 0.001 0.01 0.1 1 10 100
energy flux (ergcm-2s-1)
RO T I ( T E C U /m n ) 0 1 2 3 4 5 6 7 8 9
Fig. 3. Correlation of ROTI and enerfgy flux for the station of Tromsoe
0.01 0.1 1 10
0.001 0.01 0.1 1 10 100
energy flux (ergcm-2s-1)
RO TI (T E C U /m n) 0 1 2 3 4 5 6 7 8 9
Fig. 4. Correlation of ROTI and enerfgy flux for the stations of Trondheim
The influence of the elevation was then analyzed by considering only South azimuth to eliminate problems with local time mixing (different day/night time and different low/high magnetic activity). Fig. 5 shows the results for Tromsoe. 0.01 0.1 1 10 0 10 20 30 40 50 60 70 80 90 elevation (°) RO T I ( T E CU/ m n) Kp=0 Kp=1 Kp=2 Kp=3 Kp=4 Kp=5 Kp=6 Kp=7 Kp=8 Kp=9
Fig. 5. Influence of the elevation at Tromsoe
Finally a model of ROTI was developed with as input parameters the station location and the time in day, the magnetic activity Kp, and the pointing direction (elevation and azimuth): 2 . 65 ] [ 2 ) 17 ] [ sin( 5 . 0 5 . 1
0082
.
1
]
/
/
[
1294
.
0
])
[
sin(
)
5
]
[
sin(
05
.
0
025
.
0
]
/
[
− ° + ++
°
+
+
=
elev h mlts
cm
erg
energyflux
elev
h
mlt
mn
TECU
ROTI
(3)III. VALIDATION OF THE MODEL
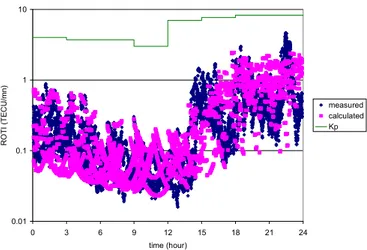
We used this formula to compare the calculated ROTI values with the measured ones. A case was analysed on May 29th 2003. At 12:00 UT, the magnetic index Kp switches from Kp=3 to Kp=7. During that day, there are no measurements from the Tromsoe station, but those from Trondheim are available. The comparison between the measured and the calculated ROTI is shown on Fig. 6. The magnetic index Kp was superposed on the figure, for comprehension.
Globally, the model reproduces quite well the ROTI increase, as well as its variations with respect to time. Despite the fact that Kp increases “instantaneously” at 12:00UT, the ROTI values, measured as well as predicted, do not increase rapidly. This is due to the effect of the local time in the model. Differences can be observed at around 15:00 UT and 22:30UT in the maximum values, but once more, they can be attributed to rapid variations of the magnetic activity, not well represented by Kp resolution.
IV. USE OF THE MODEL
- time, latitude and longitude of the IPP (Ionospheric Pierce Point) for the station used to calculate the magnetic local time MLT and Lm McIlwain parameter values,
- the electron energy flux derived from the stored maps according to MLT and Lm values, and magnetic index Kp,
- the magnetic local time is then used once more, together with the elevation and energy flux to deduce the ROTI values.
To use the model for a prediction of the ROTI, a prediction of Kp is performed regularly by several institutions:
- the NOAA SWPC
(http://www.swpc.noaa.gov/wingkp/index.html) - the RWC (http://rwc.lund.irf.se/rwc/kp/models.php) - the Rice University
(http://mms.rice.edu/realtime/forecast.html) 0.01 0.1 1 10 0 3 6 9 12 15 18 21 24 time (hour) RO TI (T E C U/ mn) measured calculated Kp
Fig. 6. Comparison between the calculated and the measured ROTI during the May 29, 2003 for the Trondheim station (all the measurements)
Station
(UT, lat, lon)
Satellite
(azim, elev)
IPP
(UT, lat, lon)
IPP
(Lm, MLT)
Magnetic
field
Kp (UT)
Energy flux
ROTI
(MLT,elev)
Station
(UT, lat, lon)
Satellite
(azim, elev)
IPP
(UT, lat, lon)
IPP
(Lm, MLT)
Magnetic
field
Kp (UT)
Energy flux
ROTI
(MLT,elev)
Fig. 7. Flowchart of the global model for predicting ROTI
CONCLUSION
A simple empirical model to forecast the ROTI anywhere under high latitude has been developed associated with Kp geomagnetic prediction and the use of solar electron energy flux.
This model could be improved by increasing the time resolution of Kp, as 3 hours seems to be too long as compared to the inertia of the magnetosphere. Several ways are followed for these improvements.
The prediction of ROTI was one step towards the final objective of that study. So relationships with scintillation parameters or with the impact on GNSS receiver performances (for example in terms of positioning errors) are now also investigated. Possible improvements of the model in a follow-on activity will be discussed.
ACKNOWLEDGMENT
Authors thank the Norwegian Space Center and the Norwegian Mapping Authority which provide long term datasets from their GNSS stations network and installed the ISM equipment in Norway for scintillation measurements.
REFERENCES
[1] Holzworth R. H., Meng C.-I., "Mathematical Representation of the Auroral Oval", Geophys. Res. Lett. 2, 377, 1975
[2] Starkov, G.V., Mathematical model of the auroral boundaries, Geomag. Aeron., 34 (3), pp. 331-336, 1994.
[3] Zhang, Y., L.J. Paxton, An empirical Kp-dependent global auroral model based on TIMED/GUVI data, J. Atm., Solar-Terr. Phys., 70, pp. 1231-1242, 2008
[4] Sigernes, F., M. Dyrland, P. Brekke, S. Chernouss, D.A. Lorentzen, K. Oksavik, C.S. Deehr, Two methods to forecast auroral displays, J. Space Weather Space Clim., 1 A03, 2011.
[5] Sicard-Piet, A., D. Boscher, V. Maget, Modélisation de l’environnement spatial, ONERA Technical Report, RF 2/17205 DESP, November 2010.