Publisher’s version / Version de l'éditeur:
Vous avez des questions? Nous pouvons vous aider. Pour communiquer directement avec un auteur, consultez la première page de la revue dans laquelle son article a été publié afin de trouver ses coordonnées. Si vous n’arrivez Questions? Contact the NRC Publications Archive team at
PublicationsArchive-ArchivesPublications@nrc-cnrc.gc.ca. If you wish to email the authors directly, please see the first page of the publication for their contact information.
https://publications-cnrc.canada.ca/fra/droits
L’accès à ce site Web et l’utilisation de son contenu sont assujettis aux conditions présentées dans le site LISEZ CES CONDITIONS ATTENTIVEMENT AVANT D’UTILISER CE SITE WEB.
Journal of Materials Science, 38, May 15 10, pp. 2247-2257, 2003-05-15
READ THESE TERMS AND CONDITIONS CAREFULLY BEFORE USING THIS WEBSITE.
https://nrc-publications.canada.ca/eng/copyright
NRC Publications Archive Record / Notice des Archives des publications du CNRC :
https://nrc-publications.canada.ca/eng/view/object/?id=6e00a3c8-fc4c-4a62-a413-3e9d953da63d https://publications-cnrc.canada.ca/fra/voir/objet/?id=6e00a3c8-fc4c-4a62-a413-3e9d953da63d
NRC Publications Archive
Archives des publications du CNRC
This publication could be one of several versions: author’s original, accepted manuscript or the publisher’s version. / La version de cette publication peut être l’une des suivantes : la version prépublication de l’auteur, la version acceptée du manuscrit ou la version de l’éditeur.
For the publisher’s version, please access the DOI link below./ Pour consulter la version de l’éditeur, utilisez le lien DOI ci-dessous.
https://doi.org/10.1023/A:1023769323629
Access and use of this website and the material on it are subject to the Terms and Conditions set forth at The Early-age short-term creep of hardening cement paste: AC impedance modeling
The Early-age short-term creep of hardening cement paste: AC impedance modeling
Tamtsia, B.T. ; Beaudoin, J.J.
NRCC-45702
A version of this document is published in / Une version de ce document se trouve dans: Journal of Materials Science, v. 38, no. 10, May 15, 2003, pp. 2247-2257
The early-age short-term creep of hardening cement paste:
AC impedance modeling
Basile T. Tamtsiaa, James J. Beaudoina and Jacques Marchandb
a
Institute for Research in Construction, National Research Council of Canada Ottawa, Ontario, Canada, K1A OR6
b
Department de génie civil, Université Laval, Sainte-Foy, Québec, Canada, G1K 7P4
ABSTRACT
Impedance spectra were monitored at early ages on hydrating Portland cement pastes subjected to a sustained load. The pastes were prepared with two different water-cement ratios (0.35 and 0.50). The experiments were conducted in a controlled chamber maintained at (96 ± 2)% relative humidity. The three ages at loading investigated were 18, 24 and 30 hours. Real-time changes in paste microstructure due to sustained load were followed through the coupling of an AC impedance frequency analyzer with a miniature loading system. Cement paste specimens were in the form of “T-shaped” columns with a minimum thickness value (for the web and flanges) less than 1.25 mm. The impedance analysis included an assessment of the relevance of the high frequency arc depression angle to an understanding of the creep and shrinkage behavior of cement paste. Electrical models were developed in order to predict the creep coefficient of normal (w/c=0.50) and high strength (w/c=0.35) cement pastes from early age data.
1. Introduction
The recent knowledge of the microstructure of calcium silicate hydrates obtained from various techniques (TGA/DTA, IR Spectroscopy, NMR etc.) has led to a better understanding of the distribution of water within the paste and the C-S-H. The impedance spectroscopy (IS) has emerged as a promising nondestructive technique suitable for in situ microstructural investigation [1-25]. The use of short-term creep and shrinkage data as well as the coupled electrical responses to model the creep of cement paste and/or concrete may be significant for the design engineers. Such models assume a good knowledge of the behavior of cement paste binders and their constituents. The experiments described in this paper were specifically designed to assess the a.c. impedance response (e.g. changing of high frequency arc diameter and depression angle) and its relationship to the early age creep process. Creep data were obtained on miniature specimens under environmentally controlled conditions. The monitoring of real-time changes in the microstructure of the cement paste subjected to sustained load through a loading system coupled to a.c. impedance measuring equipment facilitated the assessment.
2. Impedance Behavior of Cementitious Materials
Impedance spectra can be obtained over a wide range of frequencies (1 Hz to 15 MHz), allowing for the separation of bulk cement paste and electrode polarization effects. An idealized impedance spectrum for a cement system is plotted in the real versus imaginary plane (Fig. 1a). A single arc in the high-frequency range with a small part of a second arc in a relatively low-frequency region are shown. It is suggested that the high-frequency
arc (HFA) is attributed to the bulk paste impedance behavior and the second low frequency arc is due to the cement paste-electrode surface capacitance contribution [2]. The projected intercepts R1 (at the high-frequency end, in the MHz range) and R1+R2 (at
the minimum between the electrode arc and bulk arc, in the kHz range) are important parameters providing information related to cement paste microstructure. Interpretation of an impedance spectrum (IS) usually involves modeling with an equivalent circuit (Fig. 1b) until the electrical response of the elemental microstructure of the cement paste is well simulated.
It is clear that when the frequency approaches an infinite value the projected intercept resistance should be zero. Despite this, extrapolation to the real axis (the dashed line on fig. 1a) and computer simulation provide a fictitious or so-called high frequency resistance which is cement paste microstructure dependent. Work by Gu et al. [3] and that of others [4] demonstrated that the high frequency arc is associated with material properties. For example, the size of the high frequency arc has been shown empirically to correlate with pore structure parameters and the concentration of ions in the pore solution.
Cement-based materials generally contain a broad size distribution of water-filled conducting pores [5,6]. The network of these conducting pores continuously changes during the drying process [7-9] and can be detected in the AC impedance spectra [7-11]. In relatively dry materials the content of the electrolyte is not large enough to cover the internal pore surfaces [12]. Christensen et al. [13] found the cement paste to be a complicated composite conductor because its microstructure and the conductivity of its pore fluid are interrelated and time-dependent. McCarter et al. [14] concluded that only
the free capillary water in mortar samples is removed by oven drying at 70°C for 24 hours. The removal of adsorbed water from the gel surface would require a higher energy input. In such mortar samples the water adsorbed by capillary suction forces has been shown to have a significant influence on the electrical response [14].
Previous investigations [15-17] have indicated that the impedance behavior of the hydrating Portland cement system depends upon the ionic concentration of the pore solution and porosity. The high frequency arc diameter (or chord), R2, has been shown to
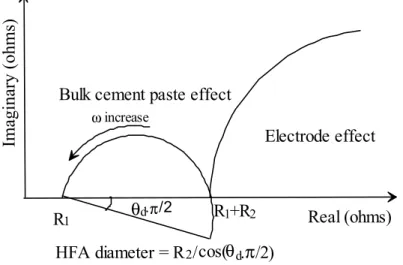
be an inverse function of porosity, mean pore size and ionic concentration of the pore solution. In practice, an ideal semi-circle is generally not observed in most materials. It is normally an inclined semi-circle with its center depressed below the real axis by a finite angle referred to as the depression angle (see Fig. 1c). This behavior, normally associated with a spread of relaxation times [18], cannot be described by the classical Debye equation employing a single relaxation time [19,20]. A dispersive, frequency-dependent element or so-called constant phase element (CPE) [22-24] can be introduced to account for the shape of the depressed complex plot. The impedance contribution of this element can be expressed as follows:
n
o j
A CPE
Z( )= −1( ω)− (1)
where n=1-θd and θd.π/2 is the depression angle. Therefore, n can be used to represent
the degree of perfection of the capacitor and represents a measure of how far the arc is depressed below the real impedance axis.
Influencing factors on the depression angle such as a spread of relaxation times and non-Debye behavior have been suggested [18,25]. A wider spread of pore diameters can also be associated with a larger dispersion angle [20]. The magnitude of the depression angle reported for normal cement paste, silica fume-Portland cement paste and porous glass is 28.5, 17 and 9° respectively. The time for the reorientation of ions or relaxation time appears to be affected by the geometry of the pores and the surface chemistry of the solid. Pore size and pore surface chemistry could limit the oscillation frequencies of the hydrated ions and water molecules, which respond to the applied a.c. signal. That is because a stronger ion-ion interaction would be expected in small pores than in larger ones. Therefore a broader pore size distribution would result in a wide spread of relaxation times corresponding to a larger depression angle.
Distributed circuit elements are often associated with two types of physical processes. The first association is directly with a non-local process, for example, diffusion. The other arises because microscopic characteristics such as interface properties and grain boundary effects are, themselves, often distributed throughout the material.
3. Experimental Program
3.1 Specimen preparation and characteristics
The hydrated cement paste used for this experimental study was made with type 10 Portland cement mixed with de-aired distilled water at two different water cement ratios (0.35 and 0.50). The Portland cement had the following composition (in percent): SiO2
(20.72); Al2O3 (5.87); Fe2O3 (3.07); CaO (62.66); MgO (3.46); SO3 (2.18) and free lime
C4AF (8.3). The fineness of the cement was 340 m2/kg. Mixing details are provided
elsewhere [26]. The cylinders were slowly rotated while the paste hardened in order to avoid bleeding and to produce a more homogeneous product. Specimens were demoulded after 18, 24 and 30 hours and stored in lime-saturated water at (22 ± 2)°C up to the testing period.
The compressive strength values at 18, 24 and 30 hours were 15, 21 and 24 MPa for normal strength paste (w/c=0.50) and 25.3, 41.7 and 53 MPa for the high strength paste (w/c=0.35) respectively. The initial stress-strength ratio for the creep tests performed on specimens at any stage of hydration was 0.30. The samples were fabricated from paste cylinders and machined to obtain a “T-shaped” specimen about 1.25 mm thick with a height of 25.4 mm and a flange width of 5.7 mm. A special jig was constructed to facilitate the cutting of the specimens with a precision saw.
3.2 Thermal analysis
Derivative Thermogravimetric Analysis (DTGA) was used to characterize the state of water in the samples. A Dupont 951 Thermal Analyzer placed in an environmentally controlled chamber was used for the tests. From thermogravimetric analysis data the degree of hydration of Portland cement paste while hardening was determined for the loaded and unloaded samples at early age. Powers and Brownyard [27], defined the degree of hydration as the ratio of non-evaporable water content of the cement paste at time t to the non-evaporable water content at the complete hydration of the cement paste (at t=∞). For a typical Portland cement paste, the latter is generally about 25% by mass
of the cement content while the bound water at time t is determined by the mass loss of the paste heated between 105°C and 1050°C.
Other definitions of bound water have been proposed by Danielsson [28] giving slightly different results. In the present study small variations in the degree of hydration are not significant, as it is the time dependent changes that are of interest.
3.3 Creep measurement system
The coupled a.c. impedance - creep and shrinkage spectral responses were obtained by mounting the “T-shaped” specimens in a miniature creep frame (two per frame) linking the specimens to a load cell through electrode interfaces connected to a Solartron 1260 frequency response analyzer. The creep frames were placed in environmentally controlled cells. Modified Tuckerman optical extensometers were used for the length change measurements. They were mounted on the flanges of each of the two “T-shaped” specimens. Creep strain was monitored with an accuracy of about 1 µstrain.
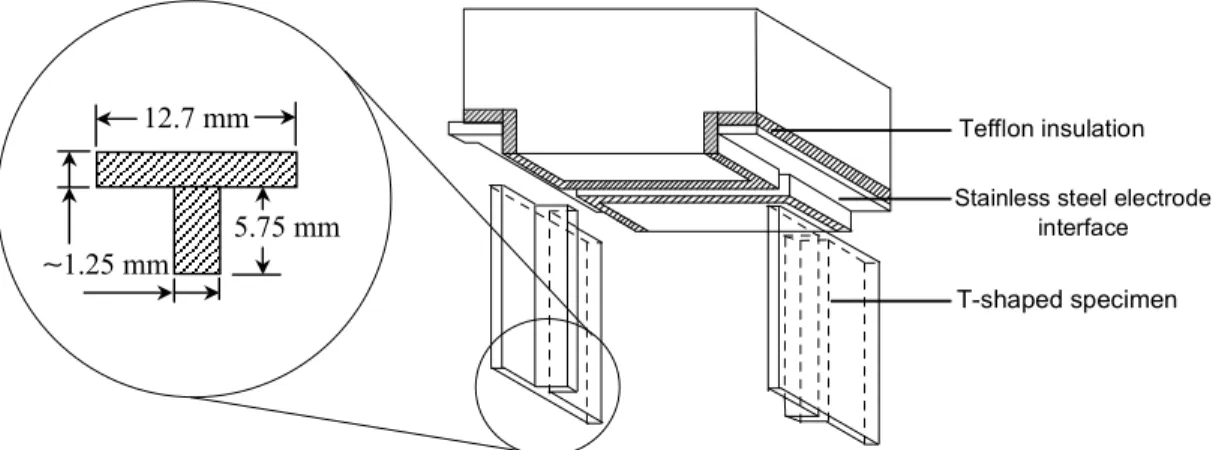
Prior to creep and/or shrinkage test, a conductive paste was spread at each end of the “T-shaped” specimens in order to provide a better electrode-specimen contact. The electrodes used for the present experiment were malleable thin strips of stainless steel kept in place by a small applied pressure. Details of the “T-shaped” specimen dimensions and electrode interface are presented in figure 1d. The ac impedance measurements were conducted for frequency varying from 5 MHz to about 100 Hz. Further details of the measurement system are provided in reference 26.
4. Results and Discussion
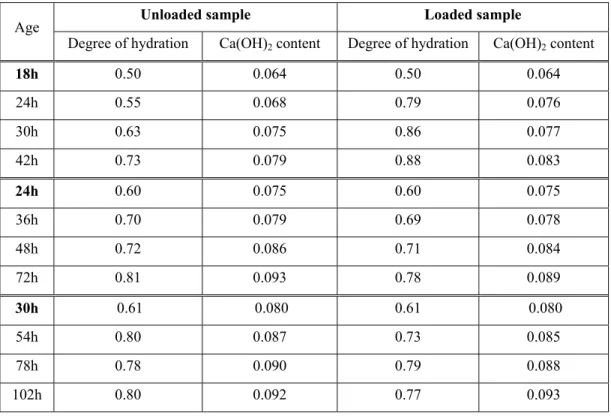
The degree of hydration as well as the CH content data are presented in Tables 1 and 2 for the 0.35 and 0.50 water-cement ratio pastes at different stages of hardening. It appears from Table 2 that the loading of samples at a very early age (18 hours or less) can increase the hydration (compared to that of unloaded samples) of ordinary hardening cement paste (at w/c=0.50). The loading shows a negative effect on the degree of hydration after 24 hours of hydration or greater for 0.35 and 0.50 water-cement ratio pastes at various hardening times. Detail mass change and length change isotherms for Portland cement paste have been obtained by researchers at the National Research Council and by other workers [29]. At 96 ± 2 % RH, the isotherm is steep and there is a mass change of about 2% of the mass of the degassed paste. There is also a relatively small shrinkage of about 0.03% associated with the desiccation. Equilibrium times at high humities contrary to those at low humidities are much shorter than three days as it is primarily capillary pores that empty on drying. In addition, the thin samples (less than 1.25 mm thickness) facilitates attainment of equilibrium. Strains, modulus of elasticity and compliance obtained from tests performed on hydrating Portland cement paste are presented in Table 3. The elastic values were obtained by incrementally applying the load up to the initial loading which corresponds to 30% of the compressive strength. The compliance of the high strength cement paste (w/c=0.35) after three days of loading increase with the age at loading while that of the normal strength cement paste (w/c=0.50) much higher, decrease with the age at loading. The modulus of elasticity which is a material property increase with the hydration and shows higher values for the low water cement ratio. These observations are similar to those reported in the literature.
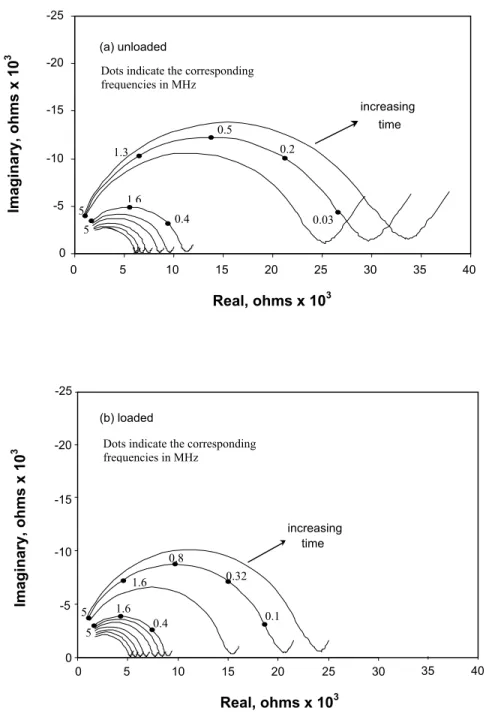
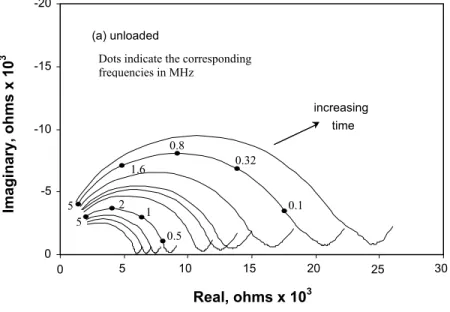
Impedance spectra (real-time) were simultaneously monitored during the shrinkage and creep experiments of hardening normal and high strength cement pastes and are presented in Figs. 2 to 7. The size of the high frequency arc diameter (HFA) has been widely investigated and attributed to the intrinsic properties of the hardening cement paste which are pore solution conductivity, pore diameter and pore size distribution [30-32]. The figures 2 to 4 illustrate the high frequency arc of unloaded and loaded specimens of high strength cement paste (w/c=0.35) maintained in the same environmentally controlled cabinet. It can be observed that at any period of time following conditioning, the arcs in the spectra of unloaded specimens are greater than those of loaded specimens. They also increase in size with hydration and/or loading period. Spectra obtained from the difference between unloaded (shrinkage) and loaded (total strain) spectra can be considered as a result of the elastic strain and creep process.
The shrinkage of the (w/c=0.50) normal strength (18 and 24 hours old specimens) shows unusual behavior exhibiting what can be considered as two high frequency arcs (Figs. 5a and 6a). This type of non-ideal behavior has been observed by one of the authors for concrete specimens undergoing shrinkage where the electrodes were cast into the specimens. In the present study, a conductive paste was spread at each end of the specimens and the specimen-electrode contact was kept in place by a small applied pressure. The authors therefore, discount the possibility that the differences in the spectra are due to an electrode sample contact problem. Unloaded specimens undergoing drying undergo microstructural changes (pore coarsening) to a different and presumably greater extent than the loaded specimens. The differences in the spectra might also be attributed to these differences. High resistance values in drying of unloaded specimens may also be
a result of pore discontinuity accompanying microstructural change. Drying preferentially occurs first in the larger capillaries. This process can be viewed as creating a discontinuity in the pore network in terms of conductivity. The unloaded paste structure may have a progressively discontinuous pore network that can be modeled as two different capacitors while drying. The second arc disappears with the loading of these specimens implying that the load may contribute to re-establishing continuity of the pore network during hardening of the paste. Companion specimens of normal and high strength cement pastes kept continuously wet indicate that the HFA diameter increases with the hydration as already reported by several researchers [33-35]. It has been well demonstrated that during the hydration period, the bulk resistance steadily increases with time, as does the depression of the arc below the real axis. This was attributed to “a spread of relaxation times” of the ions adsorbed at the solid-liquid interfaces as hydration proceeds. The drying even at a very high relative humidity (96% in the present study) and/or the loading of the specimen during hydration may perturb the movement of ions and therefore slightly affect the relative changes of the associated depression angle.
McCarter and Garvin [36] have shown that the absolute values of resistance and reactance increase dramatically as a high proportion of the free capillary water evaporates from the matrix. Such evaporation of capillary water even at (96 ± 2)% RH may explain the high value of HFA observed on the Nyquist plots of shrinking cement paste during hydration. At this humidity level, even though part of the free capillary water is removed, adsorbed water would require a higher energy input or lower humidity to be removed from the gel surface. The load may redistribute the water within the matrix, contributing to the continuity of water throughout the capillary system and micropores.
A postulate is that during the subsequent hydration increased layering and sliding of C-S-H sheets of the loaded specimens, may decrease the pore network connectivity resulting in a substantial increase of the HFA diameter. This increase was observed for mature paste. A porosity decrease at early ages due to hydration also contributes to changes in HFA diameter.
The HFA diameter data determined from the electrical model described previously in section 2 are presented in Figs. 8 to 13. The figures in addition to curves for shrinkage, creep and creep recovery also illustrate the growth of the HFA diameter of continuously wet (100% RH) normal and high strength pastes. The elastic recovery was obtained by incrementally removing the load from the specimens. This was performed within 2 minutes. It can also be observed from the figures that on the removal of the sustained load, the HFA diameter shows an abrupt increase (elastic recovery) followed by a very slight continuous change during the recovery period. The values for the w/c=0.35 paste approach those of the shrinkage curves. The HFA diameter values following the removal of the sustained load, however, do not necessarily reach those of the shrinkage specimens (Figs. 11, 12, 13) for normal strength (w/c=0.50) cement paste (18 and 24 hours old). This may be due to the large amount of initial water in such paste, which leads to a broader pore-size distribution in the pore network at setting. The characteristics of the pore network of the matrix on loading may be altered during the subsequent hydration, which in turn may decrease the connectivity and the water available to assure the continuity.
The 18 and 24 hours old normal strength (w/c=0.50) specimens (as already mentioned) were found to have two high frequency arcs (see Figs. 5a and 6a) during the monitoring
of impedance spectra for the shrinkage test. The HFA diameter values presented in previous figures were obtained from an electrical model capable of fitting both arcs except that only the higher arc resistance values were used given the difficulty of determining the single equivalent HFA diameter associated to the electrical model chosen. Difficulty in obtaining an equivalent value of HFA diameter for the 18 and 24 hours normal strength spectra may lead to an inaccurate expression of the mathematical model relating all of them.
It is apparent from the figures described above that the size of the high frequency arc diameter (φ) is not only dependent on the pore solution conductivity, pore size and pore network characteristics because the relative humidity (rh) also appears to be an important parameter. The pore solution conductivity, pore size and pore network characteristics which are the intrinsic properties of hardening cement paste can collectively be associated with the degree of hydration of the matrix (αd). The degree of hydration at
loading (αdo) can be introduced as a variable. That part of the HFA diameter which is
associated with the loading of the specimens (∆φ) can then be said to depend on variables
αd, αdo and rh provided that all the tests are performed at the same stress-strength ratio.
The HFA diameter (φ) of hardening cement paste during a shrinkage and total strain experiment (Figs. 8 to 13) can qualitatively be related to the hydration period as illustrated in Fig. 14. The terms φshrinkage and φtotal strain of the Fig. 14 are respectively the
HFA diameter plots of unloaded and loaded specimens of hardening cement paste. The difference between them can be associated to elastic and creep strains with its initial value (∆φo) being considered as the instantaneous change in HFA diameter following
Using a similar approach to that adopted for the modeling of the compliance J [37], the changes in high frequency arc diameter (∆φ) observed can be formulated as follows:
∆φ (α
d, α
do,
rh
)
=
∆φ
ο(α
do,
rh
)
[1 +
Φ
(
α
d, α
do,
rh)]
(2)
[ ]
(2 ))
,
(
'
1
' 2)
,
(
)
,
,
(
arh
k
do
do
d
do df
rh
k
rh
α
α
α
α
α
=
Φ
) 2 ( b do do d df
α
α
α
α
=
−
As stated previously, fαd is the fractional increase in degree of hydration while under load and k'1 and k'2 are experimental parameters depending both on degree of hydration (αdo)
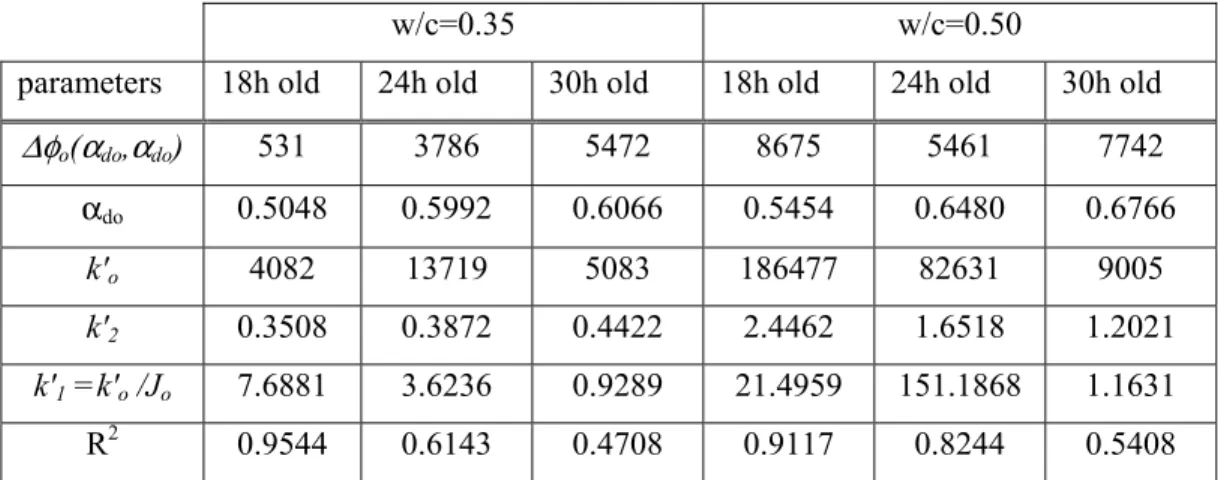
at loading and relative humidity (rh). This requires that the experiments are all conducted at the same stress-strength ratio. In the present study, the relative humidity is assumed to be constant at (96 ± 2)%; the temperature was also maintained at 22 ± 2 °C. From the impedance results presented above, experimental creep coefficients were obtained both for normal and high strength pastes and plotted against those obtained using the mathematical model previously described. The Fig. 15 shows a good correlation between the model and experimental electrical creep coefficients particularly for high strength paste. The poor correlation coefficients obtained for the electrical model creep coefficient for the normal strength paste (w/c=0.50) are believed to be due to the different type of impedance spectra for the 18 and 24 hours old specimens, than those of the 30 hours old specimens. The HFA diameter (φ) results indicate that the electrical model for
creep may not only depend on the degree of hydration (αd) as a primary variable. The
microstructural change associated with the change in HFA diameter (φ) may also significantly depend on the type of pore solution. It can be observed from previous figures that as hydration proceeds, the character of the electrolyte changes within the matrix. The electrolyte seems to be more stable in high strength paste than in normal strength paste. These observations are confirmed by the parameters k'1 and k'2 presented in Table 4 that have a very low correlation coefficient, R2.
It is also apparent that the mathematical formulation developed for HFA diameter change taking place while hydrating cement paste is subjected to a sustained load requires further investigation. Nevertheless in order to consider the effect of the electrolyte, a comparison to the compliance formulation seems useful. The high frequency arc diameter as a response to the impedance signal applied to the specimens through the stainless steel electrodes is not generally ideal or perfect. However, as described previously (section 2) most materials exhibit an inclined semicircle with the center depressed below the real axis by an angle θd.π/2 (Fig. 1c). The depression angle is a
commonly observed phenomenon in a. c. impedance studies of cement paste and the HFA diameter is then equal to R2/cos(θd.π/2). The depression angle parameter n=1-θd is
commonly used and describes the degree of perfection of the semi-circle. There may be several causes of the inclined semi-circle including factors associated with “a spread of relaxation times” of the ions adsorbed on the solid-liquid interfaces [19,30], surface roughness [38,39] and uneven current distribution at the interface.
During a creep experiment, the depression angle parameter was found to be scattered particularly in the case of normal strength (w/c=0.50) hydrating cement paste when
compared to unloaded and continuously wet companion specimens (see Fig. 16). From Fig. 16, it can also be observed for unloaded specimens that as the hydration progresses, the degree of perfection of the semi-circle improves as n-values approach 1. The depression angle parameter appears to be affected by the loading and reaches a steady state with an increase of the fractional increase in degree of hydration for the hydrating high strength (w/c=0.35) cement paste specimens.
4. Conclusions
1- The sustained loading of normal strength cement paste (w/c=0.50) applied after 18 hours hydration seems to increase the degree of hydration during early age creep compared to unloaded specimens.
2- Impedance spectra obtained during creep and shrinkage tests indicate that the HFA diameter of cement paste specimens increases with hydration. A possible explanation is that this may be due to a loss of electrolyte accompanied by a decrease of pore connectivity and/or an increase in layering following sliding between C-S-H sheets.
3- The HFA diameter of unloaded specimens is greater than that of the loaded one. This may be due to load induced redistribution of water within the matrix.
4- The effect of changes in the electrolyte composition on the impedance behavior in hydrating cement paste seems to be less pronounced in high strength paste than normal strength paste.
5- The depression angle parameter (n) systematically increases with the hydration of continuously wet unloaded hardening cement paste. However, sustained loading may contribute to the wide scatter observed for this parameter, particularly for normal strength paste (w/c=0.50).
References
1. P. GU, P. XIE, Y. FU and J. J. BEAUDOIN, Mater. Sci. of Concr. IV, The Amer. Ceram. Soc. (1995) 201.
2. P. GU, P. XIE, Y. FU and J. J. BEAUDOIN, Cem. Concr. Res. 24 (2) (1994) 704. 3. P. GU, P. XIE and J. J. BEAUDION, Adv. Cem. Res. 5 (20) (1999) 171.
4. B. J. CHRISTENSEN, T. O. MASON and H. M. JENNINGS, Jour. Am. Cer. Soc. 75 (1992) 939.
5. C. ANDRADE, V. M. BLANCO, A. COLLAZO, M. KEDDAM, X. R. NOVOA, and H. TAKENOUTI, Electrochim. Acta. 44 (1999) 4313.
6. C. ALONSO, C. ANDRADE, M. KEDDAM, X. R. NOVOA and H. TAKENOUTI, Mater. Sci. Forum. 289 (1998) 15.
7. J. R. MacDONALD, in "Impedance Spectroscopy" (John Wiley, New York, 1987) p. 274.
8. N. Mc N. ALFORD and D. D. DOUBLE in "Adsorption at the Gas-solid and Liquid- solid Interface" (J. Rouquerol and K. S. W. Sing, Elsevier Amsterdam (1982) p.259. 9. B. J. DALGLIESH, P. L. PRATT and E. TOULON, J. Mat. Sci. 7 (1982) 2199. 10. W. J. McCARTER and A. B. AFSHAR, J. Mat. Sci. 23 (1988) 488.
11. C. TASHIRA and H. SHIMAMURA, Journal of Mater. Sci. Lett. 6 (1987) 1379. 12. K. BRANTERVIK and G. A. NIKLASSON, Cem. Concr. Res. 4 (21) (1991) 496. 13. B. J. CHRISTENSEN, T. O. MASON and H. M. JENNINGS, Mat. Res. Soc. Symp. Proc., (245) (1992) 259.
14. W. J. McCARTER and S. GARVIN, Journal of Physics. D. Applied Physics 22 (11) (1989) 1773.
15. Z. XU, P. GU, P. XIE and J. J. BEAUDOIN, Cem. Concr. Res. 25 (4) (1993) 853. 16 P. GU, Z. XU, P. XIE and J. J. BEAUDOIN, Cem. Concr. Res. 23 (3) (1993) 531. 17. W. J. McCARTER and P. N. CURRAN, Mag. Concr. Res. 36 (126) (1984) 42. 18. W. J. McCARTER, S. GARVIN and N. BOUZID, J. Mater. Sci. 7 (10) (1988) 1056. 19. J. R. MacDONALD and W. B. JOHNSON, in "Impedance Spectroscopy" (J. Ross
MacDonald, John Wiley & Sons, New York, 1987) p. 346.
20. P. GU, P. XIE, Y. FU and J. J. BEAUDOIN, Cem. Concr. Res. 24 (1) (1994) 86. 21. J. J. BEAUDOIN, P. GU, P. J. TUMIDAJSKI and S. PERRON, in Proceedings of
RILEM Conference, Arles, France, 1998 p. 32.
22. M. SLUYTERS-REHBACH and J. H. SLUYTERS, in "Electroanalytical Chemistry" (A. J. Bard, Marcel Dekker, New York, 1990) p. 1.
23. K. S. COLE and R. H. COLE, J. Chem. Phys. 9 (1941) 341.
24. C. A. SCUDERI, T. O. MASON and H. M. JENNINGS, J. Mater. Sci. 26 (1991) 349. 25. N. BONANOS, B. C. H. STEELE, E. P. BUTLER, W. B. JOHNSON, W. L.
WORRELL, D. D. MacDONALD and M. C. H. McKUBRE, in "Application of Impedance Spectroscopy" (Wiley & Sons, New York, 1987) p. 93.
26. B. TAMTSIA and J.J. BEAUDOIN, Cem. and Conc. Res. 9 (30) (2000) 1465. 27. T.C. POWERS and T.L. BROWNYARD, J. Am. Conc. Inst. 43 (1967) 933. 28. U. DANIELSSON, Materials and Structures, RILEM 40 (7) (1974) 231. 29. R. F. FELDMAN, V Int. Symp. Chem. Cem. 3 (1968) 53.
30. W.J. McCARTER and P.N. CURRAN, Mag. of Concr. Res. 126 (36) (1984) 42. 31. Z. XU, P. GU, P. XIE and J.J BEAUDOIN, Cem. and Concr. Res. 4 (25) (1993) 853. 32 P. GU, Z. XU, P. XIE and J.J. BEAUDOIN, Cem. and Concr. Res. 3 (23) (1993) 531.
33. C. A. SCUDERI, T. O. MASON and H. M. JENNINGS, J. Mater. Sci. 26 (1991) 349. 34. W.J. McCARTER, S. GARVIN and N.J. BOUZID, J. Mater. Sci. Lett. 10 (7) (1988) 1056.
35. P. GU, P. XIE, J.J. BEAUDOIN and R. BROUSSEAU, Cem. Conc. Res. 22 (5) (1992) 833.
36. W.J. McCARTER and S. GARVIN, Journal of physics, D: Applied Physics 22 (11) (1989) 1773.
37. B. T. TAMTSIA, J. J. BEAUDOIN and J. MARCHAND, Submitted to: J. Mater. Sci. (2001) 28 p.
38. R. De LEVIE, Electrochimica Acta 10 (1965) 113.
Table 1: Degree of hydration and Ca(OH)2 content of hardening cement paste (w/c=0.35) loaded at 18, 24 and 30 hours at a stress/strength ratio of 0.3 at age of loading.
Unloaded sample Loaded sample
Age
Degree of hydration Ca(OH)2 content Degree of hydration Ca(OH)2 content
18h 0.54 0.068 0.54 0.068 24h 0.64 0.073 0.57 0.072 30h 0.65 0.079 0.62 0.078 42h 0.74 0.080 0.66 0.080 24h 0.65 0.078 0.65 0.078 36h 0.71 0.080 0.67 0.083 48h 0.77 0.084 0.70 0.087 72h 0.84 0.091 0.78 0.089 30h 0.67 0.081 0.67 0.081 54h 0.79 0.086 0.77 0.088 78h 0.82 0.089 0.79 0.088 102h 0.88 0.088 0.81 0.090
Table 2: Degree of hydration and Ca(OH)2 content of hardening cement paste (w/c=0.50) loaded at 18, 24 and 30 hours at a stress/strength ratio of 0.3 at age of loading.
Unloaded sample Loaded sample
Age
Degree of hydration Ca(OH)2 content Degree of hydration Ca(OH)2 content
18h 0.50 0.064 0.50 0.064 24h 0.55 0.068 0.79 0.076 30h 0.63 0.075 0.86 0.077 42h 0.73 0.079 0.88 0.083 24h 0.60 0.075 0.60 0.075 36h 0.70 0.079 0.69 0.078 48h 0.72 0.086 0.71 0.084 72h 0.81 0.093 0.78 0.089 30h 0.61 0.080 0.61 0.080 54h 0.80 0.087 0.73 0.085 78h 0.78 0.090 0.79 0.088 102h 0.80 0.092 0.77 0.093
Table 3: Strain, modulus of elasticity and compliance of hydrating Portland cement paste Age at loading (hours) εe (µm/m) E (GPa) εsh (µm/m) after 3 days εtotal (µm/m) after 3 days J (µm/m/MPa) after 3 days 18 360 20.7 152 811 87.9 24 640 20.8 176 1153 73.5 w/c = 0.35 30 750 21.5 248 2248 124.2 18 577 7.9 20 1646 353.5 24 623 10.4 80 1614 236.0 w/c = 0.50 30 625 11.6 260 1297 142.1
Table 4: Electrical model parameters
w/c=0.35 w/c=0.50
parameters 18h old 24h old 30h old 18h old 24h old 30h old
∆φo(αdo,αdo) 531 3786 5472 8675 5461 7742 αdo 0.5048 0.5992 0.6066 0.5454 0.6480 0.6766 k'o 4082 13719 5083 186477 82631 9005 k'2 0.3508 0.3872 0.4422 2.4462 1.6518 1.2021 k'1 =k'o /Jo 7.6881 3.6236 0.9289 21.4959 151.1868 1.1631 R2 0.9544 0.6143 0.4708 0.9117 0.8244 0.5408
Figure Legends
Figure 1: (a) Schematic plot of a high frequency arc in the impedance complex plane obtained
for cement paste systems. (b) A simplified electrical equivalent circuit for hydrating
cement systems. R1, R2, and C2 are high-frequency resistance, solid-liquid interface
resistance and capacitance. Rct and Cdl are cement-electrode interface charge
transfer resistance and double layer capacitance.
(c) An inclined semicircle showing its center depressed below the real axis by an
angle θd.π/2.
(d) Detail of “T-shaped” specimen-electrode connection interface.
Figure 2: AC impedance spectra: (a) shrinkage and (b) total strain of 18 hours old hardening
cement paste (w/c=0.35); specimens conditioned at about 96% RH for 0, 1, 2, 3.7, 6.5, 9, 12.7, 24, 48 and 72 hours after loading.
Figure 3: AC impedance spectra: (a) shrinkage and (b) total strain of 24 hours old hardening
cement paste (w/c=0.35); specimens conditioned at about 96% RH for 0, 1, 2, 3.7, 6.5, 9, 12.7, 24, 48 and 72 hours after loading.
Figure 4: AC impedance spectra: (a) shrinkage and (b) total strain of 30 hours old hardening
cement paste (w/c=0.35); specimens conditioned at about 96% RH for 0, 1, 2, 3.7, 6.5, 9, 12.7, 24, 48 and 72 hours after loading.
Figure 5: AC impedance spectra: (a) shrinkage and (b) total strain of 18 hours old hardening
cement paste (w/c=0.50); specimens conditioned at about 96% RH for 0, 1, 2, 3.7, 6.5, 9, 12.7, 24, 48 and 72 hours after loading
Figure 6: AC impedance spectra: (a) shrinkage and (b) total strain of 24 hours old hardening
cement paste (w/c=0.50); specimens conditioned at about 96% RH for 0, 1, 2, 3.7, 6.5, 9, 12.7, 24, 48 and 72 hours after loading.
Figure 7: AC impedance spectra: (a) shrinkage and (b) total strain of 30 hours old hardening
cement paste (w/c=0.50); specimens conditioned at about 96% RH for 0, 1, 2, 3.7, 6.5, 9, 12.7, 24, 48 and 72 hours after loading.
Figure 8: Evolution of the high frequency-arc diameter (φ) of unloaded and loaded 18 hours old hardening cement paste (w/c=0.35) specimens tested at about 96% RH.
Figure 9: Evolution of the high frequency-arc diameter (φ) of unloaded and loaded 24 hours old hardening cement paste (w/c=0.35) specimens tested at about 96% RH.
Figure 10: Evolution of the high frequency-arc diameter (φ) of unloaded and loaded 30 hours old hardening cement paste (w/c=0.35) specimens tested at about 96% RH.
Figure 11: Evolution of the high frequency-arc diameter (φ) of unloaded and loaded 18 hours old hardening cement paste (w/c=0.50) specimens tested at about 96% RH.
Figure 12: Evolution of the high frequency-arc diameter (φ) of unloaded and loaded 24 hours old hardening cement paste (w/c=0.50) specimens tested at about 96% RH.
Figure 13: Evolution of the high frequency-arc diameter (φ) of unloaded and loaded 30 hours old hardening cement paste (w/c=0.50) specimens tested at about 96% RH.
Figure 14: Schematic variation of High frequency-arc diameter (φ)during a total strain and shrinkage experiment of hardening cement paste specimens tested at about 96% RH.
Figure 15: Comparison of electrical model and experimental creep coefficients for high
strength (w/c=0.35) and normal strength (w/c=0.50) hardening cement pastes while conditioning at 96% RH.
Figure 16: Depression angle parameter n of high strength (w/c=0.35) and normal strength
Authors: Basile T. Tamtsiaa, James J. Beaudoina and Jacques Marchandb
Electrode effect Bulk cement paste effect
Rct Cdl C2 R2 R1 Electrode effect Bulk cement paste effect
R1+R2
R1 Real (ohms)
Imaginary (ohms)
(a)
(b)
Figure 1. (a) Schematic plot of a high frequency arc in the impedance complex plane obtained for cement paste systems. (b) A simplified electrical equivalent circuit for hydrating cement systems. R1, R2, and C2 are high-frequency resistance, solid-liquid interface resistance and capacitance. Rct and Cdl are cement-electrode interface charge transfer resistance and double layer capacitance.
Authors: Basile T. Tamtsiaa, James J. Beaudoina and Jacques Marchandb
Real (ohms)
Imaginary (ohms)
R1 R1+R2
Bulk cement paste effect
Electrode effect
d
ωincrease
HFA diameter = R2/cos( .θdπ/2) θ.π/2
Figure 1c: An inclined semicircle showing its center depressed below the
Authors: Basile T. Tamtsiaa, James J. Beaudoina and Jacques Marchandb
T-shaped specimen
Stainless steel electrode interface
Tefflon insulation
5.75 mm 12.7 mm
∼1.25 mm
Authors: Basile T. Tamtsiaa, James J. Beaudoina and Jacques Marchandb -20 0.16 0.4 0.8 2 0.5 1 2 5 5
Dots indicate the corresponding frequencies in MHz time increasing (a) unloaded Imaginar y, ohms x 1 0 3 -15 -10 -5 0 0 5 10 15 20 25 Real, ohms x 103 -20 5 0.16 0.4 0.8 2 0.5 1 2 5
Dots indicate the corresponding frequencies in MHz time increasing (b) loaded Imaginar y, ohms x 1 0 3 -15 -10 -5 0 15 20 25 0 5 10 Real, ohms x 103
Figure 2: AC impedance spectra: (a) shrinkage and (b) total strain of 18 hours old hardening cement paste (w/c=0.35); specimens conditioned at about 96% RH for 0, 1, 2, 3.7, 6.5, 9, 12.7, 24, 48 and 72 hours after loading
Authors: Basile T. Tamtsiaa, James J. Beaudoina and Jacques Marchandb -25 5 0.03 0.5 0.2 1.3 0.4 1.6 5
Dots indicate the corresponding frequencies in MHz increasing time (a) unloaded Imaginar y, ohms x 1 0 3 -20 -15 -10 -5 0 0 5 10 15 20 25 30 35 40 Real, ohms x 103 5 0.1 0.8 0.32 1.6 0.4 1.6 5
Dots indicate the corresponding frequencies in MHz -25 increasing time (b) loaded 0 -5 -10 -15 -20 Imaginar y, ohms x 1 0 3 35 40 0 5 10 15 20 25 30 Real, ohms x 103
Figure 3: AC impedance spectra: (a) shrinkage and (b) total strain of 24 hours old hardening cement paste (w/c=0.35); specimens conditioned at about 96% RH for 0, 1, 2, 3.7, 6.5, 9, 12.7, 24, 48 and 72 hours after loading
Authors: Basile T. Tamtsiaa, James J. Beaudoina and Jacques Marchandb -20 0.5 5 0.1 0.8 0.32 1.6 1 2 5
Dots indicate the corresponding frequencies in MHz time increasing (a) unloaded Imaginar y, ohms x 1 0 3 -15 -10 -5 0 10 15 20 25 30 0 5 Real, ohms x 103 -20 0.25 0.63 5 0.08 0.63 0.25 1.6 1.26 2.5 5
Dots indicate the corresponding frequencies in MHz increasing time (b) loaded Imaginar y, ohms x 1 0 3 -15 -10 -5 0 0 5 10 15 20 25 30 Real, ohms x 103
Figure 4: AC impedance spectra: (a) shrinkage and (b) total strain of 30 hours old hardening cement paste (w/c=0.35); specimens conditioned at about 96% RH for 0, 1, 2, 3.7, 6.5, 9, 12.7, 24, 48 and 72 hours after loading
Authors: Basile T. Tamtsiaa, James J. Beaudoina and Jacques Marchandb
The dot lines correspond to the separation of the two high frequency arc diameters
increasing time (a) unloaded -100 -80 Imaginar y, ohms x 1 0 3 -60 -40 -20 0 0 20 40 60 80 100 120 Real, ohms x 103 -20
Dots indicate the corresponding frequencies in MHz (b) loaded 0.16 increasing time 0.63 5 0.1 0.32 2 0.8 2 5 Imaginar y, ohms x 1 0 3 -15 -10 -5 0 0 5 10 15 20 25 Real, ohms x 103
Figure 5: AC impedance spectra: (a) shrinkage and (b) total strain of 18 hours old hardening cement paste (w/c=0.50); specimens conditioned at about 96% RH for 0, 1, 2, 3.7, 6.5, 9, 12.7, 24, 48 and 72 hours after loading
Authors: Basile T. Tamtsiaa, James J. Beaudoina and Jacques Marchandb
The dot lines correspond to the separation of the two high frequency arc diameters
increasing time (a) unloaded 0 0 20 40 60 -20 -40 -60 -80 -100 Imaginar y, ohms x 1 0 3 80 100 120 Real, ohms x 103
Dots indicate the corresponding frequencies in MHz (b) loaded -10 -20 -30 -40 -50 increasing time 0.05 0.2 0.004 0.16 0.03 0.8 0.5 1.26 5 Imaginar y, ohms x 1 0 3 0 0 10 20 30 40 50 60 70 80 Real, ohms x 103
Figure 6: AC impedance spectra: (a) shrinkage and (b) total strain of 24 hours old hardening cement paste (w/c=0.50); specimens conditioned at about 96% RH for 0, 1, 2, 3.7, 6.5, 9, 12.7, 24, 48 and 72 hours after loading
Authors: Basile T. Tamtsiaa, James J. Beaudoina and Jacques Marchandb -50 0.02 0.1 0.32 0.08 0.8 1 5
Dots indicate the corresponding frequencies in MHz time increasing (a) unloaded 0 Imaginar y, ohms x 1 0 3 -40 -30 -20 -10 0 70 60 40 80 90 100 10 20 30 50 Real, ohms x 103 0.02 0.1 0.32 1 0.08 0.8 5
Dots indicate the corresponding frequencies in MHz time increasing (b) loaded -20 -30 -40 -50 Imaginar y, ohms x 1 0 3 -10 0 90 100 0 10 20 30 40 50 60 70 80 Real, ohms x 103
Figure 7: AC impedance spectra: (a) shrinkage and (b) total strain of 30 hours old hardening cement paste (w/c=0.50); specimens conditioned at about 96% RH for 0, 1, 2, 3.7, 6.5, 9, 12.7, 24, 48 and 72 hours after loading
Authors: Basile T. Tamtsiaa, James J. Beaudoina and Jacques Marchandb
35
continuously wetted creep
Recovery (elastic + creep) shrinkage 30 HFA d iame ter φ , ohm s x 10 3 25 20 15 10 5 0 0 20 40 60 80 100 120 140 160 180
Hydration period, in hours
Figure 8: Evolution of the high frequency-arc diameter (φ) of unloaded and loaded 18 hours old
Authors: Basile T. Tamtsiaa, James J. Beaudoina and Jacques Marchandb
50
Creep
Recovery (elastic + creep) continuously wetted shrinkage 45 40 HFA d iame ter φ , ohm s x 10 3 35 30 25 20 15 10 5 0 0 20 40 60 80 100 120 140 160 180
Hydration period, in hours
Figure 9: Evolution of the high frequency-arc diameter (φ) of unloaded and loaded 24 hours old
Authors: Basile T. Tamtsiaa, James J. Beaudoina and Jacques Marchandb
40
creep
Recovery (elastic + creep) continuously wetted shrinkage 35 30 HFA d iame ter φ , ohm s x 10 3 25 20 15 10 5 0 0 20 40 60 80 100 120 140 160 180 200
Hydration period, in hours
Figure 10: Evolution of the high frequency-arc diameter (φ) of unloaded and loaded 30 hours old
Authors: Basile T. Tamtsiaa, James J. Beaudoina and Jacques Marchandb
160
shrinkage creep
Recovery (elastic + creep) continuously wetted 140 120 HFA d iame ter φ , ohm s x 10 3 100 80 60 40 20 0 0 20 40 60 80 100 120 140 160 180
Hydration period, in hours
Figure 11: Evolution of the high frequency-arc diameter (φ) of unloaded and loaded 18 hours old
Authors: Basile T. Tamtsiaa, James J. Beaudoina and Jacques Marchandb
160
shrinkage
Recovery (elastic + creep) continuously wetted creep 140 120 HFA d iame ter φ , ohm s x 10 3 100 80 60 40 20 0 0 20 40 60 80 100 120 140 160 180
Hydration period, in hours
Figure 12: Evolution of the high frequency-arc diameter (φ) of unloaded and loaded 24 hours old
Authors: Basile T. Tamtsiaa, James J. Beaudoina and Jacques Marchandb
140
shrinkage creep
Recovery (elastic + creep) continuously wetted 120 HFA d iame ter φ , ohm s x 10 3 100 80 60 40 20 0 0 20 40 60 80 100 120 140 160 180 200
Hydration period, in hours
Figure 13: Evolution of the high frequency-arc diameter (φ) of unloaded and loaded 30 hours old
Authors: Basile T. Tamtsiaa, James J. Beaudoina and Jacques Marchandb
∆φ ∆φ : change in HFA (φ) between
unloaded and loaded specimens
∆φo : initial change in HFA associated
with the elastic compressive strain to : age of the paste at loading
Φ : creep coefficient Φ∆φo ∆φo φtotal strain φshrinkage t to φ High freq uency arc diam eter,
Age of the hardening cement paste
Figure 14: Schematic variation of High frequency-arc diameter (φ)during a total strain and
Authors: Basile T. Tamtsiaa, James J. Beaudoina and Jacques Marchandb w/c=0.35 Φ (model) = 0.9910 Φ (experiment) R2 = 0.9876 0 1 2 3 4 5 6 7 0 1 2 3 4 5 6 7
experimental creep coefficient Φ(αd,αdo,rh) e lec tr ic al m o d e l cr ee p co e ff ici e n t Φ (α d ,α do ,r h ) w/c=0.50 Φ (model) = 0.9102 Φ (experiment) R2 = 0.8105 0 5 10 15 20 25 0 5 10 15 20
experimental creep coefficient Φ (αd, αdo, rh) e lec tr ic al m o d e l cr ee p co e ff ici e n t Φ ( α d , α do , rh )
Figure 15: Comparison of electrical model and experimental creep coefficients for high strength (w/c=0.35) and normal strength (w/c=0.50) hardening cement pastes while conditioning at 96% RH
Authors: Basile T. Tamtsiaa, James J. Beaudoina and Jacques Marchandb 0.85 0.90 0.95 1.00 0 0.2 0.4 0.6 0.8 1
fractional increase in degree of hydration, fαd
d e p ressio n an g le p a ra m e te r, n n-loaded n-unloaded w /c=0.35 0.85 0.90 0.95 1.00 0 0.2 0.4 0.6 0.8 1
fractional increase in degree of hydration, fαd
d e p ressio n an g le p a ra m e te r, n n-loaded n-unloaded w /c=0.50
Figure 16: Depression angle parameter n of high strength (w/c=0.35) and normal strength (w/c=0.50) hardening cement pastes while conditioning at 96% RH