The SUrvey for Pulsars and Extragalactic Radio Bursts II: New FRB
discoveries and their follow-up
S. Bhandari,
1,2,3
∗
E. F. Keane,
4,1,2
E. D. Barr,
9,1,2
A. Jameson,
1,2
E. Petroff,
5,1,2,3
S. Johnston,
3
M. Bailes,
1,2
N. D. R. Bhat,
2,10
M. Burgay,
11
S. Burke-Spolaor,
6,7
M. Caleb,
2,12
R. P. Eatough,
9
C. Flynn,
1,2
J. A. Green,
3
F. Jankowski,
1,2
M. Kramer,
9,15
V.Venkatraman Krishnan,
1,2
V. Morello,
9,1
A. Possenti,
11
B. Stappers,
15
C. Tiburzi,
16
W. van Straten,
1,17
I. Andreoni,
1,2,8
T. Butterley,
29
P. Chandra,
13
J. Cooke,
1
A.Corongiu,
11
D.M. Coward,
21
V. S. Dhillon,
15,27
R. Dodson,
24
L. K. Hardy,
14
E.J. Howell,
21
P. Jaroenjittichai,
30
A. Klotz,
22,23
S. P. Littlefair,
15
T. R. Marsh,
28
M. Mickaliger,
15
T. Muxlow,
15
D. Perrodin,
11
T. Pritchard,
1
U. Sawangwit,
30
T. Terai,
25
N. Tominaga,
19,31
P. Torne,
9
T. Totani,
20
A. Trois,
11
D.Turpin,
22,23
Y. Niino,
26
R. W. Wilson,
29
The ANTARES Collaboration.
†
Accepted XXX. Received YYY; in original form ZZZ
ABSTRACT
We report the discovery of four Fast Radio Bursts (FRBs) in the ongoing SUrvey for Pulsars and Extragalactic Radio Bursts (SUPERB) at the Parkes Radio Telescope: FRBs 150610, 151206, 151230 and 160102. Our real-time discoveries have enabled us to conduct extensive, rapid multi-messenger follow-up at 12 major facilities sensitive to radio, optical, X-ray, gamma-ray photons and neutrinos on time scales ranging from an hour to a few months post-burst. No counterparts to the FRBs were found and we provide upper limits on afterglow luminosities. None of the FRBs were seen to repeat. Formal fits to all FRBs show hints of scattering while their intrinsic widths are unresolved in time. FRB 151206 is at low Galactic latitude, FRB 151230 shows a sharp spectral cutoff, and FRB 160102 has the highest dispersion measure (DM = 2596.1±0.3 pc cm−3) detected to date. Three of the FRBs have high dispersion measures (DM >1500 pc cm−3), favouring a scenario where the DM is dominated by contributions from the Intergalactic Medium. The slope of the Parkes FRB source counts distribution with fluences > 2 Jy ms is α = −2.2+0.6
−1.2and still consistent with a Euclidean distribution (α = −3/2). We
also find that the all-sky rate is 1.7+1.5−0.9× 10³FRBs/(4π sr)/day above ∼ 2 Jy ms and there is currently no strong evidence for a latitude-dependent FRB sky-rate.
Key words: surveys − radiation mechanisms: general − intergalactic medium − radio
contin-uum: general − methods: observational − methods: data analysis
1 INTRODUCTION
High-time resolution studies of the radio Universe have led to the discovery of Fast Radio Bursts (FRBs). First seen in 2007 in archival Parkes radio telescope data (Lorimer et al. 2007), FRBs have disper-sion measures (DMs) which can exceed the Milky Way contribution by more than an order of magnitude (Petroff et al. 2016) and typi-cally have durations of a few milliseconds. In the past couple of years
∗Email: shivanibhandari58@gmail.com
†Full author list and affiliations included at the end of the paper
the discovery rate has accelerated — including those reported here, there are now 31 FRBs known — which include discoveries from the Green Bank Telescope (GBT), the Parkes radio telescope, the Arecibo Observatory, the upgraded Molonglo synthesis telescope (UTMOST) and the Australian SKA Pathfinder (ASKAP) (Lorimer et al. 2007;Keane et al. 2012;Thornton et al. 2013;Burke-Spolaor & Bannister 2014;Spitler et al. 2014;Petroff et al. 2015a;Ravi et al. 2015;Champion et al. 2016;Masui et al. 2015;Keane et al. 2016;
Ravi et al. 2016;Petroff et al. 2017;Caleb et al. 2017;Bannister et al. 2017).
The origin of these bursts is currently unknown, with leading
theories suggesting giant flares from magnetars (Thornton et al. 2013;Pen & Connor 2015), compact objects located in young ex-panding supernovae (Connor et al. 2016;Piro 2016) and supergiant pulses from extragalactic neutron stars (Cordes & Wasserman 2016) as possible progenitors. Other theories involve cataclysmic models including neutron star mergers (Totani 2013) and “blitzars” occur-ring when a neutron star collapses to a black hole (Falcke & Rezzolla 2014).
Independent of the physical mechanism/process, an FRB may leave an afterglow through interaction with the surrounding medium.Yi et al.(2014) have estimated FRB afterglow luminosi-ties, using standard GRB afterglow models in radio, optical and X-ray bands, assuming a plausible range of total kinetic energies and redshifts.Lyutikov & Lorimer(2016) have discussed possible electromagnetic counterparts for FRBs; searching for such counter-parts is thus one strategy for localising FRB host galaxies.Chatterjee et al.(2017) directly localised the repeating FRB 121102 (Spitler et al. 2016) using the Karl G. Jansky Very Large Array Telescope (VLA) and identified its host to be a dwarf galaxy at a redshift z ∼ 0.2 (Tendulkar et al. 2017). The host is co-located with a per-sistent variable radio source. Additionally, the radio follow-ups of FRB 131104 (Shannon & Ravi 2016) and FRB 150418 (Keane et al. 2016;Johnston et al. 2017) have shown the presence of variable ra-dio emission from Active Galactic Nuclei (AGN) in the fields of FRBs.
The SUrvey for Pulsars and Extragalactic Radio Bursts (SU-PERB) is currently ongoing at the Parkes radio telescope and is described in detail inKeane et al.(2017), hereafter Paper 1. Ini-tial results from the SUPERB survey have already been published elsewhere — this includes investigations into radio frequency inter-ference (RFI) at the Parkes site (Petroff et al. 2015c), the discovery of FRB 150418 (Keane et al. 2016) and the discovery of new pulsars (Paper 1). Here we report further results from the survey, in par-ticular the discovery of four new FRBs —150610, 151206, 151230 and 160102 — as well as the multi-messenger follow-up of the four FRBs.In §2, we provide an overview of the observations and techniques for the FRB search. Next we present the new FRB dis-coveries and their properties in §3. FRB multi-messenger follow-up observations and their results are described in §4. Finally, in §5and §6we present our conclusions and discuss the implications of our results.
2 OBSERVATIONS AND TECHNIQUES
The full details of the SUPERB observing system and analysis setup can be found in Paper 1; here we briefly summarise the key points relevant to this work. Real-time searches are conducted for both transient and periodic signals in the incoming data. These data are also searched offline through a more rigorous process which operates slower than real time. These two streams are called the “Fast" (F) and “Thorough" (T) pipelines, respectively. For the single pulse pipeline, data are acquired in the form of a time, frequency and total intensity matrix. These are fed to the transient detection pipeline, heimdall1, which applies sliding boxcar filters of various widths and performs a threshold search. This produces candidate detections that are classified as FRBs if they meet the following
1 https://sourceforge.net/projects/heimdall-astro/ criteria: DM ≥ 1.5 × DMGalaxy S/N ≥ 8 Nbeams,adj≤ 4 W ≤ 262.14 ms Nevents(tobs− 2s → tobs+ 2s) ≤ 5
(1)
where DM and DMGalaxyare the dispersion measures of the
candi-date and the Milky Way contribution along the line of sight, respec-tively. The latter is estimated using the NE2001 model (Cordes & Lazio 2002). S/N is the peak signal-to-noise ratio of the candidate, Nbeams,adjis the number of adjacent beams in which the candidate
is detected and W is the width of the boxcar. The final criterion measures the number of candidates detected within a 4-second win-dow centred on the time of occurrence of the pulse. If there are too many candidates in a time region around the candidate of interest, it is flagged as RFI. These criteria are followed by the T-pipeline, and for the purposes of keeping the processing to real-time, for the F-pipeline, we raise the detection threshold to S/N ≥ 10 and only search for pulses with widths W ≤ 8.192 ms. When a candidate meets these criteria, an alert email is issued and an astronomer eval-uates a series of diagnostic plots to determine the validity of the candidate. If the candidate is deemed credible, multi-wavelength follow-up is triggered. Upon detection of a candidate matching the above criteria, 8-bit full-Stokes data are saved to disk for further offline processing.
3 FRB DISCOVERIES
The individual pulse profiles for the FRBs are shown in Fig1and Table1presents their measured and derived properties. The FRBs were detected in single beam of the Parkes multi-beam receiver. Each FRB has a positional uncertainty with a radius of 7.50. The inferred properties including redshift, energy, co-moving and lumi-nosity distance are derived using the YMW16 model (Yao et al. 2017) of the electron density in the Milky Way. Our results are consistent within the uncertainties if we adopt the NE2001 model (Cordes & Lazio 2002) instead. To measure the scattering proper-ties of the bursts, the procedure adopted inChampion et al.(2016) was applied. The resulting scattering time was scaled to a standard frequency of 1 GHz, using a spectral index of −4. In the fitting process, we varied the assumed intrinsic width of the burst and find in all cases that the best fit is given by a burst duration that is solely determined by a combination of DM-smearing across the filterbank channels and interstellar scattering. Hence, due to the high DM of the FRBs reported here, all four FRBs are unresolved in width. We note that the estimated isotropic energies of the FRBs at source had an incorrect redshift correction inCaleb et al.(2016). The FRBs analysed at that time were mainly at redshifts z < 1, and the conclu-sions of the paper are unaffected. In this paper, three of the reported FRBs have DM > 1500 pc cm−3, for which cosmological effects become important. We followHogg(2000) and estimate the in-band intrinsic energies of the FRBs as:
E(J)=Fobs× BW × 4πD
2 L× 10
−29
(1 + z)1+α (2)
where Fobs is the observed fluence for FRBs in Jy ms, BW is
the bandwidth at Parkes in Hz, DL is the luminosity distance in
of the source. Note that the denominator incorporates both the k-correction for the spectral index and the time-dilation k-correction. Since we generally assume the spectral index to be flat and thus α = 0, there is no k-correction in practice.
FRB 150610 was not detected in the F-pipeline. The reason
for this was the final selection criterion described in Equation1. At the time of observation, the number of events detected in a 4-second window did not make a distinction by beam and as such was overly harsh. In this case, one beam (beam 10) had a large number of RFI events in the time window, which resulted in all other (unrelated) beams being flagged. This criterion has since been corrected in the F-pipeline. FRB 150610 was discovered in the T-pipeline which makes less severe cuts to generated candidates. Since this burst was found in the offline processing, no prompt follow-up observations could be performed upon detection. The burst is slightly scattered but unresolved.2 We determine the frequency dependence of the observed dispersion, tdelay∝ DM × ν
−β
, to be β = 2.000 ± 0.008, perfectly consistent with a cold-plasma law.
FRB 151206 fell just between search trials in the F pipeline,
placing it slightly below the detection threshold. However the T-pipeline (which samples DM parameter space more completely) identified it soon after. As a result the full-Stokes data were not retained and no polarisation information is available. The burst is unresolved and slightly scattered. The limited signal-to-noise ratio prevents a fit for the DM index. The trigger was issued only 25 hours after the time of occurrence and eleven telescopes observed the Parkes position over the following days to months. Observations and results from each of these telescopes are described in §4.
FRB 151230 shows peak intensity near the centre of our
ob-serving band, similar to some of the events described inSpitler et al.
(2016) for FRB 121102. The FRB is bright in the upper 200 MHz of the band and disappears at the lower frequencies in the band, below 1300 MHz. The burst is unresolved and shows scattering, possibly partly responsible for the non-detection at the lowest frequencies. We can determine the DM-index to be β = 2.00 ± 0.03. This burst was discovered by the F-pipeline, an alert was raised, and a trigger was issued to telescopes after an hour of the detection. This burst was followed up by 12 telescopes ranging from radio to gamma-ray wavelengths.
FRB 160102 is the highest-DM FRB yet observed with DM
= 2596.1±0.3 pc cm−3, and has an inferred luminosity distance of 17 Gpc, assuming the nominal redshift z = 2.1 from the models of
Ioka(2003) andInoue et al.(2014) for the observed DM excess. We find indications of scattering and determine the DM-index to β = 2.000 ± 0.007. For this FRB, a trigger was issued approximately one hour after the event and this burst was followed up by 8 telescopes spanning radio to gamma-ray wavelengths.
4 FOLLOW-UP STUDIES
Follow-up observations of each FRB’s field were carried out with four optical telescopes, nine radio telescopes, one high energy tele-scope and the ANTARES neutrino detector. Fig.2shows the sum-mary of observations performed on each field. Imaging observations with radio and optical telescopes were performed in order to search for any variable or transient sources that might be associated with the FRBs. Radio follow-up also included searching for repeat pulses
2
In the lowest subbands a second peak is visible, but statistical tests suggest that it is not significant and caused by noise fluctuations.
from each FRB location. A complete record of all observations per-formed is included in TablesA1toA4in the Appendix.
4.1 Radio follow-up for repeat bursts
Follow-up observations were performed with the Parkes telescope using the Berkeley Parkes Swinburne Recorder (BPSR) observing setup (Keith et al. 2010) immediately after the discovery of each real-time FRB. The Sardinia radio telescope (SRT;Bolli et al. 2015) observed the FRB fields in single pulse search mode at a centre fre-quency of 1548 MHz with a bandwidth of 512 MHz. Observations were also performed by the Lovell and Effelsberg radio telescopes (Lovell 1985;Hachenberg et al. 1973) in L-Band (1.4 GHz) and single pulse searches were performed with PRESTO (Ransom et al. 2002) around the DM of the FRB. The UTMOST telescope (Bailes et al. 2017) also observed three of the FRB fields (all except FRB 150610). The UTMOST observations were performed at 843 MHz with a bandwidth of 31 MHz in fan beam mode with 352 fan beams covering 4° × 2.8° (seeCaleb et al.(2017) for the details of this ob-serving mode). The details of the time spent on each FRB field are listed in Table2. None of the observations showed repeated bursts from their respective FRB fields.
4.2 Radio interferometric follow-up for possible counterparts
Radio imaging observations were performed using the Australian Telescope Compact Array (ATCA) (Wilson et al. 2011), VLA, the Giant Metrewave Radio Telescope (GMRT) (Ananthakrishnan 1995) and the e-Merlin radio telescope (Garrington et al. 2004), spanning 4 to 8 GHz and 1 to 1.4 GHz. The details of the observa-tions, data analysis and variability criteria are listed in AppendixB. Here we present the results of the follow-ups and the implications of the variability are discussed in §5.
FRB 151206: ATCA observed the field of FRB 151206 on
2015 December 9, 3 days after the burst. Visibilities were integrated for 3 hours yielding a radio map with an rms noise of 50 µJy/beam at 5.5 GHz and 60 µJy/beam at 7.5 GHz. The declination of the FRB field (δ = −04°) was not favourable for ATCA observations, there-fore no subsequent observations were performed and no variability analysis was conducted on these data.
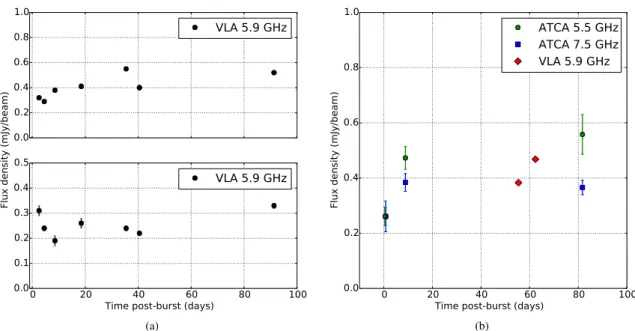
This field was observed for eight epochs with the VLA starting from 2015 December 8. The radio images reached an rms of 10 − 25 µJy/beam. Observations at epoch 3 were severely affected by RFI and hence excluded from the analysis. To form mosaic images, each of the 7 single pointings were stitched together for every epoch and were deconvolved using the clean algorithm (Högbom 1974). Two significantly variable sources were detected in this field, details of which are listed in Table4. Fig.3(a)shows their light curves. No non-radio counterpart was identified for either of the sources.
Observations were performed with the GMRT on 2015 Decem-ber 9. The field was observed for 4 hours and the map yielded an rms of 30 µJy/beam. No subsequent observations were performed and no variability analysis was conducted on these data.
The field was also observed with e-Merlin on 2015 December 7 and 8. Observations ran from 14:00–19:30 UTC on December 7 and 09:30–19:30 on December 8. A total of 1,945 overlapping fields were imaged and then combined using the AIPS task FLATN. The combined image covered a circular area of 100diameter and has an rms of 34 µJy/beam (beam size =171 × 31 mas, PA=19.4°). At the declination of the source, snapshot imaging is quite challenging for e-Merlin, so the combined full sensitivity image from 1.5 runs was
Figure 1. The pulse profiles of the four new FRBs de-dispersed to their best-fitting DM values: clock-wise from top left FRB 150610, FRB 151206, FRB 160102 and FRB 151230. The top panel shows the time series, frequency averaged to one channel and the bottom panel shows the spectrum of the pulse. The data have been time averaged to 1 ms, 0.6 ms, 0.8 ms and 0.5 ms per sample for FRB 150610, FRB 151206, FRB 160102 and FRB 151230 respectively. The flux density scale in the upper panel of individual pulses is derived from the radiometer equation. See table1for the dispersion smearing times within a single channel for each FRB.
Table 1. The observed and inferred (model-dependent) properties for FRBs 150610, 151206, 151230 and 160102. The model-dependent properties are derived using the YMW16 model (Yao et al. 2017) of the electron density in the Milky Way. For the cosmological parameters we use CosmoCalc (Wright 2006), adopting H0= 69.9 km s−1Mpc−1, ΩM= 0.286 and ΩΛ= 0.714. The error in the isotropic energy estimate is dominated by the error in the fluence.
FRB YYMMDD FRB 150610 FRB 151206 FRB 151230 FRB 160102
Measured Properties
Event time at 1.4 GHz UTC 2015-06-10 05:26:59.396 2015-12-06 06:17:52.778 2015-12-30 16:15:46.525 2016-01-02 08:28:39.374
Parkes beam number 02 03 04 13
RA, DEC (J2000) 10:44:26, −40:05:23 19:21:25, −04:07:54 09:40:50, −03:27:05 22:38:49, −30:10:50
(`, b) 278.0°, 16.5° 32.6°, −8.5° 239.0°, 34.8° 18.9°, −60.8°
Signal to noise ratio, (S/N) 18 10 17 16
Dispersion measure, DM (pc cm−3) 1593.9±0.6 1909.8±0.6 960.4±0.5 2596.1±0.3
Scattering time at 1 GHz (ms) 3.0±0.9 11±2 18±6 4±1
Measured width, W50 (ms) 2.0±1.0 3.0±0.6 4.4±0.5 3.4±0.8
Instrumental dispersion smearing (ms) 2.0 2.3 1.2 3.2
Observed peak flux density, Speak(Jy) 0.7±0.2 0.30±0.04 0.42±0.03 0.5±0.1
Measured fluence (Jy ms) >1.3±0.7 >0.9±0.2 >1.9±0.3 >1.8±0.5
Model-dependent properties
DMGal(pc cm−3) ∼122 ∼160 ∼38 ∼13
Max. inferred z 1.2 1.5 0.8 2.1
Max. comoving distance (Gpc) 3.9 4.3 2.7 5.5
Max. luminosity distance (Gpc) 8.6 10.6 4.8 17.2
Max. isotropic energy (1033J) 1.8±1.0 1.7±0.4 1.0±0.2 7.0±2.0
ANTARES Parkes LovellTNT SRT e-Merlin Effelsberg UTMOST GMRTATCAVLA
FRB 151206
Radio
Optical
Neutrino
ANTARES Zadko Parkes SWIFT DECam ATCA Lovell GMRT Subaru UTMOSTVLASRTFRB 151230
Radio
Optical
X-ray
Neutrino
0.01 0.10 1.00 10.00 100.00 1000.00Time post-burst (days) ANTARES Parkes SWIFT ATCA UTMOST GMRTVLA SRT
FRB 160102
Radio
X-ray
Neutrino
Figure 2. Multi-messenger follow-up campaign for FRBs 151206, 151230, 160102. The black line represents a part of the search for neutrino counterparts with ANTARES over the window [T0−1 day; T0+1 day], where T0is the event time. No high energy follow-up was performed for FRB 151206 as it was Sun-constrained. Also, due to the delayed detection of FRB 150610 the multi-messenger follow-up was restricted to an ANTARES search alone.
Table 2. The time spent by the Parkes, SRT, Effelsberg, Lovell and UTMOST radio telescopes on the field of SUPERB FRBs to search for repeating pulses. None of the observations showed repeated bursts.
FRB Parkes SRT Effelsberg Lovell UTMOST Total Tobs(hrs) Tobs(hrs) Tobs(hrs) Tobs(hrs) Tobs(hrs) (hrs)
FRB 150610 10 - - - - 10
FRB 151206 3 9.3 3 3.3 3.75 22.3 FRB 151230 36 2.9 - 8.5 7.5 54.9
FRB 160102 9.2 2 - - 4.7 15.9
searched for significant detections with SExtractor and nothing significant (> 6-sigma) was found.
FRB 151230: ATCA was triggered ∼1 day after the event and
visibilities were recorded for 8 hours. Subsequent observations were performed on 2016 January 11 and 2016 February 24 for 9.5 and 4.5 hours, respectively. We performed a variability analysis of all compact sources at 5.5 GHz and 7.5 GHz. Following the criteria described in AppendixB, we conclude that there are no significant variable sources present in the field of FRB 151230.
Observations were performed using the VLA on 2016 February 29 and 2016 March 4 and images were produced at the center frequency of 5.9 GHz with an rms of ∼15 µJy/beam. All ATCA sources were detected. None of the compact sources were found to be significantly variable.
GMRT observations were performed on 2016 January 6, 2016 February 17 and 2016 March 3. The integration times of 4 hours yielded an rms of ∼30 µJy/beam at 1.4 GHz. None of the sources showed any significant variability.
FRB 160102: ATCA observed the FRB 160102 field on 2016
January 3, 2016 January 11 and 2016 February 24. The best map yielded an rms of ∼40 µJy/beam at 5.5 GHz and ∼50 µJy/beam at 7.5 GHz. The search for sources was performed over an area of sky that is twice the region of the localisation error, i.e. a radius of
150because this FRB was detected in the outer beam of the Parkes telescope.
The final variability analysis was performed on 10 com-pact sources. Source 2238−3011 was found to vary significantly at 5.5 GHz but not at 7.5 GHz. We identify it to the quasar 2QZ J223831.1−301152 from the “Half a Million Quasar Survey” (Flesch 2015) at z = 1.6. This source is also present in the GALEX survey (Bianchi et al. 2011) (GALEX J223831.1−301152) and has a DSS (Eisenstein et al. 2011) optical counterpart. Table4and Fig-ure3(b)lists the details and light-curve of the source 2238−3011. The flux density of the source was observed to be rising at ATCA epochs at 5.5 GHz.
The VLA observations were performed on 2016 February 26 and 2016 March 4. Flux densities were derived from mosaics with the best rms being ∼10 µJy/beam. ATCA source 2238-3011 showed a low level variability with the fractional change (defined in Ap-pendixB), ∆S ∼20% (< 50%). None of the remaining sources were found to vary significantly at 5.9 GHz.
The field was also observed with the GMRT on 2016 February 6. The integration of 4 hours yielded an rms of ∼30 µJy/beam. This GMRT epoch was used to cross-check sources detected in the ATCA and VLA images and no variability analysis was performed on these data.
The results of the radio follow-up are summarised in Table3.
4.3 Follow-up at non-radio frequencies
We have carried out optical and high energy follow-up and searched for neutrino counterparts to these four SUPERB FRBs. The results are presented in this section and the details of the observations and magnitude limits are listed in AppendixC.
0.0
0.2
0.4
0.6
0.8
1.0
VLA 5.9 GHz
0
20
40
60
80
100
0.0
0.1
0.2
0.3
0.4
0.5
VLA 5.9 GHz
Time post-burst (days)
Flux density (mJy/beam)
(a)
0
20
40
60
80
100
0.0
0.2
0.4
0.6
0.8
1.0
ATCA 5.5 GHz
ATCA 7.5 GHz
VLA 5.9 GHz
Time post-burst (days)
Flux density (mJy/beam)
(b)
Figure 3. Left panel: The light-curves over 92 days of two sources in the field of FRB 151206 found to vary significantly in the VLA observations: 1921–0414 (top panel) and 1921–0412 (bottom panel). Right panel: The light curve of the significant variable source 2238–3011 in the field of FRB 160102. The fluxes and errors on fitting are derived from the task IMFIT in miriad. Note that the data have not been calibrated to the same absolute flux scale, and there may be systematic differences between different instruments. However, the data are self-consistent for variability analysis for each instrument.
Table 3. The results of the radio follow-up performed using the ATCA, VLA and GMRT on the fields of SUPERB FRBs. Ntotaldenotes the total number of sources detected above 6-sigma and Nanalysisare the number of sources used in the variability analysis. This excludes extended sources in the field of respective FRBs. Nvariabledenotes the number of significant variable sources detected in each field.
Telescope ATCA VLA GMRT
Centre freq. 5.5 GHz 7.5 GHz 5.9 GHz 1.4 GHz
Ntotal Nanalysis Nvariable Ntotal Nanalysis Nvariable Ntotal Nanalysis Nvariable Ntotal Nanalysis Nvariable
FRB 151206 1 - - 1 - - 10 10 2 13 -
-FRB 151230 9 6 0 5 2 0 25 20 0 27 18 0
FRB 160102 12 10 1 12 10 0 21 19 0 48 -
-Table 4. Radio variable sources in the field of FRB 151206 and FRB 160102. The errors in RA and DEC are in arcseconds and are presented in brackets. Columns 4 and 5 list χ2and χ2threshvalues. The χthresh2 values are upper-tail critical values of chi-square distribution with N − 1 degrees of freedom. Columns 6 and 7 list md, and ∆S values. These variability indices are defined in AppendixB.
Name RA DEC χ2 χthresh2 md ∆S
(%) (%) FRB 151206 field VLA1921-0414 19:21:27.21 (0.2) −04:14:55.67 (0.2) 478.6 24.3 21.3 63.4 VLA1921-0412 19:21:43.85 (0.2) −04:12:17.43 (0.2) 91.0 24.3 16.8 54.7 FRB 160102 field ATCA2238-3011 22:38:31.17 (0.2) −30:11:51.38 (0.6) 24.16 13.8 26.4 69.0
4.3.1 Thai National Telescope (FRB 151206)
The observations were performed with ULTRASPEC on the Thai National Telescope (TNT) on the night of 2015 December 7. Four optically variable sources were found in the field of FRB 151206. The change in magnitude ∆mag provides a measurement of the
variability of a given source in the field, such that ∆mag > 0 reflects a dimming source. The only source detected with a negative ∆mag is also bright at infrared wavelengths, with J = 9.38, H = 8.31, K= 7.93 respectively from 2MASS (Skrutskie et al. 2006). Further photometric observations of the four variable sources were obtained using the 0.5-m robotic telescope “pt5m” (Hardy et al. 2015). In all
cases, the variability seen for these sources can be explained by stel-lar variability, either eclipsing, ellipsoidal or stochastic (accretion, flaring etc).
4.3.2 Subaru Telescope (FRB 151230)
We performed follow-up imaging observations of the field of FRB 151230 in the g-, r-, i-bands on 2016 January 7, 10 and 13, with Subaru/Hyper Suprime-Cam that covers a 1.5 deg diameter field-of-view. The images taken on January 13 were used as the reference images and were subtracted from the images of January 7 and 10 using the HSC pipeline (Bosch et al. 2017). Ninty-seven variable source candidates with either positive or negative flux difference were detected in the error circle of FRB 151230 on the differential images. These candidates were examined by eye, and approximately half of them appear to be real objects while the other half are arte-facts by subtraction failure. Most of the real variable sources are likely to be either Galactic variable stars (point sources without host galaxy) or AGNs (variable sources located at centres of galax-ies). There are three objects associated with galaxies and offset from galaxy centres, which are most likely supernovae. This number is consistent with those detected outside the FRB error region con-sidering the area difference, and also consistent with a theoretically predicted number of supernovae with the depth and cadence of our observations (Niino et al. 2014). No object shows evidence for an association with the FRB, although we cannot exclude the possibil-ity that one of them is associated. The nature of the variable objects will be investigated and discussed in detail in a forthcoming paper (Tominaga et al. in prep).
4.3.3 DECam (FRB 151230)
We obtained DECam u-g-r-i dithered images centred on the coor-dinates of FRB 151230, with observations taken approximately 14 hours after the detection at Parkes. The field was also re-observed with the g filter ∼ 39 hours after the FRB detection. We searched these g-band images for transient sources (>10-sigma significance) between the two consecutive nights, within the localisation error region of 150, using Mary pipeline (Andreoni et al.,under review). We detected 5 variable sources and 4 of them were cataloged3 as small bodies, i.e. Main-belt asteroids. A fifth object was detected at a magnitude g = 22.51±0.08 on 2016 January 1, which had not been detected on the previous night, 2015 December 31 (g < 23.37 at 5-sigma confidence). This transient is located at RA=9:40:56.34, DEC=−3:27:38.29 (J2000) and is not present in the NASA/JPL small body catalog but is most likely to be an asteroid unrelated to FRB. However, it is not detected in the u-g-r-i images taken on 2015 December 31. All other transient events were rejected as bonafide transients due to poor local subtraction and bad pixels after a visual inspection of the residuals.
We have also compared the radio sources detected in the GMRT and ATCA images with the DECam images to look for optical counterparts; more details are given in AppendixC.
4.3.4 The Zadko Telescope (FRB 151230)
On 2015 December 30, the Zadko telescope was shadowing the Parkes telescope at the time of the discovery of FRB 151230. How-ever, due to technical difficulties, the first science images were taken
3
NASA/JPL SB identification system: ssd.jpl.nasa.gov
at 18:03:20.6 UTC, i.e ∼1 hour after the FRB event. Following this initial imaging, a series of 19 images of 5 tiles each were obtained during about 2 hrs through to the end of the night. Each image had an exposure time of 60 seconds in the r-band. The localisation error region (150) around FRB 151230 is completely covered by the central image of the tiles and partly contained (∼ 33%) in the peripheral images.
We analysed the individual images to search for new optical or variable sources in the field of FRB 151230. We particularly focused on the central image of the tile that fully covers the error radius around the FRB position. We found no convincing new or variable optical sources.
4.3.5 High energy follow-up (FRB 151230, FRB 160102)
We acquired follow-up observations with Swift on FRB 151230 burst on 2015 December 30 at 23:14:45 UTC, about 7 hours after the FRB for a duration of 2.05 ks. No sources were detected above a 2.5-sigma limit in the X-ray image. The data were analysed using the tools available at the Swift website (Evans et al. 2007,2009) on an observation-by-observation basis. Count rates were converted to X-ray flux assuming a GRB-like spectral index of −2.0 and Galactic HI column density estimates from the HEAsoft tool “nH”.
We acquired 3 epochs on the field of FRB 160102 with the Swift XRT of durations 3.5 ks, 3.3 ks, and 1.8 ks, respectively. No sources were detected above a 2.5-sigma limit in any of the images. We did not trigger Swift for FRB 150610 (due to the delay in its detection), nor FRB 151206 (as it was Sun constrained for 31 days after the FRB).
No Swift-BAT REALTIME triggers were issued for short du-ration gamma-ray transients during the follow-up observations for each FRB field.
4.3.6 ANTARES follow-up (all FRBs)
Multi-messenger observations with high-energy neutrino telescopes can help to constrain the FRB origin and offer a unique way to ad-dress the nature of the accelerated particles in FRBs. The ANTARES telescope (Ageron et al. 2011) is a deep-sea Cherenkov neutrino de-tector, located 40 km off Toulon, France, in the Mediterranean Sea and dedicated to the observation of neutrinos with Eν& 100 GeV. ANTARES aims primarily at the detection of neutrino-produced muons that induce Cherenkov light in the detector. Therefore, by design, ANTARES mainly observes the Southern sky (2π steradian at any time) with a high duty cycle. Searches for neutrino signals from the four detected FRBs have been performed within two dif-ferent time windows around the respective FRB trigger time, T0,
within a 2◦ radius region of interest (ROI) around the FRB posi-tion (3-sigma ANTARES point spread funcposi-tion for the online track reconstruction method). The first time window ∆T1 = [T0−500 s;
T0+500 s] is short and was defined for the case where FRBs are
associated with short transient events, e.g. short Gamma-Ray Bursts (Baret et al. 2011). A longer time window ∆T2= [T0−1 day; T0+1
day] is then used to take into account longer delays between the neutrino and the radio emission. The number of atmospheric back-ground events within the ROI is directly estimated from the data measured in the visible Southern sky using a time window ∆Tback
= [T0−12 hr; T0+12 hr]. The stability of the counting rates has been
verified by looking at the event rates detected in time slices of 2 hours within ∆Tback. Within ∆T1and ∆T2, no neutrino events were
found in correlation with FRB 150610, FRB 151206, FRB 151230 or FRB 160102.
150
120
90
60
30
0
-30
-60
-90
-120
-150
Galactic longitude
-75°
-60°
-45°
-30°
-15°
0°
15°
30°
45°
60°
75°
Galactic latitude
FRBs
SUPERB
Parkes
UTMOST
GBT
Arecibo
ASKAP
Figure 4. An Aitoff projection of the sky distribution of all published FRBs. The shaded regions show the three Galactic latitude bins in Table5. The bold black line shows the horizon limit of the Parkes radio telescope.
Table 5. Time on sky in the three latitude bins for recent surveys conducted at the Parkes telescope: the High Time Resolution Universe survey (HTRU;Keith et al. 2010), observations of rotating radio transients, FRB follow-up, the SUPERB survey, and observations of young pulsars for Fermi timing. All surveys made, or make, use of the multi-beam receiver and have equivalent field of view and sensitivity limits. The FRB sky rates for respective latitude bins are quoted with 95% confidence.
Galactic latitude HTRU HTRU RRAT FRB SUPERB Fermi Misc Total NFRBs RFRB
|b | medlat hilat search follow-up timing time time
(deg) (hrs) (hrs) (hrs) (hrs) (hrs) (hrs) (hrs) (hrs) FRBs sky−1day−1
|b | ≤ 19.5° 1157 402 483 0 700 281 0 3024 4 2.4+3.1−1.5× 10³
19.5° < |b | < 42° 0 942 28 50 1115 10 100 2245 6 4.8+4.6−2.7× 10³
42° ≤ |b | ≤ 90° 0 982 39 60 907 9 90 2088 9 7.8+5.8−3.7× 10³
5 RESULTS AND DISCUSSION
5.1 Cosmological implications of high DM FRBs
Assuming FRBs are extragalactic, the DM may be divided into contributions along the line-of-sight from the ISM in the Milky Way (DMGalaxy), the Intergalactic Medium (DMIGM), a host galaxy
(DMhost) and the circum-burst medium (DMsource):
DMFRB= DMGalaxy+ DMIGM+ DMhost+ DMsource. (3)
For all the FRBs reported here, the DMGalaxycontribution is
mi-nor (< 10% of the total observed DM). It is currently difficult to disentangle the DM contributions of the remaining DM terms for these bursts.Xu & Han(2015) showed the DMhostto peak in the
range of 30 to 300 pc cm−3 for different inclination angles of a spiral galaxy and average DMhostto be 45 pc cm−3and 37 pc cm−3
for a dwarf and an elliptical galaxy respectively. In such cases, the remaining DM is expected to arise from the IGM if the sources are cosmological in nature.
If the DM of our FRBs is indeed dominated by the IGM contri-bution, then we are potentially probing the IGM at redshifts beyond z >∼ 2. If we can find FRBs with DM >∼ 3000 pc cm−3, we could begin to probe the era in which the second helium reionisation in
the Universe occurred (Fialkov & Loeb 2016), which is important for determining the total optical depth to reionisation of the Cosmic Microwave Background (CMB), τCMB. We note that we
discov-ered FRB 160102 soon after our pipelines were modified to allow for DM searches above 2000 pc cm−3 (the current upper limit is 10,000 pc cm−3). Even in the absence of scattering being a dom-inant factor higher sensitivity instruments will likely be needed to probe such high redshifts.
5.2 FRB latitude dependence revisited
With an ever increasing sample of FRBs detected with the BPSR backend it is worthwhile to revisit the Galactic latitude dependence in FRB detectability first examined inPetroff et al.(2014). Table5
summarises the data from SUPERB, as well as several other projects using BPSR that have each observed the sky with essentially the same sensitivity to FRBs resulting in the total of 19 bursts. We consider three regions on the sky, delineated in Galactic latitude as follows: |b| ≤ 19.5°, 19.5° < |b| < 42°, and 42° ≤ |b|. The time on sky in each of these regions and the updated FRB rate at the 95% confidence level are presented in the table. Fig.4shows these FRBs on an Aitoff projection in the Galactic coordinate frame. For
0 10 20 30 40 50 60 70 80 90 Galactic latitude |b|(deg)
0.0 0.2 0.4 0.6 0.8 1.0 Cumulative probability D=0.29 SUPERB-HTRU pointings SUPERB-HTRU FRBs
Figure 5. The observed cumulative distribution of Galactic latitude |b | of FRBs detected in HTRU and SUPERB and the expected integration-time-weighted cumulative distribution of Galactic latitude |b | for isotropically distributed FRBs. A K-S test indicates that the FRB distribution does not deviate significantly from isotropy.
the studies considered here Parkes has spent ∼ 42% of the total time in the lowest Galactic latitude region (this is mostly driven by pulsar searches and/or continued monitoring studies). Despite this only 4 of the 19 bursts have been found in this range. At the highest latitudes 9 FRBs have been detected in ∼ 40% of the total time. We performed a Kolmogorov-Smirnov test (K-S) between the expected cumulative distribution of |b| for isotropically distributed FRBs based on the integration-time-weighted Galactic latitudes of the combined HTRU-SUPERB survey pointings, and the observed cumulative distribution of the 15 FRBs (see Fig5). We obtain the KS statistic D and p values of 0.29, 0.10 respectively, and conclude that departure from isotropy is not significant. Thus any disparity in the FRB rate with Galactic latitude has low significance (< 2σ) in our now larger sample of 15 FRBs. If such a disparity exists, it could be explained by diffractive scintillation boosting at high Galactic latitudes as discussed inMacquart & Johnston(2015).
5.3 FRB populations and distributions
Sources with constant space density in a Euclidean Universe yield an integral source counts, N , as a function of fluence, F , the so-called “logN-logF ”-relation, with a slope of −3/2. The relation flattens in ΛCDM cosmologies, depending on the redshift distribution of the sources being probed, and depends to some extent on the luminosity function of the sources, and observational factors like the effects that DM smearing have on the S/N of events (Caleb et al. 2016;
Vedantham et al. 2016;CHIME Scientific Collaboration et al. 2017). In Fig.6(a), we present the FRB source count distribution as a function of fluence, for FRBs found with the BPSR instrument at Parkes. The sample consists of 10 FRBs found in the HTRU survey (Thornton et al. 2013;Champion et al. 2016); Petroff et al (in prep), 5 FRBs found with SUPERB (Keane et al. 2016, FRB 150418) and this paper, and 4 FRBs found at Parkes with the same instrumentation and search technique (Ravi et al. 2015,2016;Petroff et al. 2015b,2017).
We note the following caveats about the logN-logF distribu-tion. Firstly, the fluences are lower limits, as most of the FRBs are poorly localised within the Parkes beam pattern. Secondly, all FRB surveys are incomplete below some fluence, due to the effects of DM smearing, scattering and the underlying width distribution of the events (see §5.4and Fig.7). Although both these affect the shape
of logN-logF , simulations performed byCaleb et al.(2016) show that the slope of the relation is mainly set by cosmological effects. They found α = −0.9 ± 0.3 for the 9 HTRU FRBs.
We measure a slope of the integral source counts using the maximum likelihood method (Crawford et al. 1970) and obtain α = − 2.2+0.6
−1.2for FRBs above a fluence limit of 2 Jy ms as shown
in Fig6(b). This is consistent with the source count slope for Parkes FRBs found byMacquart & Ekers(2017), who find α = −2.6+0.7−1.3 The large uncertainty in α is due to the small sample size. Similarly toMacquart & Ekers (2017), we are unable to rule out that the source counts are not Euclidean (α = −3/2).
5.4 Parkes sky rates
With the increased number of FRBs we update the all-sky rate estimates for Parkes. The all-sky lower limit on the rate is 4.7+2.1−1.7× 10³ FRBs/(4π sr)/day. This is based on the observed rate of 19 events in 306 days of observing with BPSR, assuming the events occur within the full-width-half-power field-of-view of the receiver, and extrapolating this to the entire sky. The quoted uncertainties are 95% Poisson uncertainties (Gehrels 1986). Additionally we update the fluence complete rate, which is a more useful quantity when scaling FRB rates to other telescopes and/or frequencies. Figure7
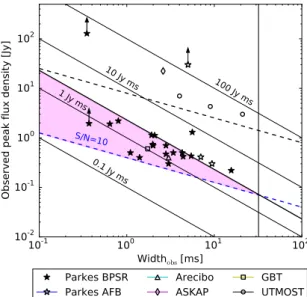
shows the observed peak flux density and observed widths of the FRB population, with Parkes sensitivity and completeness regions highlighted. FollowingKeane & Petroff (2015) and considering those FRBs in the fluence complete region we estimate a rate above ∼ 2 Jy ms of 1.7+1.5−0.9× 10³FRBs/(4π sr)/day.
5.5 Variable and transient source densities in the field of FRBs
We essentially performed a targeted survey to search for significantly variable and transient radio sources in the three of our FRB fields. We covered ∼0.15 deg2of sky for all fields with VLA at a sensitivity of ∼100 µJy and ∼0.3 deg2 of sky for all fields with ATCA at a sensitivity of ∼300 µJy from 4 GHz to 8 GHz. We detected two sources in the VLA images of the field of FRB 151206 and one source in the ATCA images of the field of FRB 160102 to vary significantly.
However, no radio transients were detected. The significant variable source surface density for our survey is ρv= 10+9.7−5.4deg−2
(1-sigma Poisson error). The Poisson uncertainties are calculated followingGehrels(1986). The upper limits on the transient source density for zero detections at 95% confidence is given by ρt< 0.56
deg−2above the flux limit of 100 µJy. (Fig8(b)).
Bell et al.(2015) performed a search for variable sources in ∼0.3 deg2 with comparable flux limits and at similar frequencies
as our search. They reported ρv= 3.3+7.5−2.7deg−2(1-sigma Poisson
error) for significant variable sources. We also compared our ρv
withBecker et al. (2010) and Mooley et al.(2016). The results are presented in Fig8(a). The flux density limit (Smin) and ρvfor Mooley et al.(2016) were scaled to 5.5 GHz from 3 GHz using the relation Smin ∝να and ρv ∝ Smin−1.5where ν is the frequency
and α is the spectral index (which is assumed to be −0.7). We find that the surface density of significant variable sources is consistent within the uncertainty estimates with surveys done in the past in non-FRB fields. Consequently, we find no strong evidence that the FRBs reported here are associated with the highly variable sources in the fields, subject to the caveats that somewhat different variability
(a)
0 1 2 3 4 5
Minimum Fluence [Jy ms] 5 4 3 2 1 0 (b)
Figure 6. Left panel: The source count distribution of Parkes FRBs. The sky rate is indicated on the right, normalised to rate of 1.7 × 10³
FRBs sky−1day−1 for F > 2 Jy ms (see §5.4). Right panel: The slope α of the integral source counts obtained using the maximum likelihood method (Crawford et al. 1970). We obtain a slope of α = −2.2+0.6−1.2for FRBs above a fluence completeness limit of 2 Jy ms in our updated sample of 19 FRBs. The vertical dashed line indicates the fluence completeness limit and the horizontal dashed line indicates α = −3/2, the slope expected for constant space density sources distributed in a Euclidean Universe.
10
-110
010
110
2Width
obs[ms]
10
-210
-110
010
110
2Observed peak flux density [Jy]
0.1 Jy ms 1 Jy ms 10 Jy ms 100 Jy ms S/N=10
Parkes BPSR
Parkes AFB
Arecibo
ASKAP
GBT
UTMOST
Figure 7. The observed peak flux density and observed width for all known FRBs. The sensitivity limits and fluence completeness region for BPSR Parkes events are indicated. These do not apply to other events which are shown for reference only.
search criteria, different frequencies and different sensitivity limits were used in the comparison surveys.
The probability of detecting N variable sources in an area A is given by:
P(N)= ∫ ∞
0
P(N |σ)P(σ)dσ (4)
where, σ is the variable source density, P(σ) is the prior proba-bility for that variable, normalised such that
∫∞
0 P(σ)dσ = 1. We
calculate the prior probability usingBell et al.(2015) as our control
survey, which is given by:
P(σ) = CσN0e−σ A0 (5)
where C is the normalisation constant, N0and A0are the number of
highly variable source and the area covered in the control survey. We use results from our VLA observations of FRB fields to compare with the control survey because of their comparable sensitivities and found that the probability of detecting two highly variable sources in a ∼0.15 deg2area of sky is 14.8%. Currently with the available data, we lack sufficient information to conclusively associate any of these variable sources with FRB 151206 or FRB 160102. However, the detection of a known variable quasar in the field of FRB 160102, the presence of variable AGN in the field of FRB 150418 (Johnston et al. 2017), FRB 131104 (Shannon & Ravi 2016) and the persistent variable radio source in the field of FRB 121102 (Chatterjee et al. 2017) hint that FRBs might be related to AGN activity in the host galaxy, however in the absence of a large FRB population and their localisation, this remains speculative.
6 SUMMARY AND CONCLUSIONS
We report the discoveries of four new FRBs in the SUPERB survey being conducted with the Parkes radio telescope: FRB 150610, 151206, 151230 and 160201. We have performed multi-messenger follow-up of these using 2, 11, 12 and 8 telescopes respectively. No repeating radio pulses were detected in 103.1 hrs of radio follow-up. We continue to follow all SUPERB and bright HTRU FRBs in our ongoing SUPERB observations.
A comparison of the repeating FRB with the published non-repeating FRBs has been performed by Palaniswamy & Zhang
(2017), who present evidence that there are two distinct populations of FRBs – repeating and non-repeating – based on the distribu-tion of pulse fluences and the amount of followup time for each
10
310
210
110
010
110
25.0
2.5
0.0
2.5
5.0
7.5
10.0
12.5
15.0
Bell+15
This work
Be+10
Mo+16
Flux density limit (mJy)
v
(d
eg
2)
(a)10
210
110
010
110
210
310
610
510
410
310
210
110
010
110
2 Cr+13 Bo+10 Mo+16 CNSS VLSS All Sky Cr+11 Fr+94 Mo+13 Th+11 Ca+03 Of+11 Bo+07 Bell+15 This work1.4 GHz
3.0 GHz
4.9 GHz
5.5 GHz
Flux density limit (mJy)
t
(d
eg
2
)
(b)
Figure 8. Left panel: The density of significantly variable radio sources as a function of flux density in surveys made at ∼5 GHz and 3 GHz byBell et al.(2015), this work,Becker et al.(2010) andMooley et al.(2016). The density of significantly variable sources is consistent within a 1-sigma Poisson error for surveys done in the past. Right panel: The density of transient radio sources in surveys conducted at 1.4 GHz (Carilli et al. 2003;Mooley et al. 2013;Thyagarajan et al. 2011;Frail et al. 1994;Croft et al. 2011), 3 GHz (Bower et al. 2010;Croft et al. 2013;Mooley et al. 2016, CNSS pilot, CNSS, VLSS), 4.9 GHz (Bower et al. 2007;Ofek et al. 2011), and 5.5 GHz (This work,Bell et al.(2015)) as a function of flux density. The dashed blue line shows ρt∝ S−3/2. This is the relation for a Euclidean population.
Table 6. Comparison of the properties of the FRBs detected in SUPERB and the repeating FRB 121102. SUPERB FRBs are unresolved in time and show scattering unlike the repeater.
Property FRB 121102 SUPERB FRBs ∼100 MHz spectral features Yes 1 of 5 sources
time resolved Yes No
range of spectral index −15 to +10 ∼0
scattering No Yes
width 3 − 9 ms < 0.8 − 4 ms
source. The FRBs reported here differ from FRB121102 (the re-peating FRB) in a number of ways, as shown in Table6. The pulses from the repeater are time resolved and their pulse widths vary from 3−9 ms whereas the SUPERB FRBs are unresolved (in time): the width is instead dominated by the effects of DM smearing and scat-tering. This appears to provide further support for the two source population conclusion ofPalaniswamy & Zhang(2017).
With our larger sample of FRBs detected at Parkes, we have revisited the FRB event rate and derived an updated all sky FRB rate of 1.7+1.5−0.9× 10³ FRBs/(4π sr)/day above a fluence of ∼ 2 Jy ms. We have also computed the volumetric rate of FRBs for the 19 FRB sample using the fluence complete rate as our basis. We get volumetric rates in the range 2000 to 7000 Gpc−3 yr−1 out to a redshift of z ∼ 1. This is consistent with volumetric rates for a range of transients (e.g. low luminosity long GRBs, short GRBs, NS-NS mergers, and supernovae (CC, Type Ia, etc)) (Kulkarni et al. 2014;Totani 2013).
Our follow-up campaign of the reported FRBs yielded no multi-wavelength or multi-messenger counterparts and we have placed upper limits on their detection. We have also concluded that variability in the optical/radio images alone does not provide a reliable association with the FRBs. We encourage wide-field and simultaneous multi-wavelength observations of FRBs. In future, the
detection of FRBs with an interferometer would be able to provide a robust host galaxy association.
ACKNOWLEDGEMENTS
The Parkes radio telescope and the Australia Telescope Compact Array are part of the Australia Telescope National Facility which is funded by the Commonwealth of Australia for operation as a National Facility managed by CSIRO. Parts of this research were conducted by the Australian Research Council Centre of Excel-lence for All-sky Astrophysics (CAASTRO), through project num-ber CE110001020. The GMRT is run by the National Centre for Radio Astrophysics of the Tata Institute of Fundamental Research. VLA is run by the National Radio Astronomy Observatory (NRAO). NRAO is a facility of the National Science Foundation operated un-der cooperative agreement by Associated Universities, Inc. This work was performed on the gSTAR national facility at Swinburne University of Technology. gSTAR is funded by Swinburne and the Australian Government’s Education Investment Fund. This work is also based on data collected at Subaru Telescope, which is operated by the National Astronomical Observatory of Japan. We thank the LSST Project for making their code available as free software at http://dm.lsstcorp.org. Funding from the European Research Coun-cil under the European Union’s Seventh Framework Programme (FP/2007-2013) / ERC Grant Agreement n. 617199 (EP). Access to the Lovell Telescope is supported through an STFC consolidated grant. The 100-m telescope in Effelsberg is operation by the Max-Planck-Institut für Radioastronomie with funds of the Max-Planck Society. The Sardinia Radio Telescope (SRT) is funded by the De-partment of University and Research (MIUR), the Italian Space Agency (ASI), and the Autonomous Region of Sardinia (RAS) and is operated as National Facility by the National Institute for Astrophysics (INAF). TB and RWW are grateful to the STFC for financial support (grant reference ST/P000541/1). Research support to IA is provided by the Australian Astronomical Observatory. The
ANTARES authors acknowledge the financial support of the fund-ing agencies: Centre National de la Recherche Scientifique (CNRS), Commissariat à l’énergie atomique et aux énergies alternatives (CEA), Commission Européenne (FEDER fund and Marie Curie Program), Institut Universitaire de France (IUF), IdEx program and UnivEarthS Labex program at Sorbonne Paris Cité 10-LABX-0023 and ANR-11-IDEX-0005-02), Labex OCEVU (ANR-11-LABX-0060) and the A*MIDEX project (ANR-11-IDEX-0001-02), Région Île-de-France (DIM-ACAV), Région Alsace (contrat CPER), Région Provence-Alpes-Côte d’Azur, Département du Var and Ville de La Seyne-sur-Mer, France; Bundesministerium für Bil-dung und Forschung (BMBF), Germany; Istituto Nazionale di Fisica Nucleare (INFN), Italy; Stichting voor Fundamenteel Onderzoek der Materie (FOM), Nederlandse organisatie voor Wetenschappelijk Onderzoek (NWO), the Netherlands; Council of the President of the Russian Federation for young scientists and leading scientific schools supporting grants, Russia; National Authority for Scientific Research (ANCS), Romania; Ministerio de Economía y Competi-tividad (MINECO): Plan Estatal de Investigación (refs. FPA2015-65150-C3-1-P, -2-P and -3-P, (MINECO/FEDER)), Severo Ochoa Centre of Excellence and MultiDark Consolider (MINECO), and Prometeo and Grisolía programs (Generalitat Valenciana), Spain; Ministry of Higher Education, Scientific Research and Professional Training, Morocco. We also acknowledge the technical support of Ifremer, AIM and Foselev Marine for the sea operation and the CC-IN2P3 for the computing facilities. This work made use of data supplied by the UK Swift Science Data Centre at the University of Leicester. This research has made use of data, software and/or web tools obtained from the High Energy Astrophysics Science Archive Research Center (HEASARC), a service of the Astrophysics Science Division at NASA/GSFC and of the Smithsonian Astrophysical Ob-servatory’s High Energy Astrophysics Division. This work is based in part on data collected at Subaru Telescope, which is operated by the National Astronomical Observatory of Japan. This paper makes use of software developed for the Large Synoptic Survey Telescope. We thank the LSST Project for making their code avail-able as free software at http://dm.lsstcorp.org. RPE/MK gratefully acknowledges support from ERC Synergy Grant "BlackHoleCam" Grant Agreement Number 610058
SB would like to thank Tara Murphy, Martin Bell, Paul Han-cock, Keith Bannister, Chris Blake and Bing Zhang for useful dis-cussions.
REFERENCES
Adrian-Martínez S., et al., 2016, preprint, (arXiv:1608.08840) Ageron M., et al., 2011,Nuclear Instruments and Methods in Physics
Re-search A,656, 11
Alard C., 2000,A&AS,144, 363
Alard C., Lupton R. H., 1998,ApJ,503, 325
Ananthakrishnan S., 1995, Journal of Astrophysics and Astronomy Supple-ment,16, 427
Axelrod T., Kantor J., Lupton R. H., Pierfederici F., 2010, in Software and Cyberinfrastructure for Astronomy. p. 774015,doi:10.1117/12.857297
Bailes M., et al., 2017, preprint, (arXiv:1708.09619) Bannister K., et al., 2017, preprint, (arXiv:1705.07581) Baret B., et al., 2011,Astroparticle Physics,35, 1
Becker R. H., Helfand D. J., White R. L., Proctor D. D., 2010, The Astro-nomical Journal, 140, 157
Bell M. E., Huynh M. T., Hancock P., Murphy T., Gaensler B. M., Burlon D., Trott C., Bannister K., 2015,MNRAS,450, 4221
Bianchi L., Herald J., Efremova B., Girardi L., Zabot A., Marigo P., Conti A., Shiao B., 2011,Ap&SS,335, 161
Bolli P., et al., 2015,Journal of Astronomical Instrumentation,4, 1550008
Bosch J., et al., 2017, preprint, (arXiv:1705.06766)
Bower G. C., Saul D., Bloom J. S., Bolatto A., Filippenko A. V., Foley R. J., Perley D., 2007,ApJ,666, 346
Bower G. C., et al., 2010,ApJ,725, 1792
Burke-Spolaor S., Bannister K. W., 2014,ApJ,792, 19
CHIME Scientific Collaboration et al., 2017, preprint, (arXiv:1702.08040)
Caleb M., Flynn C., Bailes M., Barr E. D., Hunstead R. W., Keane E. F., Ravi V., van Straten W., 2016,MNRAS,458, 708
Caleb M., et al., 2017, preprint, (arXiv:1703.10173) Carilli C. L., Ivison R. J., Frail D. A., 2003,ApJ,590, 192
Chambers K. C., et al., 2016, preprint, (arXiv:1612.05560) Champion D. J., et al., 2016,MNRAS,460, L30
Chatterjee S., et al., 2017,Nature,541, 58
Connor L., Sievers J., Pen U.-L., 2016,MNRAS,458, L19
Cordes J. M., Lazio T. J. W., 2002, ArXiv Astrophysics e-prints,
Cordes J., Wasserman I., 2016, Monthly Notices of the Royal Astronomical Society, 457, 232
Coward D. M., et al., 2017,Publ. Astron. Soc. Australia,34, e005
Crawford D. F., Jauncey D. L., Murdoch H. S., 1970,ApJ,162, 405
Croft S., Bower G. C., Keating G., Law C., Whysong D., Williams P. K. G., Wright M., 2011,ApJ,731, 34
Croft S., Bower G. C., Whysong D., 2013,ApJ,762, 93
Dhillon V. S., et al., 2014,MNRAS,444, 4009
Diehl H. T., Dark Energy Survey Collaboration 2012, in American Astro-nomical Society Meeting Abstracts #219. p. #413.05
Eisenstein D. J., et al., 2011,AJ,142, 72
Evans P. A., et al., 2007,A&A,469, 379
Evans P. A., et al., 2009,MNRAS,397, 1177
Falcke H., Rezzolla L., 2014,A&A,562, A137
Fialkov A., Loeb A., 2016,J. Cosmology Astropart. Phys.,5, 004
Flaugher B. L., et al., 2012, in Society of Photo-Optical Instrumentation Engineers (SPIE) Conference Series. p. 11,doi:10.1117/12.926216
Flesch E. W., 2015,Publ. Astron. Soc. Australia,32, e010
Frail D. A., et al., 1994,ApJ,437, L43
Garrington S. T., et al., 2004, in Oschmann Jr. J. M., ed., Proc. SPIEVol. 5489, Ground-based Telescopes. pp 332–343,doi:10.1117/12.553235
Gehrels N., 1986,ApJ,303, 336
Hachenberg O., Grahl B.-H., Wielebinski R., 1973, IEEE Proceedings,61, 1288
Hancock P. J., Murphy T., Gaensler B. M., Hopkins A., Curran J. R., 2012,
MNRAS,422, 1812
Hardy L. K., Butterley T., Dhillon V. S., Littlefair S. P., Wilson R. W., 2015,
MNRAS,454, 4316
Högbom J. A., 1974, A&AS,15, 417
Hogg D. W., 2000, arXiv preprint astro-ph/9905116, 184
Huynh M. T., Jackson C. A., Norris R. P., Prandoni I., 2005,AJ,130, 1373
Inoue A. K., Shimizu I., Iwata I., Tanaka M., 2014,MNRAS,442, 1805
Ioka K., 2003,ApJL,598, L79
Ivezić Ž., et al., 2008, in Bailer-Jones C. A. L., ed., American In-stitute of Physics Conference Series Vol. 1082, American Insti-tute of Physics Conference Series. pp 359–365 (arXiv:0810.5155),
doi:10.1063/1.3059076
Johnston S., et al., 2017,MNRAS,465, 2143
Jurić M., et al., 2015, preprint, (arXiv:1512.07914) Keane E. F., Petroff E., 2015,MNRAS,447, 2852
Keane E. F., Stappers B. W., Kramer M., Lyne A. G., 2012,MNRAS,425, L71
Keane E., et al., 2016, Nature, 530, 453
Keane E. F., et al., 2017, preprint, (arXiv:1706.04459) Keith M. J., et al., 2010,MNRAS,409, 619
Kulkarni S. R., Ofek E. O., Neill J. D., Zheng Z., Juric M., 2014, preprint, (arXiv:1402.4766)
Lorimer D. R., Bailes M., McLaughlin M. A., Narkevic D. J., Crawford F., 2007,Science,318, 777
Lovell B., 1985, The Jodrell Bank telescopes Lyutikov M., Lorimer D. R., 2016,ApJ,824, L18
Macquart J.-P., Ekers R., 2017, preprint, (arXiv:1710.11493) Macquart J.-P., Johnston S., 2015,MNRAS,451, 3278
Masui K., et al., 2015, preprint, (arXiv:1512.00529)
McMullin J. P., Waters B., Schiebel D., Young W., Golap K., 2007, in Shaw R. A., Hill F., Bell D. J., eds, Astronomical Society of the Pacific Conference Series Vol. 376, Astronomical Data Analysis Software and Systems XVI. p. 127
Mooley K. P., Frail D. A., Ofek E. O., Miller N. A., Kulkarni S. R., Horesh A., 2013,ApJ,768, 165
Mooley K., et al., 2016, arXiv preprint arXiv:1601.01693 Niino Y., Totani T., Okumura J. E., 2014,PASJ,66, L9
Ofek E., Frail D., Breslauer B., Kulkarni S., Chandra P., Gal-Yam A., Kasli-wal M., Gehrels N., 2011, The Astrophysical Journal, 740, 65 Palaniswamy D., Zhang B., 2017, preprint, (arXiv:1703.09232) Pen U.-L., Connor L., 2015,ApJ,807, 179
Petroff E., et al., 2014,ApJL,789, L26
Petroff E., et al., 2015a,MNRAS,447, 246
Petroff E., et al., 2015b,MNRAS,447, 246
Petroff E., et al., 2015c,MNRAS,451, 3933
Petroff E., et al., 2016, preprint, (arXiv:1601.03547)
Petroff E., SUPERB Collaboration HESS Collaboration ANTARES Collab-oration 2017, in American Astronomical Society Meeting Abstracts. p. 330.05
Piro A. L., 2016,ApJ,824, L32
Ransom S. M., Eikenberry S. S., Middleditch J., 2002,AJ,124, 1788
Ravi V., Shannon R. M., Jameson A., 2015,ApJ,799, L5
Ravi V., et al., 2016,Science,354, 1249
Sault R. J., Teuben P. J., Wright M. C. H., 1995, in Shaw R. A., Payne H. E., Hayes J. J. E., eds, Astronomical Society of the Pacific Conference Series Vol. 77, Astronomical Data Analysis Software and Systems IV. p. 433 (arXiv:astro-ph/0612759)
Shannon R. M., Ravi V., 2016, preprint, (arXiv:1611.05580) Skrutskie M. F., et al., 2006,AJ,131, 1163
Spitler L. G., et al., 2014,ApJ,790, 101
Spitler L., et al., 2016, Nature, 531, 202 Tendulkar S. P., et al., 2017,ApJ,834, L7
Thornton D., et al., 2013,Science,341, 53
Thyagarajan N., Helfand D. J., White R. L., Becker R. H., 2011,ApJ,742, 49
Totani T., 2013,PASJ,65, L12
Vedantham H. K., Ravi V., Hallinan G., Shannon R. M., 2016,ApJ,830, 75
Wells D. C., 1985, in di Gesu V., Scarsi L., Crane P., Friedman J. H., Levialdi S., eds, Data Analysis in Astronomy. p. 195
Wilson W. E., et al., 2011,MNRAS,416, 832
Wright E. L., 2006,PASP,118, 1711
Xu J., Han J. L., 2015,Research in Astronomy and Astrophysics,15, 1629
Yao J. M., Manchester R. N., Wang N., 2017,ApJ,835, 29
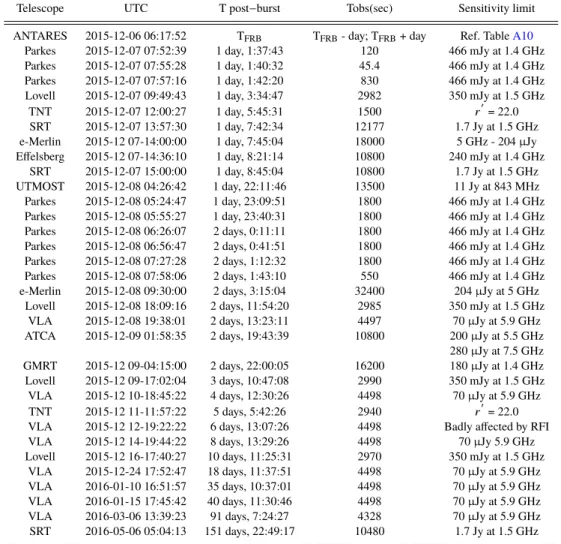
Telescope UTC T post−burst Tobs(sec) Sensitivity limit ANTARES 2015-06-10 05:26:58 TFRB TFRB- day; TFRB+ day Ref. TableA10 Parkes 2017-06-08 03:22:10 728 days, 21:55:12 7200 466 mJy at 1.4 GHz Parkes 2017-06-08 05:26:02 728 days, 23:59:04 7200 466 mJy at 1.4 GHz Parkes 2017-06-08 07:38:43 729 days, 2:11:45 7200 466 mJy at 1.4 GHz Parkes 2017-06-08 09:43:47 729 days, 4:16:49 7200 466 mJy at 1.4 GHz Parkes 2017-06-08 11:48:30 729 days, 6:21:32 7200 466 mJy at 1.4 GHz
Table A1. Multi-wavelength follow-up of FRB 150610 at ANTARES and Parkes. The sensitivity limits are specified for 10-sigma events with a width of 1ms at Parkes.
Telescope UTC T post−burst Tobs(sec) Sensitivity limit
ANTARES 2015-12-06 06:17:52 TFRB TFRB- day; TFRB+ day Ref. TableA10 Parkes 2015-12-07 07:52:39 1 day, 1:37:43 120 466 mJy at 1.4 GHz Parkes 2015-12-07 07:55:28 1 day, 1:40:32 45.4 466 mJy at 1.4 GHz Parkes 2015-12-07 07:57:16 1 day, 1:42:20 830 466 mJy at 1.4 GHz Lovell 2015-12-07 09:49:43 1 day, 3:34:47 2982 350 mJy at 1.5 GHz
TNT 2015-12-07 12:00:27 1 day, 5:45:31 1500 r
0
= 22.0 SRT 2015-12-07 13:57:30 1 day, 7:42:34 12177 1.7 Jy at 1.5 GHz e-Merlin 2015-12 07-14:00:00 1 day, 7:45:04 18000 5 GHz - 204 µJy Effelsberg 2015-12 07-14:36:10 1 day, 8:21:14 10800 240 mJy at 1.4 GHz
SRT 2015-12-07 15:00:00 1 day, 8:45:04 10800 1.7 Jy at 1.5 GHz UTMOST 2015-12-08 04:26:42 1 day, 22:11:46 13500 11 Jy at 843 MHz Parkes 2015-12-08 05:24:47 1 day, 23:09:51 1800 466 mJy at 1.4 GHz Parkes 2015-12-08 05:55:27 1 day, 23:40:31 1800 466 mJy at 1.4 GHz Parkes 2015-12-08 06:26:07 2 days, 0:11:11 1800 466 mJy at 1.4 GHz Parkes 2015-12-08 06:56:47 2 days, 0:41:51 1800 466 mJy at 1.4 GHz Parkes 2015-12-08 07:27:28 2 days, 1:12:32 1800 466 mJy at 1.4 GHz Parkes 2015-12-08 07:58:06 2 days, 1:43:10 550 466 mJy at 1.4 GHz e-Merlin 2015-12-08 09:30:00 2 days, 3:15:04 32400 204 µJy at 5 GHz
Lovell 2015-12-08 18:09:16 2 days, 11:54:20 2985 350 mJy at 1.5 GHz VLA 2015-12-08 19:38:01 2 days, 13:23:11 4497 70 µJy at 5.9 GHz ATCA 2015-12-09 01:58:35 2 days, 19:43:39 10800 200 µJy at 5.5 GHz
280 µJy at 7.5 GHz GMRT 2015-12 09-04:15:00 2 days, 22:00:05 16200 180 µJy at 1.4 GHz Lovell 2015-12 09-17:02:04 3 days, 10:47:08 2990 350 mJy at 1.5 GHz VLA 2015-12 10-18:45:22 4 days, 12:30:26 4498 70 µJy at 5.9 GHz
TNT 2015-12 11-11:57:22 5 days, 5:42:26 2940 r
0
= 22.0 VLA 2015-12 12-19:22:22 6 days, 13:07:26 4498 Badly affected by RFI VLA 2015-12 14-19:44:22 8 days, 13:29:26 4498 70 µJy 5.9 GHz Lovell 2015-12 16-17:40:27 10 days, 11:25:31 2970 350 mJy at 1.5 GHz
VLA 2015-12-24 17:52:47 18 days, 11:37:51 4498 70 µJy at 5.9 GHz VLA 2016-01-10 16:51:57 35 days, 10:37:01 4498 70 µJy at 5.9 GHz VLA 2016-01-15 17:45:42 40 days, 11:30:46 4498 70 µJy at 5.9 GHz VLA 2016-03-06 13:39:23 91 days, 7:24:27 4328 70 µJy at 5.9 GHz SRT 2016-05-06 05:04:13 151 days, 22:49:17 10480 1.7 Jy at 1.5 GHz
Table A2. Multi-wavelength follow-up of FRB 151206 at 11 telescopes. The sensitivity limits are specified for 10-sigma events with a width of 1ms at Parkes, SRT, Lovell, Effelsberg and UTMOST.
APPENDICES
A FRB follow-up summary
Telescope UTC T post−burst Tobs(sec) Sensitivity limit ANTARES 2015-12-30 17:03:26 TFRB TFRB- day; TFRB+ day Ref. TableA10
Zadko 2015-12-30 18:03:21 00:59:55 7457 r < 19.8 Parkes 2015-12-30 18:03:30 01:00:04 3616.01 466 mJy at 1.4 GHz Parkes 2015-12-30 19:32:28 02:29:02 3618.11 466 mJy at 1.4 GHz SWIFT 2015-12-30 23:14:45 06:11:19 2056.5 1.918 × 10¹³erg−1cm2s−1 DECam 2015-12-31 07:11:17 14:07:51 900 u < 21.5 DECam 2015-12-31 07:28:42 14:25:16 375 g < 22.5 DECam 2015-12-31 07:37:22 14:33:56 200 r < 23.8 DECam 2015-12-31 07:43:06 14:39:40 750 i < 24.1 ATCA 2015-12-31 14:15:45 21:12:19 28800 288 µJy at 5.5 GHz 348 µJy at 7.5 GHz Lovell 2016-01-01 00:44:43 1 day, 7:41:17 7200 350 mJy at 1.5 GHz
DECam 2016-01-01 07:44:44 1 day, 14:41:18 200 g < 22.6
Parkes 2016-01-01 13:42:56 1 day, 20:39:30 3619.95 466 mJy at 1.4 GHz Parkes 2016-01-01 14:43:39 1 day, 21:40:13 3617.06 466 mJy at 1.4 GHz Parkes 2016-01-01 15:44:19 1 day, 22:40:53 3617.06 466 mJy at 1.4 GHz Parkes 2016-01-01 16:45:09 1 day, 23:41:43 3617.06 466 mJy at 1.4 GHz Parkes 2016-01-01 17:45:49 2 days, 0:42:23 3617.06 466 mJy at 1.4 GHz Parkes 2016-01-01 18:46:28 2 days, 1:43:02 3618.11 466 mJy at 1.4 GHz Parkes 2016-01-01 19:47:09 2 days, 2:43:43 3617.06 466 mJy at 1.4 GHz Parkes 2016-01-02 14:20:00 2 days, 21:16:34 3616.01 466 mJy at 1.4 GHz Parkes 2016-01-02 15:20:38 2 days, 22:17:12 3618.11 466 mJy at 1.4 GHz Parkes 2016-01-02 16:21:18 2 days, 23:17:52 3618.11 466 mJy at 1.4 GHz Parkes 2016-01-02 17:22:10 3 days, 0:18:44 3616.01 466 mJy at 1.4 GHz Parkes 2016-01-02 18:22:47 3 days, 1:19:21 3618.9 466 mJy at 1.4 GHz Parkes 2016-01-02 19:23:28 3 days, 2:20:02 3618.11 466 mJy at 1.4 GHz Parkes 2016-01-03 13:32:51 3 days, 20:29:25 3624.93 466 mJy at 1.4 GHz Parkes 2016-01-03 14:33:38 3 days, 21:30:12 3618.11 466 mJy at 1.4 GHz Parkes 2016-01-03 15:34:19 3 days, 22:30:53 3617.06 466 mJy at 1.4 GHz Parkes 2016-01-03 16:35:09 3 days, 23:31:43 3617.06 466 mJy at 1.4 GHz Parkes 2016-01-03 17:35:48 4 days, 0:32:22 3618.11 466 mJy at 1.4 GHz Lovell 2016-01-03 22:41:31 4 days, 5:38:05 5580 350 mJy at 1.5 GHz Lovell 2016-01-04 00:16:07 4 days, 7:12:41 1596 350 mJy at 1.5 GHz Parkes 2016-01-04 14:54:30 4 days, 21:51:04 3616.01 466 mJy at 1.4 GHz Parkes 2016-01-04 15:55:10 4 days, 22:51:44 3616.01 466 mJy at 1.4 GHz Parkes 2016-01-04 16:56:00 4 days, 23:52:34 3616.01 466 mJy at 1.4 GHz Parkes 2016-01-04 17:58:08 5 days, 0:54:42 3618.11 466 mJy at 1.4 GHz Parkes 2016-01-04 18:58:49 5 days, 1:55:23 1258.03 466 mJy at 1.4 GHz Parkes 2016-01-04 19:20:18 5 days, 2:16:52 3618.11 466 mJy at 1.4 GHz Parkes 2016-01-05 14:40:00 5 days, 21:36:34 3616.01 466 mJy at 1.4 GHz Parkes 2016-01-05 15:40:39 5 days, 22:37:13 3617.06 466 mJy at 1.4 GHz Parkes 2016-01-05 16:41:42 5 days, 23:38:16 3623.88 466 mJy at 1.4 GHz Parkes 2016-01-05 17:43:03 6 days, 0:39:37 3623.09 466 mJy at 1.4 GHz Parkes 2016-01-05 18:52:06 6 days, 1:48:40 3619.95 466 mJy at 1.4 GHz Parkes 2016-01-06 14:41:36 6 days, 21:38:10 3619.95 466 mJy at 1.4 GHz Parkes 2016-01-06 15:42:16 6 days, 22:38:50 3619.95 466 mJy at 1.4 GHz Parkes 2016-01-06 16:43:10 6 days, 23:39:44 3616.01 466 mJy at 1.4 GHz Parkes 2016-01-06 17:43:47 7 days, 0:40:21 3618.9 466 mJy at 1.4 GHz Parkes 2016-01-06 18:48:33 7 days, 1:45:07 3623.09 466 mJy at 1.4 GHz GMRT 2016-01-06 18:30:00 7 days, 1:26:34 15588 180 µJy at 1.4 GHz Parkes 2016-01-06 19:53:13 7 days, 2:49:47 1900.28 466 mJy at 1.4 GHz Subaru 2016-01-07 11:23:19 7 days, 18:19:53 4200 Refer tableA7
Subaru 2016-01-07 13:17:22 7 days, 20:13:56 3150 Refer tableA7
Subaru 2016-01-07 15:12:39 7 days, 22:09:13 4200 Refer tableA7
Subaru 2016-01-10 11:11:39 10 days, 18:08:13 3600 Refer tableA7
Subaru 2016-01-10 13:03:29 10 days, 20:00:03 3600 Refer tableA7
Subaru 2016-01-10 15:07:20 10 days, 22:03:54 4080 Refer tableA7
ATCA 2016-01-11 11:36:55 11 days, 18:33:29 34440 288 µJy at 5.5 GHz 390 µJy at 7.5 GHz

![Figure 2. Multi-messenger follow-up campaign for FRBs 151206, 151230, 160102. The black line represents a part of the search for neutrino counterparts with ANTARES over the window [T 0 − 1 day; T 0 +1 day], where T 0 is the event time](https://thumb-eu.123doks.com/thumbv2/123doknet/14099217.465399/5.892.76.804.156.530/figure-multi-messenger-campaign-represents-neutrino-counterparts-antares.webp)