Development of a Multi-Step Synthesis and
Workup Sequence for an Integrated, Continuous
Manufacturing Process of a Pharmaceutical
The MIT Faculty has made this article openly available. Please share how this access benefits you. Your story matters.Citation Heider, Patrick L., Stephen C. Born, Soubir Basak, Brahim Benyahia, Richard Lakerveld, Haitao Zhang, Rachael Hogan, et al. “Development of a Multi-Step Synthesis and Workup
Sequence for an Integrated, Continuous Manufacturing Process of a Pharmaceutical.” Org. Process Res. Dev. 18, no. 3 (March 21, 2014): 402–409.
As Published http://dx.doi.org/10.1021/op400294z
Publisher American Chemical Society (ACS)
Version Author's final manuscript
Citable link http://hdl.handle.net/1721.1/92771
Terms of Use Creative Commons Attribution-Noncommercial-Share Alike
Development of a Multi-Step Synthesis and Workup
Sequence for an Integrated, Continuous
Manufacturing Process of a Pharmaceutical
Patrick L. Heider,† Stephen C. Born,† Soubir Basak,† Brahim Benyahia,† Richard Lakerveld,†
Haitao Zhang,† Rachael Hogan,† Louis Buchbinder,† Aaron Wolfe,† Salvatore Mascia,† James
M. B. Evans,† Timothy F. Jamison,‡ and Klavs F. Jensen,†,* †Department of Chemical Engineering
‡Department of Chemistry
Massachusetts Institute of Technology 77 Massachusetts Avenue Cambridge, MA 02139, USA
ABSTRACT
The development and operation of the synthesis and workup steps of a fully integrated, continuous manufacturing plant for synthesizing aliskiren, a small molecule pharmaceutical are presented. The plant started with advanced intermediates, two synthetic steps away from the final active pharmaceutical ingredient and ended with finished tablets. The entire process was run on several occasions, with the data presented herein corresponding to a 240 h run at a nominal throughput of 41 g h−1 of aliskiren. The first reaction was performed solvent-free in a molten condition at a high temperature achieving high yields (90 %) and avoiding solid handling and a long residence time (due to higher concentrations compared to dilute conditions when run at lower temperatures in a solvent). The resulting stream was worked-up inline using liquid-liquid extraction with membrane-based separators that were scaled-up from microfluidic designs. The second reaction involved a Boc deprotection using aqueous HCl that was rapidly quenched with aqueous NaOH using an inline pH measurement to control NaOH addition. The reaction maintained high yields (90-95 %) under closed-loop control despite process disturbances.
INTRODUCTION
Continuous processing has become an increasingly important area of research and development within the pharmaceutical industry over the past decade.1 Many factors related to increasing development and manufacturing costs, such as pressure to reduce development times, growing demand for green processes, and eliminating poor product quality, in addition to the loss of blockbuster drugs have influenced the pharmaceutical industry to find improved development pathways leading to less expensive production processes.1a, 2 Economic analysis of continuous processes has shown large savings (up to 30 %) over equivalent batch based processes.3 Continuous processing has also been identified as a route towards more sustainable processes.4 Within continuous processing, flow chemistry has remained an area of significant research over the past decade.2d, 5 Flow chemistry benefits from improvements in heat and mass transfer as well as process intensification6 and automation which do not lend themselves as readily to batch systems.
A unique aspect of the pharmaceutical industry is the drive for processes operating at multiple production scales. While microreactors are used for early flow chemistry development and many commodity chemical processes are performed at large scale in flow, there is much less work done at an intermediate production scale. This is a relevant scale for the pharmaceutical industry where production at the hundreds of grams to kilogram scale is necessary during development, particularly for preclinical and clinical trials, prior to full scale, commercial production. There is a distinct lack of research and availability of equipment at this scale. Additionally, while many single reaction steps have been demonstrated, relatively few integrated processes have been documented incorporating multiple reactions or reactions with workups relevant to pharmaceutical processes.7 Developing a fully integrated process (defined as operating all
reaction and purification steps linked together and run without isolation and offline holding) requires global optimization of unit operations across the whole process resulting in conditions that may not be optimal for any single step.8
We have built and operated a bench-scale, fully integrated, continuous pharmaceutical plant to produce aliskiren hemifumarate, 6, (Scheme 1) starting from an advanced chemical intermediate,
1, to a finished tablet.9 Here we report on the development and operation of the chemistry and workup steps within the fully integrated process. The modeling and control of a process inspired by the bench-scale pilot plant has been reported previously and provides further details on the design and operation of the entire process.10 A brief summary of the process is as follows: the plant performed two synthetic steps including intermediate workup and purification, then crystallized the final hemifumarate salt, washed and filtered the drug substance, dried the powder, mixed in an excipient, and formed the final tablet. The nominal throughput of the process was 41 g h−1 1 in the form of a tablet which corresponded to 360 tablets per hour. The process was operated on several occasions for up to ten days with the data presented here corresponding to the final ten day run. Initial runs were of portions of the process (such as only through the first reaction and crystallization or only the downstream process). The last three runs were of the whole system for periods of approximately seven days (from start-up to shutdown) for two of the runs and ten days for the final run.
This paper presents the two reaction steps and subsequent workup in detail. We describe the initial screening reactions and how conditions for the bench-scale plant were selected. The continuous liquid-liquid extraction and separation using membrane-based separators is also presented. Finally, the operation of the plant over a 240 h run is analyzed to show long term performance of the process.
RESULTS AND DISCUSSION
The process started with the aminolysis of lactone 1 with amine 2 to form the amide intermediate 4 using the carboxylic acid catalysis 3. The reaction ran solvent-free in a molten condition and was previously reported in a batch system with the objective to develop conditions amenable to flow.11 This transformation was significantly improved over previous conditions
O O O O O NHBoc H2N NH2 O HO O O O O NH2 H N NH2 O O OH O OH O HO 1 2 3 4 neat Aq. HCl O O O NHBoc H N NH2 O O OH 5 O O O NH2 H N NH2 O O OH O OH O HO 1/2 · 6 EtOAc EtOAc
with long reaction times (72 h), lower yields, and handling of insoluble slurries at lower temperatures.12 The yields were further optimized in batch by decreasing the reaction temperature and increasing the equivalents of 2 (Table 1). A longer reaction time was required due to the slower reaction rate at the lower temperature. Temperatures lower than 100 °C were not practical as the melt becomes difficult to mix due to high viscosity. It is worth noting that more than 10 equivalents of 2 resulted in equal or lower yields despite the higher equivalents, which is likely due to dilution of the reaction as observed previously.11 Therefore, 100 °C, 10 equivalents of 2, and 1 equivalent of 3 were used in the process to maximize yield while maintaining short reaction times and avoiding solid formation due to freezing of the reaction material around 80 °C.
Table 1. Reaction condition screening for conversion of 1 to 4 (Scheme 1)a Time / h Temperature / °C Equivalents 2 Conversion 1b Yield 4b
1 120 5 0.86 0.80
3 100 5 0.92 0.87
3 100 10 0.95 0.89
3 100 15 0.95 0.89
3 100 20 0.94 0.87
aAll conditions ran with 1 equivalent of 3 in batch. bFraction based on HPLC area.13
Figure 1 shows the dynamic development of the yield of 4 during a batch reaction for the higher and lower temperature conditions selected from Table 1. After a rapid rise to a maximum yield, a slow degradation took place and reduced the yield at both temperatures. However, the degradation rate was less dramatic for the lower temperature, which made the reaction less
sensitive to changes in the reaction time. Differences in the reaction time can arise in flow reactors due to the residence time distribution created by flow reactors. Fluctuations in flow rate related to throughput changes can also directly affect the reaction time by changing the mean residence time. The lower reaction temperature conditions were used as they made the yield less sensitive to these disturbances.
Figure 1. Batch reaction performance over time at 120 °C with 5 equivalents 2 (solid circles)
and 100 °C with 10 equivalents 2 (open circles). Both reactions used 1 equivalent of 3 and the yield fraction is measured by HPLC area.
A simple tube reactor was used as the reaction is relatively slow and not affected by mass or heat transfer limitations as observed during scale up of batch reactions to 100 g scale. The reagents were initially mixed with a static mixer and then flowed through the tube undergoing residence time broadening due to convection and dispersion. The reactor was sized such that these effects do not adversely affect the yield. This was done by combining the time course data in Figure 1 with models of the residence time distribution.14 Since the system was initially well mixed and the reaction assumed to be first order because of the high concentrations, the yield
0 0.2 0.4 0.6 0.8 1 0 10 20 30 40 Yi el d 4 Time / h
was estimated taking the convolution integral of the time evolution of the yield and residence time distribution:
0 E t Y Y t dt
(1)where Y is the average yield exiting the reactor; Y(t) is the yield as a function of reaction time, t;
τ is the mean residence time, and E(t) is the dimensionless residence time distribution. The
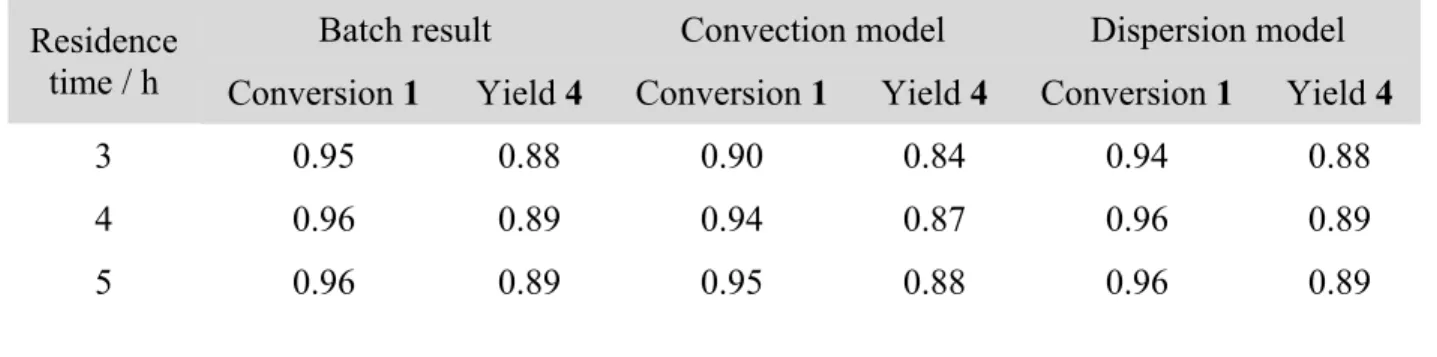
values of Y(t) were measured experimentally in a batch reactor (Figure 1) and E(t) could be predicted from models depending on the flow pattern in the reactor (see Supporting Information). A relatively large tube ID (1.17 cm) was selected to limit the length required (25 m for the final design) so the reactor would fit within an oven used to maintain the reaction temperature (100 °C). The reactor performance was predicted to lie between the convection model where only the laminar flow profile is considered and the dispersion model which includes diffusion across streamlines when using a nominal total flow rate of 675 mL h−1 (to meet the target throughput of the entire process) and a diffusion coefficient of 1 × 10⁻⁹ m2 s−1 (typical value for small, organic molecules).15 Both models were tested since there is uncertainty in the exact diffusion coefficient (due to solvent-free conditions and high viscosity). This provided a range for the reactor performance between the convection model and the dispersion model. The reactor yield was estimated by numerically integrating Equation (1) with the results summarized in Table 2. From these results, a reactor with a nominal residence time of 4 h was selected as the model predictions were not sensitive to the difference between the convection and dispersion models and yield was not predicted to be significantly higher for longer residence times (see Supporting Information).
Table 2. Estimated reactor performance for conversion of 1 to 4 (Scheme 1) accounting for
residence time distribution in flow
Residence
time / h Conversion 1Batch result Yield 4 Conversion 1Convection modelYield 4 Conversion 1Dispersion modelYield 4
3 0.95 0.88 0.90 0.84 0.94 0.88
4 0.96 0.89 0.94 0.87 0.96 0.89
5 0.96 0.89 0.95 0.88 0.96 0.89
The final process configuration is outlined in Figure 2. The crude product leaving the reactor was dissolved in water and ethyl acetate while still heated to prevent solidification if the crude melt was cooled. A pressure controller operated at 7 bar prevented the solvents from boiling when heated prior to mixing. The reactor performance over the course of the run was similar to that predicted by the model (Figure 3a). Samples were taken of the organic phase flowing out of the liquid-liquid separation. The concentration of 4 in the aqueous phase was less than 1 % of the concentration in the organic phase with similar volumes of each phase produced. No 1 was detected in the aqueous phase. This process made use of a simple workup procedure where a single extraction stage recovered nearly all 4 at high concentration (13 wt% 4, nearly saturated in
4, Figure 3b) when completely separated. The high concentration was used to increase the yield
Figure 2. Process flow diagram for synthesis and workup of 4. OV – oven; P – pump; M –
mixer; R – reactor; PC – pressure controller; S – liquid-liquid separator; Aq – aqueous waste.
Liquid-liquid separation was performed using twelve scaled-up, membrane-based separators.16 Each unit was equipped with 8.57 cm2 of membrane area in order to accommodate 10-1000 mL h−1 flow rates. Operating membrane-based separators required careful control of pressure balanced against the interfacial tension.7f, 16-17 The Laplace pressure, ∆PLaplace, in the membrane pore was given by:
2 cos Laplace P r (2)
where γ is the interfacial tension, is the contact angle, and r is the pore radius. The contact angle with polytetrafluoroethylene (PTFE) for most aqueous-organic systems is high (160° in this case) so the dominant system parameter for designing the separator (pore and channel dimensions) was the interfacial tension. The interfacial tension for this system was only 1.7 × 10⁻³ N m−1 which was much lower than most systems previously investigated, including water-ethyl acetate at 6.8 × 10⁻³ N m−1. Using 1 μm pore size membranes (to limit pressure drop for
flow through the membrane), resulted in a Laplace pressure of 6.4 × 10³ Pa. The pressure was therefore carefully controlled by two backpressure regulators located on the aqueous and organic outlets (see Supporting Information). Some loss of organic phase to the aqueous outlet was allowed to ensure that the organic stream passing through the membrane was not contaminated with any aqueous phase (Figure 3b). The membrane performance was steady for approximately 100 h after which there was a slow increase in retention of organic phase likely due to fouling of the membranes. The controlled pressure was not adjusted as the downstream processes were operating in closed-loop mode and adjusted automatically to changes in throughput. Changes to the pressure could inadvertently cause breakthrough of the aqueous phase and contaminate the crystallizers downstream. This disturbance was allowed to test the robustness of the control system. Performance could be maintained by additional separators that could be brought online to allow fouled membranes to be cleaned or replaced. Following liquid-liquid separation, the organic phase was fed into two continuous crystallizers18 and was then filtered and washed continuously. The resulting stream was 98.7 % pure by HPLC.
Figure 3. (a) Continuous reactor performance for conversion of 1 to 4. Filled circles are fraction
conversion of 1. Open circles are fraction yield of 4. Values from HPLC area. (b) Continuous 0 5 10 15 0.7 0.8 0.9 1 0 50 100 150 200 250 0 5 10 15 0.7 0.8 0.9 1 0 50 100 150 200 250 0.8 0.85 0.9 0.95 1 0 50 100 150 200 250 Yi el d 4 or conversio n 1 Time / h (a) (b) Or ga ni c phase recover y Time / h C oncent rat ion 4 / wt%
liquid-liquid extraction and separation performance. Filled circles are fraction of organic phase recovered. Open circles are concentration of 4 in the organic phase.
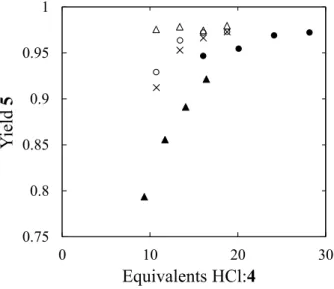
The second reaction removed the Boc group from 4 to form 5 (Scheme 1). This was done by treating a slurry of 3 in ethyl acetate with an excess of concentrated aqueous HCl. HCl was selected over other deprotection agents because of its low cost and simple, high concentration workup by addition of NaOH to form NaCl (a basic, high ionic strength aqueous phase to increase recovery of 5). Trifluoroacetic acid was tested and no deprotection occurred. The reaction conditions were optimized by testing in flow. The reaction forms CO2 that created irregular flow patterns in larger tubes (ID = 0.40 cm) due to the liquid phase settling in the bottom of the coiled tube. The coil was oriented with the axis of the coil parallel the ground (see Supporting Information). The movement of the gas did appear to improve mixing in the reactor by streaming through the liquid in the vertical portions of the coiled tube. The reaction was run at half scale and the reactor duplicated in the plant by feeding them with peristaltic pumps equipped with two heads to support two parallel flow lines at the same flow rate. Figure 4 shows the performance of a 4.9 m long reactor. The reactor was operated at ambient conditions (which was near 30 °C) because higher temperatures investigated by submerging the reactor in the bath of a heat exchanger result in increased degradation (see Supporting Information). A slurry concentration of 4 at approximately 25 wt% was selected to obtain high yields while avoiding frequent clogging of the feed tube. Slurry concentrations greater than 30 wt% 4 were difficult to pump and were found to frequently clog the lines used to convey the slurry to the reactor. A value of 16 equivalents of HCl:4 was selected since higher equivalents increased degradation. Also, using greater than 12 equivalents of HCl resulted in low sensitivity of the reactor
performance to throughput changes that can arise from upstream disturbances.19 This was important as the level control loops on the process vessels introduced fluctuations into the flow rate of the 4 slurry entering the reactor.
Figure 4. Continuous reactor performance for conversion of 4 to 5 operating at 30 °C in a heat
exchanger bath. Filled circles: 353 mL h−1 of 20 wt% 4; filled triangles: 605 mL h−1 of 20 wt% 4; open circles: 219 mL h−1 of 30 wt% 4; open triangles: 278 mL h−1 of 30 wt% 4; crosses: 333 mL h−1 of 30 wt% 4. Yield given as fraction based on HPLC area.
The crude reaction product was not stable and degraded to other impurities observed by HPLC so the reaction was rapidly halted by quenching inline with 25 wt% aqueous NaOH. While this was an extremely exothermic reaction, the temperature rise in the fluid exiting the reactor was only about 10 °C by the time the stream reached the next unit operation. The time required was approximately 10 s flowing through a 1.6 mm ID × 3.2 mm OD perfluoroalkoxy (PFA) tubing connecting the reactor to the settling tank. The limited amount of HCl quenched at any given time meant the convection from air flow over the tubing in the enclosure was sufficient to control
0.75 0.8 0.85 0.9 0.95 1 0 10 20 30 Yi el d 5 Equivalents HCl:4
temperature. The quench was performed in previous tests by combining the NaOH and crude product in a tee mixer; however, the tee would periodically clog with NaCl formed by the acid-base reaction. Under this configuration the reactor would only operate for 1-2 h before clogging at the quench. Small scale batch experiments showed that when incompletely quenched, solid NaCl precipitated out of solution and went back into solution as additional aqueous NaOH (with the associated water) was added. The mixing was improved by using a PTFE static mixer and introducing the crude product stream in the center of the channel with the NaOH stream in the annulus around the crude (see Supporting Information). CO2 formed from the previous reaction step also helped mix the two streams during neutralization. This reduced the chance that incompletely quenched material with solid NaCl reaches the wall by sheathing the product stream in a more dilute NaOH stream. The material that exited the static mixer segment contained no observable solids, and clogging at the outlet was eliminated. The final system design is shown in Figure 5.
Figure 5. Process flow diagram for synthesis of 5 from 4. P – pump; M – mixer; R – reactor; pH
– pH probe; S – liquid-liquid separator; Aq – aqueous waste; API – to final product isolation.
Figure 6 shows the performance of the deprotection reaction during the run. The yield performance (Figure 6a) was within the range observed for 16 equivalents of HCl during
development (Figure 4). Fluctuations in the yield were due to disturbances in the inlet flow rate (Figure 6b) and clogs in the inlet from portions of slurry with high 4 concentration requiring brief stoppage of the reactor. One clogging event is shown in Figure 6b at 124 h where one of the feed lines to the reactor was clogged and quickly cleared. A temporary dip in pH was observed when the flow rate of the slurry increases to compensate for the increased level in the tank containing the slurry. The automated control quickly brought the pH back to the setpoint, 12, and maintained the pH even with the high level of fluctuations observed in the slurry flow rate. The quenched stream formed a two-phase system with an aqueous NaCl phase and an organic ethyl acetate phase containing 5. The settling tank, S2, provided some buffering capacity from back-mixing (nominal organic phase residence time of approximately 3 h and nominal aqueous phase residence time of approximately 1 h) to absorb any small dips in pH or yield. The organic phase was then fed to a continuous, reactive crystallization20 where the hemifumarate salt was formed. The solid was then filtered and washed resulting in a purified drug substance.
Figure 6. (a) Continuous reactor performance for conversion of 4 to 5. Yield fraction based on
HPLC area (filled circles) and concentration of 5 (open circles) in organic phase samples collected after quenching before entering S2. (b) Continuous quench performance. Top dark
0 10 20 30 40 50 60 0.4 0.5 0.6 0.7 0.8 0.9 1 0 50 100 150 200 250 0 2 4 6 8 10 12 14 0 300 600 900 1200 120 122 124 126 128 130 Yi el d 5 Time / h (a) (b) Fl ow rat e / m L h -1 Time / h pH Conc en tr atio n 5 / wt %
dotted line is the pH; middle light dotted line is the flow rate of NaOH; bottom solid line is the flow rate of 4 slurry. Flow rates are given as single reactor values (total is double the value for paired reactors). Data are collected every 10 s.
CONCLUSIONS
The results presented here detail the reaction and workup steps from the successful operation of a fully integrated, continuous manufacturing process for a pharmaceutical product.9 The design of the process required overcoming common problems related to flow, including solids handling and long reaction times. The first reaction operated at 90 % yield, higher than previously reported conditions, and remains steady throughout the run. Workup of the crude reaction product was performed inline by liquid-liquid extraction and produced material that was subject to continuous crystallization, filtration, and washing before it was continuously carried into a second Boc deprotection reaction. The second reaction was run using automated control to reject disturbances from the process and maintained yields of 85-95 % even in the presence of disturbances. A rapid acid-base quench made use of the higher heat transfer obtained from small length scales obtained in continuous flow to control the temperature with minimal additional cooling equipment. The process was run for 240 h at a nominal production rate of 41 g h−1 of aliskiren. The process could be improved to dynamically adjust pressure control for the membrane separators which were more difficult to control in the current process than more conventional settling tanks (also used in the process). The performance could be also improved by reducing instances of clogging due to slurry streams, necessary after crystallization and filtration steps. Scaling up the process to production scale would require considering the change from laminar to turbulent flows for most of the streams and some reoptimization of parameters
for multiphase streams (slurries and gas-liquid flow in the second reactor). This plant demonstrated the necessity of reevaluating the entire pharmaceutical manufacturing process with the intent to perform the synthesis in flow, as none of the steps are the same as the current batch process. However, this approach to pharmaceutical synthesis presented significant room for innovation as entirely new pathways can be developed using new processing steps available to continuous manufacturing.
EXPERIMENTAL SECTION
General. 1 and 2 were provided by Novartis and used without further purification.
Monitoring and control of the process was implemented using a Siemens PCS7 control system. All data sources were archived at intervals from 1 s to 1 min into a central database. The initial time (0 h) was set to the point when the pumps for feeding the first reaction were turned on. Figures 3 and 6 share the same initial time. All pieces of equipment received their setpoints from the central control system. The units were brought close to their nominal conditions manually and then were switched over to automated closed-loop control. Manual intervention was only performed in cases where significant deviations from normal operation would cause hazardous conditions or would greatly reduce process performance (for example clogging of a slurry feed line or damaging the separation membranes). The entire process was contained within 6 ventilated enclosures (2.4 m wide by 1.2 m deep by 2.4 m tall).
Continuous production of 4 from 1. Dry, white powders of 1 and 2 were manually fed into
two separate melting tanks (1 L jacketed vessels) heated to 130 °C and mixed with an overhead stirrer. The initial charge of material was melted while stirring prior to starting up the pumps. Once started, the solid reagent was added periodically to each tank through a funnel and the
sensible heat of the material in the vessel melted the added powder. A screen at the bottom of the tank kept large chunks of material from exiting the tank. The material was pumped out of the tanks with two heated pumps (Quizix C-5000-10K, Vindum Engineering) located in a 130 °C oven through jacketed lines (approximately 4 m of 1/8” OD x 2.16 mm ID stainless steel tubing). The two streams were then pumped into a separate reactor oven (Friction-Aire, Blue M) maintained at 100 °C where they were initially mixed in a cross fitting (2.3 mm ID) with a stream of 3 and then mixed with an inline, helical static mixer (3.3 mm ID tube with 27 elements). The static mixer also acts as a heat exchanger to bring reagents to the oven temperature. The reagents were added in a molar ratio of 1:10:1 of 1:2:3. The mixed stream then entered a 1.17 cm ID × 25 m stainless steel, coiled tube. The reactor outlet was mixed with ethyl acetate and water to achieve 12 wt% of 4 in the organic phase and 20 wt% of 2 in the aqueous phase (based on an expected yield of 90 % and conversion of 95 %). The solvents pass through approximately 20 cm of 1/8” OD x 2.16 mm ID stainless steel tubing prior to mixing in a cross mixer with the reaction mixture. Note that the ethyl acetate was added above its flash point. The oven was designed to handle a leak of the ethyl acetate by continuously refreshing the air in the oven keeping the concentration of ethyl acetate below the lower explosion limit. Alternatively, the reactor could be installed in an oven filled with an inert gas. The two-phase product then passed through a backpressure regulator (Swagelok) set to 7 bar and cooled to near room temperature before entering the liquid-liquid separation system. The two-phase stream was split into twelve equal length branches using tees and crosses. Each of the lines to and from the separators was cut so that there are equal lengths for each separator to ensure equal distribution of the process stream. Each membrane separator contained 8.57 cm2 of microporous membrane (Pall Zelfuor 1 μm) exposed to the flow channel. The outlets of the membrane separators
rejoined and the pressure was controlled (EB1, Equilibar) to ≈ 300 Pa higher pressure in the aqueous stream relative to the organic stream. The mean residence time from the reactor through the separation was less than 5 minutes. The organic stream then proceeded to a continuous crystallization, filtration, and washing to purify 4.
Continuous production of 5 from 4. After washing, the wet cake of 4 was diluted to a
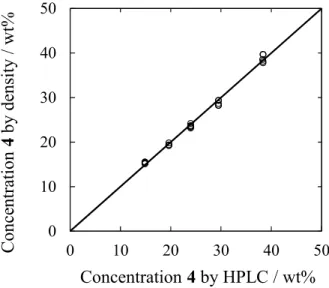
concentration of 26.5 wt% 4 in ethyl acetate by mixing with an overhead stirrer in an unbaffled 5 L glass vessel. The flow rate of ethyl acetate was manipulated by an automated feed-back concentration control loop that assured a constant concentration of 4 even in the presence of disturbances and changing performance of upstream units. The concentration of 5 was measured in a side loop of the mixing vessel with an Anton Paar DPRn 417 densitometer. A simple linear regression was fit to
C a T b c (3)
where C is the total concentration of the species of interest, T is the temperature, ρ is the density, and a, b, and c are fitted parameters (Figure 7). A peristaltic pump (Masterflex L/S) equipped with two heads and GORE Style 500 tubing (selected because it provided several weeks of continuous operation without observable changes in performance) then pumped the slurry into the second reaction that consisted of two parallel reactors each fed with its own pump head. The slurry stream exiting the dilution tank was split prior to entering each pump. The split slurry streams were mixed in a tee (M3) with 16 equivalents of 37 wt% HCl each and reacted in a separate 4.9 m length of 0.40 cm ID PFA coiled (15 cm diameter) tubing. At the outlet of the reactor, 25 wt% NaOH was mixed to quench the reaction. The mixing section for the quench was constructed from a PFA tee with the crude reaction product entering from the bottom through a 0.159 cm ID PFA tube that extended into the tee in the center of the channel. The NaOH flowed
in the side port of the tee and flowed around the outside of the tube carrying the crude reaction product. Just beyond the end of the tee was a 0.61 cm OD PTFE helical mixer (Stamixco) with 10 units. This was contained within a 0.635 cm ID tube that terminated by reducing to a 0.159 cm ID tube at the end of the static mixer. The two quenched streams then recombined and passed through a pH flow cell (Hamilton Polilyte Plus) that was used in a feedback control loop to adjust the NaOH flow rate to maintain a pH of 12. Control was implemented as a proportional-integral controller with a gain of 27 mL h−1 and an integral time constant of 50 s. The two phase reaction product was sent into a 2 L settling tank where the bottom aqueous phase was pumped to waste while the top organic phase with 5 was fed to a reactive crystallization where the hemifumarate salt was formed.
Figure 7. Parity plot for densitometer measurement of concentration compared to concentration
by HPLC.
Analysis. Species identity, purity, and concentration were determined by HPLC by comparing
and calibrating against pure samples of 1, 4, 5, and 6 provided by Novartis. Identities of
0 10 20 30 40 50 0 10 20 30 40 50 Concentration 4 by HPLC / wt% Conce ntration 4 by d en sity / wt%
compounds were confirmed by matching peaks using validated HPLC methods from Novartis (see HPLC analysis below). Concentrations of reactants, products, side products, and byproducts were monitored by HPLC (Agilent 1100).
Analysis of samples from the conversion of 1 to 4 was done by injecting 3 μg of 4 (samples were diluted with 1:1 water:acetonitrile) onto an Agilent ZORBAX Eclipse XDB-C18 2.1 mm ID × 50 mm, 1.8 μm particle diameter column maintained at 30 °C. Mobile phase A was 43.8 mM H3PO4 in water and mobile phase B was 1:1 V V−1 acetonitrile:methanol. The mobile phase was run in gradient mode at a constant flow rate of 0.416 mL min−1. The ramp followed the following schedule: initial – 45 %B; 5.31 min – 70 %B; 6.63 min – 80 %B; 7.76 min – 80 %B; 7.80 min – 45 %B; hold until 10 min and end method. Detection was performed using UV at 230 nm. Characteristic elution times – blank: 0.35 min; 4: 6.89 min; 1: 8.43 min.
The conversion of 4 to 5 was monitored by injecting 2.26 μg of 5 (samples are diluted with 85:15 V V−1 water:acetonitrile) onto an Agilent Ascentis Express RP-Amide 2.1 mm ID × 50 mm, 2.7 μm particle diameter column maintained at 30 °C. Mobile phase A was 0.1 vol% trifluoroacetic acid in water and mobile phase B was 0.05 vol% trifluoroacetic acid in acetonitrile. The mobile phase was run in gradient mode at a constant flow rate of 0.8 mL min−1. The ramp followed the following schedule: initial – 15 %B; 2.37 min – 40 %B; 4.04 min – 70 %B; 4.87 min – 70 %B; 4.88 min – 15 %B; hold until 7.5 min and end method. Detection was performed using UV at 230 nm. Characteristic elution times – blank: 0.18 min; 5: 2.96 min; 4: 4.10 min.
Supporting Information. The Supporting Information document includes description of the
residence time models used to analyze the first reactor, the pressure measurements for separator S1, and additional results for the second reactor. A video showing NaOH quench involving a static mixer is also included. This material is available free of charge via the Internet at http://pubs.acs.org.
AUTHOR INFORMATION
Corresponding Author
* Email: kfjensen@mit.edu. Tel.: +1-617-253-4589. Fax: +1-617-258-8224.
Notes
The authors declare no competing financial interest. ACKNOWLEDGMENTS
We would like to acknowledge Novartis International AG for its generous funding of this research as well as supplying starting materials 1 and 2. We acknowledge the support of the members of the pilot plant team who contributed to building and operating the plant, namely Erin Bell, Ellen Cappo, Corinne Carland, Alyssa N. D'Antonio, Joshua Dittrich, Ryan Hartman, Devin Hershey, Bowen Huo, Anjani Jha, Ashley S. King, Tushar Kulkarni, Timur Kurzej, Aaron Lamoureux, Paul S. Madenjian, Sean Ogden, Ketan Pimparkar, Joel Putnam, Anna Santiso, Jose C. Sepulveda, Min Su, Daniel Tam, Mengying Tao, Kristen Talbot, Christopher J. Testa, Justin Quon, and Forrest Whitcher (from MIT). We would like to thank Dr. Megan A. Foley for her valuable conversations regarding the chemistry (from MIT). We also thank Dr. Holger Schank for assistance with the HPLC analysis and Dr. Berthold Schenkel and Dr. Bettina Hagist for insightful discussions regarding the chemistry (from Novartis).
REFERENCES
(1) (a) Poechlauer, P.; Manley, J.; Broxterman, R.; Gregertsen, B.; Ridemark, M., Org.
Process Res. Dev. 2012, 16, 1586-1590. (b) Evans, J., The Chem. Eng. 2013, 32-34.
(2) (a) DiMasi, J. A.; Hansen, R. W.; Grabowski, H. G., J. Health Econ. 2003, 22, 151-185. (b) Suresh, P.; Basu, P., J. Pharm. Innov. 2008, 3, 175-187. (c) Federsel, H.-J. r., Acc. Chem.
Res. 2009, 42, 671-680. (d) Malet-Sanz, L.; Susanne, F., J. Med. Chem. 2012, 55, 4062-4098. (e)
Poechlauer, P.; Colberg, J.; Fisher, E.; Jansen, M.; Johnson, M. D.; Koenig, S. G.; Lawler, M.; Laporte, T.; Manley, J.; Martin, B.; O’Kearney-McMullan, A., Org. Process Res. Dev. 2013. (3) (a) Roberge, D. M.; Zimmermann, B.; Rainone, F.; Gottsponer, M.; Eyholzer, M.; Kockmann, N., Org. Process Res. Dev. 2008, 12, 905-910. (b) Benaskar, F.; Ben-Abdelmoumen, A.; Patil, N.; Rebrov, E.; Meuldijk, J.; Hulshof, L.; Hessel, V.; Krtschil, U.; Schouten, J., J. Flow
Chem. 2011, 1, 74-89. (c) Schaber, S. D.; Gerogiorgis, D. I.; Ramachandran, R.; Evans, J. M. B.;
Barton, P. I.; Trout, B. L., Ind. Eng. Chem. Res. 2011, 50, 10083-10092.
(4) Jiménez-González, C.; Poechlauer, P.; Broxterman, Q. B.; Yang, B.-S.; am Ende, D.; Baird, J.; Bertsch, C.; Hannah, R. E.; Dell’Orco, P.; Noorman, H.; Yee, S.; Reintjens, R.; Wells, A.; Massonneau, V.; Manley, J., Org. Process Res. Dev. 2011, 15, 900-911.
(5) (a) Roberge, D. M.; Ducry, L.; Bieler, N.; Cretton, P.; Zimmermann, B., Chemical
Engineering & Technology 2005, 28, 318-323. (b) Webb, D.; Jamison, T. F., Chem. Sci. 2010, 1,
675-680. (c) Wegner, J.; Ceylan, S.; Kirschning, A., Chem. Commun. 2011, 47, 4583-4592. (d) Hartman, R. L.; McMullen, J. P.; Jensen, K. F., Angew. Chem. Int. Ed. 2011, 50, 7502-7519. (6) Hessel, V., Chemical Engineering & Technology 2009, 32, 1655-1681.
(7) (a) Sahoo, H. R.; Kralj, J. G.; Jensen, K. F., Angew. Chem. Int. Ed. 2007, 46, 5704-5708. (b) Pollet, P.; Cope, E. D.; Kassner, M. K.; Charney, R.; Terett, S. H.; Richman, K. W.; Dubay, W.; Stringer, J.; Eckert, C. A.; Liotta, C. L., Ind. Eng. Chem. Res. 2009, 48, 7032-7036. (c) Bogdan, A. R.; Poe, S. L.; Kubis, D. C.; Broadwater, S. J.; McQuade, D. T., Angew. Chem. Int.
Ed. 2009, 48, 8547-8550. (d) Li, P.; Buchwald, S. L., Angew. Chem. Int. Ed. 2011, 50,
6396-6400. (e) Johnson, M. D.; May, S. A.; Calvin, J. R.; Remacle, J.; Stout, J. R.; Diseroad, W. D.; Zaborenko, N.; Haeberle, B. D.; Sun, W.-M.; Miller, M. T.; Brennan, J., Org. Process Res. Dev.
2012, 16, 1017-1038. (f) Cervera-Padrell, A. E.; Morthensen, S. T.; Lewandowski, D. J.;
Skovby, T.; Kiil, S.; Gernaey, K. V., Org. Process Res. Dev. 2012, 16, 888-900. (g) Hu, D. X.; O’Brien, M.; Ley, S. V., Org. Lett. 2012, 14, 4246-4249. (h) Christensen, K. M.; Pedersen, M. J.; Dam-Johansen, K.; Holm, T. L.; Skovby, T.; Kiil, S., Chem. Eng. Sci. 2012, 71, 111-117. (i) Wegner, J.; Ceylan, S.; Kirschning, A., Adv. Synth. Catal. 2012, 354, 17-57.
(8) Cervera-Padrell, A. E.; Skovby, T.; Kiil, S.; Gani, R.; Gernaey, K. V., Eur. J. Pharm.
(9) Mascia, S.; Heider, P. L.; Zhang, H.; Lakerveld, R.; Benyahia, B.; Barton, P. I.; Braatz, R. D.; Cooney, C. L.; Evans, J. M. B.; Jamison, T. F.; Jensen, K. F.; Myerson, A. S.; Trout, B. L., Angew. Chem. Int. Ed. 2013, 52, 12359-12363.
(10) (a) Benyahia, B.; Lakerveld, R.; Barton, P. I., Ind. Eng. Chem. Res. 2012, 51, 15393-15412. (b) Lakerveld, R.; Benyahia, B.; Braatz, R. D.; Barton, P. I., AIChE J. 2013, 59, 3671-3685.
(11) Foley, M. A.; Jamison, T. F., Org. Process Res. Dev. 2010, 14, 1177-1181.
(12) (a) Rüeger, H.; Stutz, S.; Göschke, R.; Spindler, F.; Maibaum, J., Tetrahedron Lett. 2000,
41, 10085-10089. (b) Sandham, D. A.; Taylor, R. J.; Carey, J. S.; Fässler, A., Tetrahedron Lett.
2000, 41, 10091-10094. (c) Dondoni, A.; De Lathauwer, G.; Perrone, D., Tetrahedron Lett. 2001, 42, 4819-4823. (d) Hanessian, S.; Guesné, S.; Chénard, E., Org. Lett. 2010, 12,
1816-1819.
(13) The molar absorptivities of 1 and 4 differ by less than 5 %.
(14) Levenspiel, O., Chemical Reaction Engineering. Third ed.; John Wiley & Sons: New York, 1999.
(15) Ananthakrishnan, V.; Gill, W. N.; Barduhn, A. J., AIChE J. 1965, 11, 1063-1072. (16) Kralj, J. G.; Sahoo, H. R.; Jensen, K. F., Lab Chip 2007, 7, 256-263.
(17) (a) Aota, A.; Mawatari, K.; Takahashi, S.; Matsumoto, T.; Kanda, K.; Anraku, R.; Hibara, A.; Tokeshi, M.; Kitamori, T., Microchim. Acta 2009, 164, 249-255. (b) Castell, O. K.; Allender, C. J.; Barrow, D. A., Lab Chip 2009, 9, 388-396.
(18) Zhang, H.; Quon, J.; Alvarez, A. J.; Evans, J.; Myerson, A. S.; Trout, B., Org. Process
Res. Dev. 2012, 16, 915-924.
(19) Lakerveld, R.; Benyahia, B.; Heider, P.; Zhang, H.; Braatz, R.; Barton, P., Processes
2013, 1, 330-348.
(20) Quon, J. L.; Zhang, H.; Alvarez, A.; Evans, J.; Myerson, A. S.; Trout, B. L., Cryst.
Development of a Multi-Step Synthesis and Workup
Sequence for an Integrated, Continuous
Manufacturing Process of a Pharmaceutical
Supporting Information
Patrick L. Heider,† Stephen C. Born,† Soubir Basak,† Brahim Benyahia,† Richard Lakerveld,† Haitao Zhang,† Rachael Hogan,† Louis Buchbinder,† Aaron Wolfe,† Salvatore Mascia,† James
M. B. Evans,† Timothy F. Jamison,‡ and Klavs F. Jensen,†,*
†
Department of Chemical Engineering
‡
Department of Chemistry
Massachusetts Institute of Technology
77 Massachusetts Avenue
RESIDENCE TIME DISTRIBUTION CALCULATIONS
The estimated conversions for the reactor shown in Table 2 were based on two models of the residence time distribution. The analysis follows models described in many reaction engineering textbooks.1 The first model is the convection model which has the functional form of
3 3 ( ) 2 E t t τ = for 2 t≥τ (S1)
where E(t) is the dimensionless residence time distribution, τ is the mean residence time, and t is the time spent reacting. Note that the model is a function only of a mean residence time meaning that the actual geometry of the reactor is not important other than to determine the applicability of the model, discussed below. Figure S1 shows the residence time distribution for the selected reactor residence time of 4 h.
Figure S1. Residence time distribution for a laminar flow model with a mean residence time of
4 h.
The other relevant model for the tubular reactor is the dispersion model. For low extents of dispersion, the residence time distribution is given by
0 1 2 3 4 5 0 0.5 1 1.5 2 E (t ) t/τ
( )
2 1 1 exp 4 4 t E t D D uL uL τ π − = − (S2)where u is the mean velocity in the tube, L is the tube length, and D is the dispersion defined by
2 2 192 t u d D= +D D (S3)
where D is the diffusion coefficient and dt is the tube diameter. Figure S2 shows the residence
time distribution for the final reactor design with 1.17 cm ID × 25 m length and a total flow rate of 11.2 mL min-1.
Figure S2. Residence time distribution for a dispersion model for the reactor used.
Selecting between the two models to use to describe a tube reactor is a function of the Péclet number, Pe, given by
t ud Pe= D (S4) 0 0.5 1 1.5 2 0 0.5 1 1.5 2 E (t ) t/τ
and the aspect ratio of the reactor (tube length over tube diameter).1-2 For Pe numbers in the range encountered in the lab scale tube reactors considered, (order 1 × 10⁴), the shift from a dispersion model to convection model is given by the value of the dispersion number, ND, given
by D D N uL = (S5)
The values of ND less than 0.01 exhibit small deviations from plug flow and have residence time
distributions described by Equation S2. Larger values result in reactors with intermediate performance between dispersion and convection models requiring numerical solutions of the full reactor. Values of ND greater than 2 correspond to reactors described by the convection model.
The residence time distributions in Figure S1 and Figure S2 were combined with the batch reaction time course shown in Figure 1 using Equation 1. For the convection model, Equation 1 is exact as the model assumes no interactions between streamlines. For the dispersion model, the equation holds for first order reactions which is assumed for the high concentration conditions tested. As the values of ND become even smaller, the reactor performance approaches that of
plug flow where the outlet matches that of a batch reactor shown in Figure 1. Keeping the residence time equal to the 4 h of the original reactor, the tube diameter where ND equals 0.01
would be 0.53 cm with a length of 124 m (compared to the 1.17 cm ID × 25 m tube used). One drawback of the lower dispersion tube, besides winding it into a compact shape, is an increased pressure drop. The reaction mixture had a viscosity of 0.25 Pa ∙ s which gives a pressure drop of 2580 Pa in the reactor used compared to 3.11 × 10⁶ Pa in the proposed low dispersion design. Increasing the length of the existing design (1.17 cm ID) would also lower dispersion and approaches the yield values for the batch reactor of equivalent residence time. This would eventually lower yield as the data in Figure 1 shows a decrease in yield at longer residence times.
Another way in which the dispersion can be limited is by flowing through a coiled tube.3 The reactor used was made with two concentric coils, the smaller of which being 30 cm in diameter. The key parameter for coiled flows is the Dean number, Dn,
1 2 t c d Dn Re d = (S6)
where dc is coil diameter and Re is the Reynolds number given by
t
ud
Re ρ
µ
= (S7)
where μ is the viscosity and ρ is the density. The effect on D is correlated to3
2
Dn Sc (S8)
where Sc is the Schmidt number
Sc µ
ρ =
D (S9)
The value of Dn2∙Sc used in the reactor is 64 which is predicted to have nearly identical values of
D as a straight tube.
PRESSURE CONTROL OF MEMBRANE SEPARATORS
The pressure applied to the organic and aqueous outlet of the membrane based liquid-liquid separators was continuously monitored at 0.1 Hz. Figure S3 shows the pressure transducer measurements located between S1 and PC2 monitoring the pressure in the organic phase.
Figure S3. (a) Pressure values measured on the organic phase exiting the membrane based
liquid-liquid separators (S1 in Figure 2). (b) Difference in pressure between the aqueous and organic phase outlets of S1. Measurements were taken at 0.1 Hz intervals. Off scale values at the beginning and end of the traces are for startup and cleaning of the membranes.
BOC DEPROTECTION REACTOR OPTIMIZATION
The Boc deprotection reactor involved gas generation (CO2) which could cause gravity effects where gas bypasses the liquid in different manners depending on the reactor orientation. This was investigated by running the reactor with the axis of the coil orientated horizontally and vertically. The results are shown in Table S1. Orientating the reactor coil horizontally resulted in 1-2 % higher yield and was therefore selected for use in the plant.
7 7.2 7.4 7.6 7.8 8 0 50 100 150 200 250 -2000 -1000 0 1000 2000 0 50 100 150 200 250 (a) (b) Time / h Time / h P res su re / P a P res su re × 10 4/ P a
Table S1. Yield of 5 in Boc deprotection reaction in coiled tube reactor with different coil axis
orientationa Flow rate of 4 slurry / mL h-1
Equivalents HCl:4 Tube length / m Yield 5, horizontalb Yield 5, verticalb 175 20.1 4.9 96.7 97.9 219 16.1 4.9 94.7 96.0 219 16.1 7.6 91.2 95.0 219 16.1 7.6 94.5 95.2 219 18.8 4.9 96.4 97.7 262 13.4 4.9 89.5 93.6 a
All runs performed at 30 wt% 4 and 30 °C b
Fraction based on HPLC area.
The reactor operating temperature was varied by submerging the coil in a thermostatic bath. Varying the reactor temperature showed a peak yield at 30 °C (Figure S4). The ambient temperature in the enclosures where the plant was located was near 30 °C so the bath was eliminated and the reactor was operated at the ambient conditions with similar results (see Figure 6).
Figure S4. Yield of 5 in coil reactor submerged in a thermostatic bath at varying temperatures.
16 equivalents of HCl:4 and 30 wt% 4 slurry were used for each experiment. Open circles: 219 mL h−1 of 30 wt% 4; open triangles: 278 mL h−1 of 30 wt% 4; crosses: 333 mL h−1 of 30 wt% 4. Yield given as fraction based on HPLC area.
REFERNCES
(1) Levenspiel, O., Chemical Reaction Engineering. Third ed.; John Wiley & Sons: New York, 1999.
(2) Ananthakrishnan, V.; Gill, W. N.; Barduhn, A. J., AIChE J. 1965, 11, 1063-1072. (3) Johnson, M.; Kamm, R. D., J. Fluid Mech. 1986, 172, 329-345.
0.75 0.8 0.85 0.9 0.95 1 10 20 30 40 50 60 Y ie ld 5 Temperature / °C