Publisher’s version / Version de l'éditeur: PERD/CHC Report 20-84, 2007-05
READ THESE TERMS AND CONDITIONS CAREFULLY BEFORE USING THIS WEBSITE.
https://nrc-publications.canada.ca/eng/copyright
Vous avez des questions? Nous pouvons vous aider. Pour communiquer directement avec un auteur, consultez la première page de la revue dans laquelle son article a été publié afin de trouver ses coordonnées. Si vous n’arrivez pas à les repérer, communiquez avec nous à PublicationsArchive-ArchivesPublications@nrc-cnrc.gc.ca.
Questions? Contact the NRC Publications Archive team at
PublicationsArchive-ArchivesPublications@nrc-cnrc.gc.ca. If you wish to email the authors directly, please see the first page of the publication for their contact information.
For the publisher’s version, please access the DOI link below./ Pour consulter la version de l’éditeur, utilisez le lien DOI ci-dessous.
https://doi.org/10.4224/12328812
Access and use of this website and the material on it are subject to the Terms and Conditions set forth at
Grand banks iceberg management
AMEC Americas. AMEC Earth and Environmental; R. F. McKenna and
Associates; PETRA International Ltd.
https://publications-cnrc.canada.ca/fra/droits
L’accès à ce site Web et l’utilisation de son contenu sont assujettis aux conditions présentées dans le site LISEZ CES CONDITIONS ATTENTIVEMENT AVANT D’UTILISER CE SITE WEB.
NRC Publications Record / Notice d'Archives des publications de CNRC:
https://nrc-publications.canada.ca/eng/view/object/?id=754dda8b-6c1c-4712-bdc8-a8844324ccaa https://publications-cnrc.canada.ca/fra/voir/objet/?id=754dda8b-6c1c-4712-bdc8-a8844324ccaa
Grand Banks Iceberg Management
PERD/CHC Report 20-84
May 2007
Grand Banks Iceberg Management
PERD/CHC Report 20-84
Prepared for Dr. Garry Timco Canadian Hydraulics Centre National Research Council Canada
Ottawa, ON, K1A 0R6 Canada
garry.timco@nrc.ca
Prepared by
AMEC Earth & Environmental
A Division of AMEC Americas 133 Crosbie Road
PO Box 13216 St. John’s, NL, A1B 4A5
Canada
john.mcclintock@amec.com R. F. McKenna & Associates
P.O. Box 372 Wakefield, QC, J0X 3G0 Canada richard.mckenna@sympatico.ca PETRA International Ltd. P.O. Box 191 Cupids, NL, A0A 2B0 petra@persona.ca May 2007 TN07227301
EXECUTIVE SUMMARY
This report summarizes the current state-of-the-art of iceberg management on the Grand Banks of Newfoundland on the East Coast of Canada through description of the magnitude and range of iceberg conditions, and the approaches used for iceberg detection and towing. There is presently a high standard of iceberg towing and deflection capabilities and iceberg detection frameworks in place, all implemented with generally proven ice management plans and programs.
There appear to be no major issues with iceberg towing. The long standing synthetic line tow rope method has been effective for many years. The new iceberg tow net has been demonstrated over the past three to four years to significantly improve the prospect of managing slippery or otherwise hard to tow small and medium icebergs. Greater experience with the net would improve confidence for vessel captains and industry.
Early detection of icebergs and minimizing possible gaps in the spatial, temporal, and environmental conditions coverage provided by the growing range of satellite and radar technologies together with aerial reconnaissance, remain challenges. Further quantification of these coverage parameters and the potential benefits and limitations would be valuable as input into planning and decision-making tasks. Increased operational use of satellites would improve their confidence for all stakeholders.
Resource management and decision-making including which icebergs to tow, how soon, in which directions, and for how long are perennial challenges especially with multiple fields since different operators have different needs and priorities. This is significant both from a risk mitigation standpoint, to ensure that the “best” decision can be made, and from a cost perspective so that resources are assigned for appropriate lengths of time. The use of data fusion and decision-making tools would appear to be the obvious route and good progress has been made with each. Better monitoring and assimilation of met-ocean conditions is another factor for the decision-making. The PERD iceberg sighting and iceberg management databases are good information resources and they should be maintained. The databases offer utility in a number of areas including study of past conditions and performances, for planning future activities, and possibly as input to other initiatives, such as decision-making or data fusion toolboxes and iceberg management planning aid technologies.
A suggested plan to identify outstanding iceberg management issues, that in order to solve or measurably improve require dedicated research, is presented. A descriptive list of issues is provided for initial consideration by stakeholders. It is proposed that ideally the present and target levels of performance for each are estimated to help judge the possible cost-benefit of pursuing each issue. An agreement on objectives, determination of constraints and resource requirements, and scheduling are then required followed by validation of the plan.
A timely discussion is also presented on the rapid changes in the melt and calving rate of the Greenland ice sheet in response to equally rapid air and ocean temperature warming in the last decade, and the effects of these changes on sea ice and icebergs. These environmental changes directly affect both the Labrador Sea and the Grand Banks of Newfoundland and are front and centre in the debate over global climate change.
ACKNOWLEDGEMENTS
The project team gratefully acknowledges the assistance and contributions of the following individuals for this study who are also researchers and practitioners for Grand Banks ice management operations.
Freeman Ralph, C-CORE Des Power, C-CORE Kelley Dodge, C-CORE Pip Rudkin, PAL
PROJECT TEAM John McClintock, AMEC
Richard McKenna, R.F. McKenna & Associates Chris Woodworth-Lynas, PETRA International Ltd. Stephen Green, AMEC
Diana Cardoso, AMEC
CITATION
McClintock, J., R. McKenna, and C. Woodworth-Lynas, May 2007. "Grand Banks Iceberg Management." PERD/CHC Report 20-84. Report prepared for PERD/CHC, National Research Council Canada, Ottawa, ON. Report prepared by AMEC Earth & Environmental, St. John's, NL, R.F. McKenna & Associates, Wakefield, QC, and PETRA International Ltd., Cupids, NL.
TABLE OF CONTENTS
EXECUTIVE SUMMARY ...I ACKNOWLEDGEMENTS ...II PROJECT TEAM ...II CITATION ...II 1.0 INTRODUCTION...1 1.1 Objectives ...1 1.2 Background...1 1.3 Report Structure ...3 2.0 ICE MANAGEMENT...4
2.1 Role of Ice Management...4
2.2 Grand Banks Iceberg Conditions...4
2.3 Regulatory Regime ...11
2.4 Critical Factors in Ice Management ...14
2.5 Ice Season Reports ...17
2.6 Iceberg Detection...17
2.7 Iceberg Towing and Deflection ...18
2.7.1 Single Vessel Iceberg Towing Procedure...18
2.7.2 Dual Vessel Towing...28
2.7.3 Water Cannon ...28
2.7.4 Propeller (“Prop”) Washing...30
3.0 ICEBERG DETECTION RESEARCH ...32
3.1 Overview...32
3.1.1 Range of Potential Platforms and Sensors...32
3.1.2 Strategic Issues ...32 3.1.3 Tactical Issues...33 3.1.4 Radar Bands...34 3.2 Airborne Systems ...34 3.3 Satellite Systems ...34 3.3.1 Background ...34
3.3.2 Operational Experience with Satellite Radar in Canada...35
3.3.3 Iceberg – Vessel Discrimination ...36
3.3.4 Iceberg Detection in Sea Ice ...36
3.3.5 Trade-off Between Resolution and Swath Width...36
3.4 HF Radar ...38 3.5 Marine Radar ...38 3.5.1 Background ...38 3.5.2 Coherent Radar ...39 3.6 Other Systems ...39 3.6.1 UAV ...39
3.7 Integration of Detection and Tracking Systems ...40
3.7.1 Trajectory Forecasts...40
3.7.2 Fusion of Data from Multiple Sensors ...40
3.7.3 Calving Forecasts...41
4.0 ICEBERG TOWING RESEARCH ...42
4.1 West Greenland Towing Experience and Analysis...42
4.2 The PERD Iceberg Management Database ...43
4.4 C-CORE Iceberg Decision Making Toolbox ...51
4.5 Dunderdale Iceberg Management Planning Aid (IMPA)...51
5.0 WHERE HAVE ALL THE ICEBERGS GONE? ...52
5.1 Background...52
5.2 Iceberg Climate...54
5.2.1 Ocean Temperatures: Intermediate Water ...54
5.2.2 Ocean Temperatures: Sea Surface...54
5.2.3 Air Temperature...55
5.2.4 Sea Ice Extent ...57
5.3 Greenland Ice Sheet and Icebergs ...59
5.3.1 Glacialquakes ...61
5.3.2 Response of Individual Glaciers ...64
5.4 Significance to Icebergs...66
5.5 Summary ...68
5.5.1 Iceberg Production is Increasing ...68
5.5.2 Iceberg Flux is Decreasing ...68
5.5.3 The Future ...68
6.0 OUTSTANDING ISSUES AND AREAS FOR RESEARCH...69
6.1 Observations...69
6.2 A Suggested Plan for Ice Management Issues (IMI) ...70
7.0 REFERENCES...77
7.1 Personal Communications...77
7.2 Literature Cited ...77
7.3 Additional Reading...82
LIST OF FIGURES Figure 1.1 Drilling Locations, Offshore Newfoundland ...2
Figure 2.1 Major Ocean Circulation Features...5
Figure 2.2 Annual Number of Icebergs Crossing 48 o N (1946-2006) (Data from: IIP, 2005) 7 Figure 2.3 Monthly Number of Icebergs Crossing 48 o N (1946-2006) (Data from: IIP, 2005) 8 Figure 2.4 Iceberg Size Comparisons. ...10
Figure 2.5 Iceberg Draft Estimation Graph ...11
Figure 2.6 Relationship between the various factors for floater operations in ice environments (from Makrygiannis et al., 2006)...14
Figure 2.7 Sample Ice Season Report Table of Contents (PAL, 2003). ...19
Figure 2.8 Sample Daily Tactical Iceberg Plot (AMEC, 2000c) ...20
Figure 2.9 Single Vessel Iceberg Towing ...23
Figure 2.10 Retrieving the Tow Line, West Navion in Distance ...24
Figure 2.11 Iceberg Towing by Normand Jarl ...24
Figure 2.12 Havila Charisma Towing Iceberg F170 as Seen From the West Navion ...25
Figure 2.13 Iceberg F170 Under Tow by Havila Charisma, West Navion in Background 25 Figure 2.14 Use of Towing Catenary to Reduce Overturning Moment of Unstable Icebergs 26 Figure 2.15 High Sea State Deployment of Towing Equipment...27
Figure 2.17 Propeller Washing...31
Figure 4.1 West Greenland, Deflected Iceberg Size Distribution (Source: AMEC, 2002a). 42 Figure 4.2 West Greenland Towing Complications (Source: AMEC, 2002a). ...43
Figure 4.3 PERD Iceberg Management Database Key Parameters. ...44
Figure 4.4 Grand Banks Iceberg Tow Methods (Data From: PERD IMDB)...45
Figure 4.5 Grand Banks Iceberg Tows: Reason Management Ended (Data From: PERD IMDB) 46 Figure 4.6 Grand Banks Iceberg Tow Evaluations (Data From: PERD IMDB) ...47
Figure 4.7 Concept of Iceberg Net Towing (Source: C-CORE, 2004a) ...49
Figure 4.8 Iceberg Net Schematic (Source: C-CORE, 2004a). ...49
Figure 4.9 Iceberg Net In Use (Source: C-CORE, 2004a)...50
Figure 4.10 Iceberg Net Storage (Source: C-CORE, 2004a)...50
Figure 5.1 Ice extent anomaly for winter showing decrease in Arctic ice in the month of April (the month of greatest ice extent) since 1979 (National Snow & Ice Data Centre). 52 Figure 5.2 Ice extent anomaly for summer showing decrease in Arctic ice in the month of September (typically the month with the least ice) since 1979 (National Snow & Ice Data Centre). 53 Figure 5.3 Actual ice extent is decreasing at a rate faster than all of the combined 18 prediction models used by the Intergovernmental Panel on Climate Change (IPCC) in preparing its 2007 assessments (National Snow & Ice Data Centre). ...53
Figure 5.4 Since 1995 spring sea surface temperature (SST) anomalies in the Labrador Sea have increased in size and since 1997 extend into Disko Bay, western Greenland (data from NASA N.O.M.A.D.S.)...55
Figure 5.5 Number of positive degree days at 100 m and 1169 m, Jakobshavn Isbrae (from data of Thomas et al. 2003)...56
Figure 5.6 Positive Degree Days (PDD) from Egedesminde, near Jacobshavn Isbrae, and Sea Surface Temperatures (SST) for the four warmest months (July – October) for the N. Atlantic and Davis Strait 50 – 65O N, 45 – 65O W (from Thomas et al. 2003). ...56
Figure 5.7 Decline in Arctic sea ice extent from 1978-2005. The September trend from 1979 to 2005, now showing a decline of more than 8 percent per decade, is shown with a straight blue line (National Snow & Ice Data Center)...57
Figure 5.8 Example of sea ice concentration (left) and sea surface temperature anomalies (right) for April 2000 (top) & 2006 (bottom). Increasing sea surface temperatures correlate with below normal sea ice concentration anomalies. (National Snow & Ice Data Center). ...58
Figure 5.9 Map of Greenland showing the estimated volumetric increase in iceberg discharge in the decade between 1996 and 2005 (based on mass balance measurements for the entire ice sheet by Rignot and Kanagaratnam, 2006)...60
Figure 5.10 Top: Map of Greenland showing locations of summer glacialquakes between 1993 and 2005. Summer seismicity is more than 5 x greater than in winter. Bottom: Graph showing increase in frequency of glacialquakes (green bars) against a constant background of earthquakes (grey bars). Based on Ekström et al. 2006; Joughin, 2006. ...63
Figure 5.11 Retreat of the floating ice tongue of Jakobshavn Isbrae, west Greenland...65
Figure 5.12 Left: Surface runoff on the Greenland ice sheet draining into a large Moulin. Bottom: view of large meltwater pool. ...67
LIST OF TABLES
Table 2.3 Grand Banks Iceberg Length, Width and Height Statistics...8
Table 2.1 International Ice Patrol Iceberg Shape Classification Codes...9
Table 2.2 Iceberg Size Classifications...9
Table 3.1 Detection Systems and Supporting Platforms ...32
Table 3.2 Radar Bands...34
Table 3.3 Research Projects on Satellite Radar Detection of Icebergs...35
Table 3.4 ENVISAT Modes, Resolutions and Swath Widths...37
Table 3.5 RADARSAT-1 Modes, Resolutions and Swath Widths ...37
Table 3.6 RADARSAT-2 Modes, Resolutions and Swath Widths ...37
Table 5.1 Estimated increase in iceberg production (km3) of the Greenland ice sheet between 1996 and 2005 (derived from data of Rignot and Kanagaratnam, 2006). ...60
1.0 INTRODUCTION 1.1 Objectives
The objective of this work is to summarize the current state-of-the-art of iceberg management on the Grand Banks of Newfoundland on the East Coast of Canada, and to define outstanding research initiatives that would improve its safety and efficiency. Specific objectives are:
• to provide detailed information on the approach used for iceberg detection and towing on the Grand Banks
• to provide information on past research efforts that have been successful at improving safety and efficiency of iceberg towing
• to detail a plan that would help identify outstanding issues that should be addressed through a dedicated research program
1.2 Background
The development of hydrocarbon resources on the Grand Banks of Newfoundland and in the Labrador Sea is hampered by the presence of icebergs. Production platforms, collection and offloading systems, operations, and exploration schedules are all influenced and can be affected by iceberg threat. Over the past 30 years, techniques for safely working in this environment have been developed, implemented, and refined.
There are presently three oil-producing fields in the North Atlantic: Hibernia, Terra Nova, and White Rose (Figure 1.1). The Hibernia production installation consists of a platform (concrete gravity base structure (GBS) and topsides facilities), export lines, and Offshore Loading System (OLS). The installation is located on the Grand Banks approximately 170 nautical miles (315 km) east of St. John’s, Newfoundland. Towout of the GBS was completed in summer 1997 with first oil later that fall. Field development includes helicopter and supply vessel operations support. A steel-hulled Floating Production, Storage and Offloading (FPSO) design was selected for Terra Nova located 21 nautical miles southeast of Hibernia. First oil was achieved in January 2002. The third field, White Rose, located 30 nautical miles northeast of Hibernia and Terra Nova, is also being developed with an FPSO and first oil there was in November 2005. Project lifetimes are estimated to be in the range of at least 15 to 20 years. All projects are supported with shuttle tanker shipments to Newfoundland. Water depths range from about 85 m at Hibernia to 95 m at Terra Nova to 120 m at White Rose.
There is also the prospect of the development of the Hebron Field located in the Jeanne d’Arc Basin, approximately 10 km north of Terra Nova and approximately 35 km southeast of Hibernia. Drilling exploration has also been active in the Orphan Basin region north of the Grand Banks with drilling of the deep water (~2000 m) well Great Barasway from summer 2006 to winter 2007, and in the Flemish Pass (e.g., Tuckamore B-27 in spring 2003).
54 W° 53° 52° 51° 50° 49° 48° 47° 46° 45° 44° 43° 45 N° 46° 47° 48° 49° 50° 45° 46° 47° 48° 49° 50° 54° 53° 52° 51° 50° 49° 48° 47° 46° 45° 44° 43° Hibernia Great Barasway White Rose
Atlantic Ocean
F
le
m
is
h
P
a
ss
Flemish
Cap
Orphan Basin
Grand Banks
St. John's
Terra Nova 200,500, 1000, 2000 m depth contours are shownFigure 1.1 Drilling Locations, Offshore Newfoundland
Each year on the Grand Banks the potential exists for numerous icebergs, ranging from very large icebergs of mass one million tonnes or greater to small growlers. Strong winds and occasionally storm force wind and wave conditions, and frequently poor visibility in ice season can reduce visual and radar detection of icebergs and the effectiveness with which they can be towed or deflected. Being able to predict the drift trajectory of an iceberg is important for ice management planning and deployment of resources: occasionally strong and sometimes complex ocean currents and tidal patterns can make this prediction difficult. Ice management operations are carried out with support vessels for iceberg towing and deflection, onboard Ice Watch services, iceberg data management, communication, and reporting, and iceberg detection resources such as radar, fixed-wing aircraft and remote sensing satellite.
A significant body of experience has been achieved since towout of the Hibernia GBS in 1997 with Grand Banks ice management operations at Hibernia, and subsequently Terra Nova, and White Rose, carried out each year. Iceberg season on the Grand Banks traditionally lasts from April (or March) to June (or July) and the number of icebergs seen is highly variable from one year to the next. In the past 10 years this has ranged from 1380 icebergs in 1998 to none in 2006, averaging 542 each year over this recent period.
A comprehensive iceberg management program was also completed during a ten-week drilling program offshore West Greenland, in summer 2000, in which 228 iceberg targets
were tracked, and of a total of 168 confirmed icebergs, 64 icebergs were deflected. These operations, both recent Grand Banks and Greenland, have been documented in annual or end of well ice reports.
Iceberg management has also been supported and augmented by research activities. This includes the work in 1998 contracted by NRC to develop a strategy for improving iceberg management on the Grand Banks in which a complete and detailed survey of physical iceberg deflection techniques and capabilities was presented (Crocker et al., 1988). There have been numerous PERD-sponsored Canadian East Coast Ice Engineering Issues studies focusing on practical solutions to ice problems relevant to development of this area and the associated Canadian Hydraulics Centre (CHC) web site (NRC-CHC, 2007) is an excellent resource. This includes dedicated databases for iceberg sightings and iceberg management operations which have been created and are updated frequently in a collaboration of ice management service providers and stakeholders.
Significant advances in iceberg detection technologies, through platform-based radar and RADARSAT and other remote sensing technologies, and ice trajectory modelling have also been achieved through various government and industry-sponsored initiatives.
Improvements are still possible in these areas, including iceberg detection and management in high seas and in sea ice (more an issue for Labrador or north of the Grand Banks), assimilation of iceberg monitoring data and gaps, decision-making, as well as ongoing challenges of physically dealing with smaller icebergs and ones that are more difficult to manage.
For a range of present and future development scenarios, pipelines, flowlines, wellheads, and subsea tie-ins are expected to play an increasingly important role in the economic development of oil and gas on Canada’s east coast, and must be protected from icebergs. These supporting installations introduce additional considerations for iceberg management. The present report is intended to provide an up-to-date summary of both iceberg detection and iceberg towing in the Grand Banks region, outline safety and efficiency issues that remain and provide guidance on future research directions for improved iceberg management planning and operations.
1.3 Report Structure
Section 2 of this report provides an overview of ice management, including description of: Grand Banks iceberg conditions, critical factors for ice management, the approaches used for iceberg detection and towing, and decision-making. Fundamental to iceberg management and possible improvements in ice operations is an understanding of the range and magnitude of conditions which may be encountered. The detection and towing strategies introduced in Section 2 are elaborated in Section 3, which details iceberg detection approaches and research including airborne, satellite, HF and marine radar, and Section 4, where additional towing techniques and research activities are described. Section 5 is a timely discussion of the rapid changes in the melt and calving rate of the Greenland ice sheet and effects of these changes on sea ice and icebergs: environmental changes directly affecting both the Labrador Sea and the Grand Banks. Section 6 presents a suggested plan intended to identify outstanding issues that in order to solve require a dedicated research program.
2.0 ICE MANAGEMENT 2.1 Role of Ice Management
Ice management is a required element of physical environmental programs for oil and gas exploration or production drilling operations taking place in regions in which sea ice and/or icebergs can occur.
For regulators, concerns about ice management include:
• the safe operation of platforms in the environment for which they were designed • documentation that the operation of platforms has indeed been safe
Concerns about ice management are therefore related to verification that systems and procedures have acceptable success levels in the context of overall platform safety. This is a research area that was initiated during drilling offshore Labrador in the 1970s and continues to this day on the Grand Banks.
For operators, ice management is used to:
• ensure that the platform operates safely in the environment for which it was designed • reduce risk to personnel, environment and assets over and above design
requirements
• minimize disruptions to drilling or producing operations
Ice management is essential for drilling platforms or floating production platforms because these generally cannot operate in ice environments without some form of management support. Ice management is important for fixed platforms because substantial savings may accrue by minimizing disruptions to operations.
Present oil and gas drilling activities offshore Newfoundland are shown in Figure 1.1.
2.2 Grand Banks Iceberg Conditions
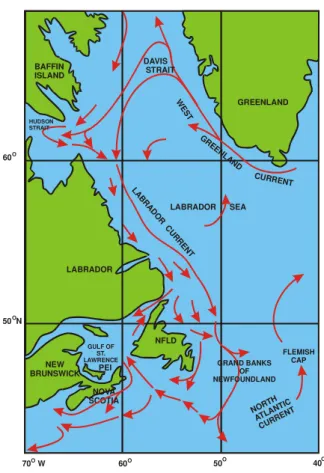
The East Coast and Newfoundland can be a high traffic area for many icebergs in their journeys south from the fjords of Greenland. Icebergs are masses of fresh water ice which calve each year from the glaciers of Greenland. Icebergs are moved by both the wind and ocean currents, and typically spend one to three years traveling a distance up to 2897 km (1800 miles) to the waters of Newfoundland. The West Greenland and Labrador Currents (Figure 2.1) are major ocean currents which move the icebergs about the Davis Strait, along the coast of Labrador, to the northern bays of Newfoundland, and to the Grand Banks. Icebergs will exhibit little or no melting in sea temperatures of about 5oC or less while waves and warm air temperatures will tend to erode them in their travels. A medium iceberg (15-30 m or 32.8-49.2 ft high, 45-90 m or 147.6-295.3 ft long) will deteriorate in sea water of 4.4oC in about 10 days. Generally larger icebergs can survive until late into the summer.
Figure 2.1 Major Ocean Circulation Features
On average, the seawater temperature on the Grand Banks is highest in August, when the temperature stratification is also the highest. Mean sea temperature in August is about 12oC near-surface, -0.2oC at 50 m depth and about -1oC at 80 m. On average, the temperature stratification is primarily limited to within 50 m depth below the water surface. Below the 50 m depth, the seawater temperature remains near zero on average all year round. The seawater temperature and stratification is at a minimum in January and February. The mean sea temperature in February is about -0.5oC near-surface, -0.4oC at 50 m depth and about -0.3oC at 80 m.
The presence of easterly and northeasterly winds can strongly influence the numbers of icebergs that make their way to the Newfoundland coast and also onto or off the Grand Banks. As witnessed in 2000 for example on the Grand Banks, local wind conditions can bring large numbers of bergs onshore from their traditional route in the Labrador Current (AMEC, 2000c, PAL, 2000). Larger icebergs have the potential to become grounded on the Grand Banks.
These factors combined with the prevailing wind directions and sea and air temperatures will determine whether and for how long the icebergs stay on the Grand Banks and along the coast. The majority of icebergs will be present from March to June or July. By August in most years, the icebergs both along the coast and offshore Newfoundland will have drifted south of the Grand Banks or melted.
LABRADOR SEA LAB R AD O R C U RR EN T NORT H ATLA NTIC CURR ENT GR EE NL AND W E ST CURRENT HUDSON STRAIT GULF OF ST. LAWRENCE FLEMISH CAP 70 WO 60O 50O 40 O O O 50 N 60 NFLD LABRADOR BAFFIN ISLAND GREENLAND NOVA SCOTIA PEI NEW BRUNSWICK DAVIS STRAIT GRAND BANKS OF NEWFOUNDLAND
Iceberg Numbers
The U.S. Coast Guard International Ice Patrol (IIP)1 has monitored the number of icebergs crossing latitude 48o N (about 30 km north of St. John’s) since 1914 as part of its core purpose to promote safe navigation of the Northwest Atlantic Ocean when the danger of iceberg collision exists. This number is highly variable from one year to the next. Figure 2.2 illustrates the interannual variability in this total. In 1984 a total of 2202 icebergs were recorded crossing 48o N whereas in 2005 there were 11 and in 1966 and 2006 there were none. The largest number in the past 10 years is 1380 icebergs in 1998, although the presence of icebergs on the Grand Banks is not sufficient to impact drilling operations2. In 1999, while there were a good number of icebergs on the East Coast, most of them actually drifted south and west through the Strait of Belle Isle at the northern tip of Newfoundland: the (Grand Banks) “south of 48o N count” was 22.
The annual average iceberg count is 543 over this recent 10-year period and the annual mean is 553 icebergs. Figure 2.3 shows the monthly mean and median number of icebergs crossing 48o N. The monthly mean ranges from 8 in August and 18 in February, to 71 in March and 90 in June, with the greatest averages in April (130) and May (143). During the main portion of the season from March to June, the median ranges from 31 in March to 70 in April.
1
http://www.uscg.mil/lantarea/iip/home.html
2
“The closest iceberg to the Hibernia platform was estimated to be 30 nautical miles north northwest
of the site on 14 May. The iceberg was sighted during a fixed-wing aircraft surveillance flight (no size information was available, although the majority of bergs in the region (to the northwest through to northeast, east, and southeast) at the time were of the bergy bit to medium size iceberg variety. On several occasions during the spring, primarily in mid to late May, there were 20 to 40 icebergs to the northeast through to southeast, generally at a consistent 40 to 60 nautical mile range from the platform” (AGRA, 1998).
Annual Number of Icebergs Crossing 48oN (1946-2006) 430 63 523 47 45 7 8 15 56 312 61 80 931 1 689 258 114 121 25 369 76 0 441 230 53 85 73 1588 846 1387 100 151 22 75 152 24 63 188 1352 2202 1063 204 31 8 187 301 793 1974 876 1753 1765 1432 611 1011 1384 22 843 89 877 927 262 11 0 0 100 200 300 400 500 600 700 800 900 1000 1100 1200 1300 1400 1500 1600 1700 1800 1900 2000 2100 2200 2300 1946 1951 1956 1961 1966 1971 1976 1981 1986 1991 1996 2001 2006 Year N u m b e r o f I c eb er gs Cr os s ing 4 8 o N
Monthly Number of Icebergs Crossing 48oN (1946-2006) 0 30 60 90 120 150
Oct Nov Dec Jan Feb Mar Apr May Jun Jul Aug Sep
Mean Median
Figure 2.3 Monthly Number of Icebergs Crossing 48 o N (1946-2006) (Data from: IIP, 2005)
Iceberg Size
For general reference, iceberg shape and size classifications in common use are presented in Table 2.2 and Table 2.3. These sizes can be better appreciated by comparing the icebergs with a variety of well-known vessels as shown in Figure 2.4. Iceberg size statistics from two significant studies and databases are summarized in Table 2.1. These include the 1988 Terra Nova Design Criteria Study (Seaconsult, 1988) and the PERD Iceberg Sighting Database (BMT Fleet Technology, 2005, Verbit et al., 2006) where the more recent PERD table entry is from a query restricting data to the recent period 1987 to 2006, and the Grand Banks region south of 49 o N, and between 46 o and 53 o W, which equates to slightly over 600 observations for each of length, width, and height. For this recent entry, between about one quarter and one third of the values are measurements, the remaining being estimates. Table 2.1 Grand Banks Iceberg Length, Width and Height Statistics
Parameter Source Mean (m) Maximum (m)
On-shelf, Seaconsult (1988) 61 228 Off-shelf, Seaconsult (1988) 90 382 PERD (1960-99) 94 Waterline Length PERD (1987-06) 67 500 On-shelf, Seaconsult (1988) 41 137 Off-shelf, Seaconsult (1988) 61 250 PERD (1960-99) 60 Waterline Width PERD (1987-06) 41 300 On-shelf, Seaconsult (1988) 16 85 Off-shelf, Seaconsult (1988) 21 100 PERD (1960-99) 25 Above Water Height PERD (1987-06) 14 91
Table 2.2 International Ice Patrol Iceberg Shape Classification Codes. Iceberg Code IIP Code Comments Illustration
Tabular TAB Horizontal, flat-topped with length-height ratio of 5:1 or more.
Blocky BLK Steep precipitous side with almost horizontal top and with length-height ratio of 3:1 to 5:1.
Dome Spherical
DOM SPH
Large, smooth rounded top.
Dry Dock DDK Eroded such that large U-shape slot is formed with twin columns or pinnacles. Slot extends under the waterline or close to it.
Pinnacled PNC Large central spire or pyramid of one or more spires dominating shape. Less massive than dome-shaped iceberg of similar dimensions.
Wedge WDG A tabular iceberg which has altered its position of stability so that is now appears tilted, resembling a wedge.
Bergy Bit Growler
BBB GGG
Masses of glacial ice calved from an iceberg. The growler is smaller than a bergy bit which is, in turn, smaller than an iceberg
Table 2.3 Iceberg Size Classifications
Iceberg Type Code Mass (T) Height (m) Length (m)
Growler GG 500 < 1 m < 5 m
Bergy Bit BB 1,400 1 - 5 m 5 - 15 m
Small Berg SB 100,000 5 - 15 m 15 - 50 m
Medium Berg MB 750,000 15 - 50 m 50 – 100 m
Large Berg LB 5,000,000 50 - 100 m 100 - 200 m
.
Figure 2.4 Iceberg Size Comparisons.
GROWLER
Length Less than 5 m
DORY BERGY BIT Length 5 - 15 m SURVIVAL CRAFT LARGE ICEBERG Length 100 - 200 m HIBERNIA PLATFORM MEDIUM ICEBERG Length 50 - 100 m SUPPORT VESSEL SMALL ICEBERG Length 15 - 50 m LONG LINER
Iceberg draft can be estimated from its measured maximum waterline length using the following empirical relationship:
D = 3.781 L0.63
Where D = Draft (m)
L = Length (m)
For example, draft or keel depth of an iceberg of length 70 m (230 ft) would be on the order of 90 m (295 ft). This relationship is displayed graphically in Figure 2.5. The expected accuracy for draft estimates is ±25%. From PERD (1987-2006) the mean draft (measured or estimated) is 49 m and maximum is 185 m.
Figure 2.5
Iceberg Draft Estimation Graph
2.3 Regulatory Regime
The regulatory regime surrounding ice management was discussed in Crocker et al. (1999). Focus was primarily on the C-NOPB (now the C-NLOPB) regulations and Terra Nova Development Plan. Since then, significant developments have taken place in terms of the standards governing for offshore structures in ice environments and the White Rose project has now come onstream.
The C-NLOPB Physical Environmental guidelines specify the following with respect to ice management:
4.0 ICE MANAGEMENT GUIDELINES A. ICE MANAGEMENT PROGRAM
When operations are conducted in pack ice or areas of drifting icebergs or ice islands, an ice management plan will be implemented by the operator under the Contingency Planning Guidelines to ensure the safety of drilling or production operations. Since ice conditions can vary greatly from area to area, and season to season or year to year within an area, ice management plan should be tailored to the region, period, and nature of the operation. The plan should include systems for ice detection, surveillance, data reporting, collation, quality control and presentation and, where applicable, a local tactical ice forecasting component.
Iceberg/ice island and ice-hazard trajectory forecast service should reflect the operator's contingency plan specifications.
The frequency of ice-hazard1/iceberg forecasts should be commensurate with the level of threat as determined from the operator's Ice Alert Procedures. The operator should also arrange for regular verification of the ice-hazard/iceberg forecasts. In any case the verification methodology should be submitted to the Regulator for approval. B. ICE REPORT
Under the ice management plan, additional information above and beyond that collected under MANMAR is available. To satisfy the Regulator's safety and operational audit, East Coast Operators will report the following iceberg and/or sea ice information once daily (when applicable) to the Regulator:
• icebergs: time of observation, geographic position (latitude & longitude), type,
source of observation, and area surveyed; and
• sea ice: ice boundary, type, concentration, and area surveyed.
Operators are expected to maintain separate logs for ice and/or ice-hazard/iceberg data. Special reports will be made to the Regulator when dictated by significant events.
C. ADDITIONAL ICE DATA
A summary of ice information, including any ice forecast verification statistics, will be submitted to the Regulator (as appropriate) in a separate self-contained document as part of the Final Well Report. Data in acceptable data storage media accompanying the summary should be coded in the format provided in Appendix 1B.
The C-NLOPB also has requirements for the development of safety plans (C-NLOPB, 2002), which include the Ice Management Plan. Specific consideration is made for:
• “that all major hazards have been identified and the risks associated with them reduced
to ALARP”
• qualifications, competency and training of personnel
• changes to systems, procedures and equipment – that risk is not increased
• “procedures are in place to provide for effective weather forecasting, ice management” The Canadian standard for the design of offshore structures developed in 1992, CSA S471-92 ”General requirements, design criteria, the environment, and loads” (CSA, 19S471-92), contains the following provision for ice management:
4.11 Ice Management
Any ice management measures contemplated in order to conduct normal operational activities around the structure shall be documented. Where ice management measures are to be used to reduce global or local design ice loads, the reliability of the procedures shall be consistent with the intended safety class for the structure or for the particular structural element.
In 2004, the CSA tandard was revised with respect to ice management provisions. The Canadian standard S471-04 ”General requirements, design criteria, the environment, and loads” (CSA, 2004) for the design of offshore structures now states the following:
4.11 Ice management
Operational procedures may be used to reduce global or local ice design loads, provided that it can be shown that, in combination with structural resistance, the intended level of safety is achieved.
The following points shall be considered:
(a) Operational procedures may include such activities as ice event detection, physical ice management,
disconnection of the structure, moving the structure off station, evacuation of personnel, shut-in of production, or other techniques that reduce the frequency or severity of ice impact or the consequences for personnel or the environment.
(b) A reliability analysis which demonstrates that the target reliability has been achieved shall be undertaken. The approach used shall be founded on documented experience whenever possible and shall reflect the uncertainty inherent in the input data and modelling techniques. The load factors presented in Table 6.3 shall be demonstrated to be adequate or shall be adjusted in order to achieve the required reliability.
(c) Procedures shall be well documented. Operations in accordance with such written procedures shall be undertaken throughout the operating life of the structure.
These provisions represent a significant enhancement to those in the original S471-92 (CSA, 1992) document. More emphasis is now placed on the need for systems and procedures for which documented evidence of success is available.
A new international standard ISO 19906, Petroleum and natural gas industries — Arctic
offshore structures is now being developed and is scheduled to be completed in late 2009.
This standard will also deal specifically with ice management considerations at the insistence of Canadians involved at the working group and technical panel levels. In a recent paper outlining the development process for floaters provisions in the 19906 standard (Makrygiannis et al., 2006), specific references are made to ice management.
“Active intervention through ice management (detection, towing, icebreaking, ice clearing etc.) may be used to alter interaction scenarios within the framework of a systematic ice alert procedure. Ice avoidance through seasonal operation, disconnection or displacement of installation may also be used to alter the interaction scenarios associated with ice actions.”
The scope of ice management activities is also seen in Figure 2.6, taken from Makrygiannis et al. (2006). Basically, ice management activities cannot be divorced from ice monitoring,
forecasting and the continuous assessment of ice risks. The ISO 19906 standard will also deal with the requirement for an ice management plan, which is a new development in offshore standards, although not in terms of Canadian regulations.
Figure 2.6 Relationship between the various factors for floater operations in ice environments (from Makrygiannis et al., 2006)
2.4 Critical Factors in Ice Management
This section presents a discussion of some of the generally accepted elements and considerations of ice management. In practice these are addressed through preparation of an Ice Management Program which shall describe:
• ice detection, • surveillance, • data collection, Ice Monitoring, Detection & Forecasting Potentially Adverse Ice Ice Management (increased over routine levels) Routine Operations from
Floating Installation
Ice Alert System & Predefined Operational Response Adverse Ice Situation Eliminated yes Increased Levels of Ice Monitoring & Forecasting no Increasing Levels of Alert & Ice Management
Preparations to Shut Down Operations, Disconnect & Move Off Location
Move Off Location Until Adverse Ice
Situation Improves, Then
Return to Site Imminent Ice Related Risk
• reporting, • forecasting,
• response, roles and responsibility, and decision-making; and • avoidance or deflection.
Ice Management Plan
The Operator shall prepare and implement an ice management plan appropriate for the planned operations. Since ice conditions can vary greatly from area to area, and season-to-season, or year-to-year within an area, the ice management plan should be tailored to the region, period, and nature of the operation. For example, ice management is generally of particular importance for operations on the Grand Banks or West Greenland where ice severity can be high.
The ice management plan should be simple, functional, and provide guidance and a plan for action. The plan should address to some appropriate level of detail, the following critical factors:
Operations Plan and Operating Environment
• Operations details including any or all of: rig type, mode of station keeping, drilling season, well duration, re-supply plans, crew transport plans, etc.
• Description of physical environment conditions including sea ice, icebergs, marine climatology, physical oceanography, etc. The essential elements to describe are historical sea ice and iceberg conditions.
Ice Management Principles, Strategy, Approach
• corporate attitude towards ice management and toward risk acceptance • strategy objectives should be defined, e.g.
1- protection of crew and unit,
2- allow operations with a minimum of disruption or added expense due to an ice situation.
• approach should be defined, e.g.
1- iceberg monitoring (surveillance + observations + tracking + forecasts) 2- ice alertness with zone definitions to determine response
3- ice response: physical management such as towing and/or deflection; disconnect and departure from wellsite.
Regional Strategic Surveillance • seasonal outlook • zone of interest • opportunistic surveillance • dedicated surveillance • remotely-sensed surveillance • frequency of surveillance • detectability/target verification • time applicability
Given the Study Area proximity there may be synergies and opportunities in conjunction with CIS aerial reconaissance in other areas such as the Gulf of St. Lawrence or coastal Labrador. Both aerial and remotely sensed (e.g., RADARSAT) technologies are in routine use for the CIS ice monitoring and ice chart preparation activities and generally provide excellent surveillance coverage.
Local Tactical Surveillance and Observation • aerial surveillance • vessel-based surveillance • rig-based surveillance • detection • ancillary information • continuity • roles/responsibilities
If drilling is occurring during the ice season, the required level of ice observing could likely be performed by the rig or platform weather observer or other designate, i.e., it is unlikely specific ice management personnel would be required offshore.
Reporting and Information Management • reporting/recording tools • level of automation • quality control • communications • information dissemination • data sharing Determination of Risk
• incident command and control • roles and responsibilities
• tactical ice forecasting
• definition of ice management response zones Response
• safety considerations
• interaction with drilling operation • roles and responsibilities • physical ice management Joint Ice Management
As part of ice management planning, Grand Banks Operators presently utilize a synergy with each other and the ice service groups regarding joint ice management. Practical benefits include the areas of surveillance and detection, observation, iceberg tracking, data sharing, tactical support, ice forecasting and trajectory modelling, and physical
management. Challenges do exist. A multi-installation management system is in place, involving multiple ice vessels and sensors for iceberg detection. Tankers are a consideration as well. Ice operations are centered from a single platform. Supply vessels involved in iceberg management activities managed by different operators. While ice management resources are shared, priorities of each installation are not always the same. Complete ice information is not always available to individual vessels.
Ice Reports
As part of, or in addition to, the reporting defined in the Ice Management Plan, the Operator shall report coded ice and iceberg messages and all relevant ice observation, reconnaissance, monitoring, and deflection reports to the Regulator in the event that ice enters the Installation's ice alert/response zones or in the event that the Operator undertakes an aerial reconnaissance for their area of interest. In these instances, daily reports to the Regulator as a minimum are required. Special reports shall be made to the Regulator when dictated by any significant events.
2.5 Ice Season Reports
Essential to ice management is the documentation of the iceberg conditions encountered and operations activities undertaken. Key outcomes include an annual ice season report and associated digital archives of the data. Regular updates for the PERD Iceberg Sighting and Iceberg Management databases follow as well. Figure 2.7 shows an example ice season report table of contents from Provincial Airlines Limited (PAL) illustrating the wealth of information generally provided in these compilations. The reports present a full history of all icebergs tracked and towed.
Figure 2.8 illustrates a daily iceberg plot from an AMEC end of year report, showing a tabular summary of each icebergs position and track together with a plot of all iceberg positions, including any towing activity.
2.6 Iceberg Detection
As outlined above in Section 2.3 strategic and tactical iceberg information comes from many different platforms and sensors, each with different characteristics and potential sources of error. Aerial and satellite based systems provide maps or snapshots of iceberg positions, while rig or platform observations generally provide continuous tracking. The data from all of the systems need to be combined in a rational and seamless fashion. Iceberg detection therefore involves not only the sensors themselves, but the systems and procedures used to integrate them. Further discussion is provided in Section 3.7.
The consequences associated with unaccounted icebergs “slipping through the cracks” in the management system and approaching a platform are potentially very serious. Considerable effort has gone into systems for forecasting iceberg positions, the management of iceberg position and track data. Great strides have been made in this area for the Grand Banks over the last 10 years since Hibernia went on stream, and now Terra Nova and White Rose.
As a practical recognition of the key challenges when developing an effective ice management system, McKenna et al. (2003) modelled the main issues for iceberg management: detection, towing, and disconnection in a risk reduction framework. Their
strategy model shows that risks for offshore installations can be reduced by nearly an order of magnitude through effective detection and towing operations, and a further order of magnitude improvement through introduction of a disconnection capability for the installation. As noted, a significant challenge is integration of iceberg detection for a range of sensors/systems to provide the desired seamless detection for the expected size of icebergs and environmental conditions to be encountered.
2.7 Iceberg Towing and Deflection
2.7.1 Single Vessel Iceberg Towing Procedure
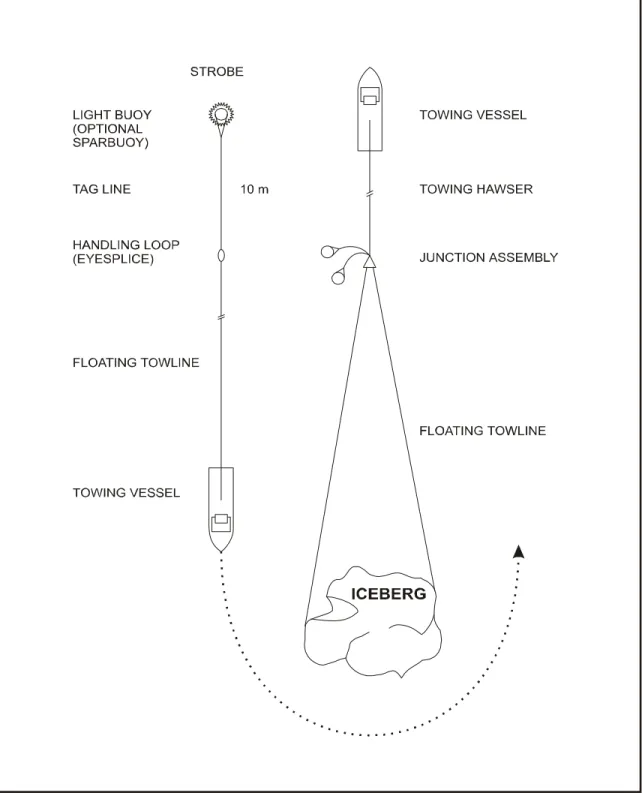
The standard method for deflecting an iceberg posing a threat to offshore facilities has been to encircle the berg with a heavy floating rope which can act as a bridle from which the berg may be towed by an offshore supply vessel. For larger icebergs, the objective is to deflect the ice mass by a few degrees from its naturally preferred route.
Towing requires a supply vessel with minimum 70-140 tonnes bollard pull, towing winch, 100-400 m steel towing hawser, 1200 m synthetic floating line or rope. The rope commonly used is braided polypropylene, 4-1/2" in diameter, generally used in two to three sections each 400 to 500 m in length. The encircling and hookup procedure shown in Figure 2.9 is as follows:
Icebergs with masses up to 4 million tonnes have been towed successfully: most effective for masses in the 1000 to 100,000 tonnes. The technique has good reliability for medium to large icebergs but is ineffective for small ice. It is safe, with small incremental cost, and usually practical in seas to significant wave height of about 4 m
Iceberg Towing Procedure
1. Secure a towing shackle to the eye of the steel towing hawser while the eye is secured at the stern of the tow vessel work deck.
2. Secure one end of the (polypropylene) tow rope to the towing shackle now attached to the tow hawser using a second shackle.
3. Secure a "light" buoy or plastic Norwegian fishing float as a tail buoy to the free end of the tow rope using 10 m of 3/4" tag line. A sea anchor may also be attached to the free end of the tow rope to increase drag.
4. The tow rope (with "light" buoy and/or sea anchor) is paid out over the stern roller as the vessel approaches the iceberg on a heading opposite to the desired final tow heading. The length to tow rope selected (number of 400 m sections) is based on berg size and the conditions in which the tail buoy will have to be recovered
5. Secure tow rope to stern quarter to minimize risk of the tow rope fouling the propeller. 6. With tow rope streaming astern and the inboard end attached to the towing hawser, the
vessel circles the berg.
7. A lookout should be posted to watch the tail end of the tow rope at all times to ensure that it does not become fouled with the ship's propellers.
8. Approach the tail end of the rope from the down wind side and retrieve the tag line using grappling hook. Retrieve the tow rope with a tugger line and secure the tow rope tail end eye to the 85 tonne shackle already attached to the towing hawser.
9. With the polypropylene tow rope forming a bridle around the berg, a minimum of 100 m of steel towing hawser can then be paid out over the stern roller. This will serve several purposes:
• The line of the tow force will be brought closer to the iceberg's centre of buoyancy, thereby reducing the overturning moment.
• With the steel hawser in the water, the recoil action will be damped in the event the rope should suddenly slip or break free from the berg.
• The towing hawser serves as a shock absorber to compensate for surges in tension in the line due to sea state and vessel motion during towing.
When the towing hawser is deployed and the towing winch brake set, tension is applied and the tow commences.
If the iceberg does not have a good waterline groove to seat the tow rope, or the iceberg is unstable, 200 to 300 m of tow hawser can be used with low power so that the catenary caused by the weight of the steel hawser gives the rope a more downward pull on the iceberg. The technique involves paying out steel towing hawser in sufficient quantity to create a pronounced catenary in the line to bring the line of action of the tow force closer to the centres of hydrodynamic drag and gravity of the iceberg. This reduces the rolling moment of the iceberg from a given tow force as illustrated in Figure 2.14.
Should the berg roll towards the ship or should the rope slip over the top of the berg, the ship’s power should be reduced to reduce towing tension and, therefore, potential backlash from the towing hawser. This action should also reduce the chances of the tow rope tangling as tension is taken off the line.
Another option established to deal with slippery, unstable, or otherwise problematic icebergs, following development, sea trials, and operational use and success is the C-CORE iceberg net described in Section 4.3.
If the rope is secured in a waterline groove, power should be increased gradually. During this stage, the berg should be observed carefully for any indication of rolling. The overturning moment applied by the towing hawser may cause the berg to roll towards the ship until the icebergs own inherent stability overcomes the applied overturning turning moment. If rolling of the iceberg is observed, it is important to reduce power and leave enough slack in the hawser to allow for the gyration of the berg. Once the berg is safely under tow, the vessel can be turned slowly onto the appropriate course.
When the towing operation is completed, the tow rope is retrieved as follows: Rope Retrieval Procedure
1. Reduce power to minimum steerage way and heave in the towing hawser until the shackled connections to the polypropylene tow rope are on deck.
2. Release one end of the tow rope and continue steaming ahead until the rope slips around the berg and is streamed out in a straight line astern and the vessel is on a comfortable course.
3. Transfer the end of the tow rope to a storage drum or cathead and commence retrieval.
4.
Maintain steerage and ship's heading during recovery to keep the tow line clear of the ship's propellers.Smaller ice pieces are often rounded or domed with no waterline groove in which to attach a tow rope. The rope sometimes slips over the ice prior to completion of hook-up. High sea states tend to worsen this situation and contribute to increased safety risk to vessel crew members working on deck.
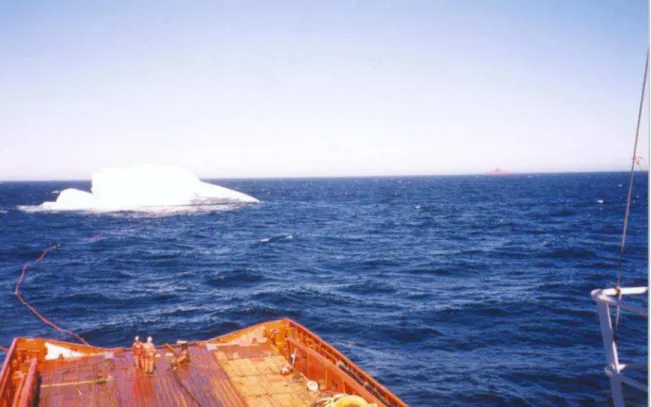
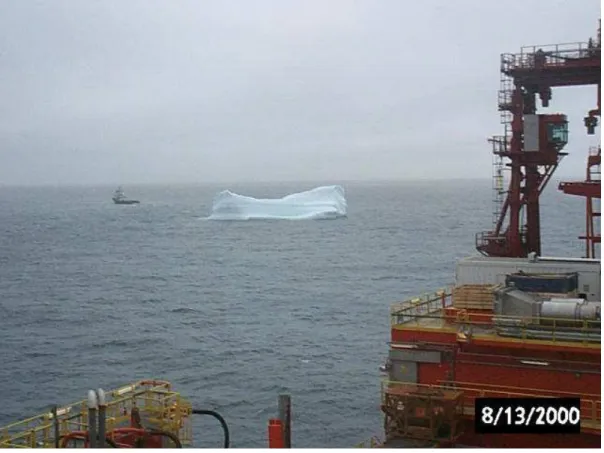
Iceberg Towing is illustrated in Figure 2.10 and Figure 2.11 and also in the pair of pictures Figure 2.123 and Figure 2.13 all from the West Greenland ice management (AMEC, 2002a).
3 “Week 6, 14 Aug Icebergs F157,174,176,179,184 towed H. Charisma has difficulty with problem berg F170. It takes three attempts and straightening out of fouled towed gear to bring F170 under control, but F170 comes within 1/3 nm of the West Navion, safely under tow."
Figure 2.10 Retrieving the Tow Line, West Navion in Distance
Figure 2.12 Havila Charisma Towing Iceberg F170 as Seen From the West Navion
High Sea State Deployment of Iceberg Towing Equipment
An additional technique can be used with single vessel towing operations for deploying tow ropes in higher sea conditions. The process is illustrated in Figure 2.15. During periods of high wind and sea state, the vessel always heads into the wind when approaching the iceberg to be towed regardless of the desired eventual tow heading. This minimizes the time that the vessel must be broadside to the sea during deployment. In addition, it ensures that the trailing end of the tow rope is drifting with the wind, away from the ice mass and not toward it. In poor visibility conditions it is easier to predict where the trailing end of the tow rope will be during recovery. The desired tow heading is eventually assumed after successive, gradual course changes.
Figure 2.14 Use of Towing Catenary to Reduce Overturning Moment of Unstable Icebergs
DIRECTION OF VESSEL ICEBERG
FLOATING
TOWLINE MONKEY FACE PLATE
Figure 2.15 High Sea State Deployment of Towing Equipment
VESSEL APPROACH PATH LEE SIDE
PROTECTED ZONE
TOW HEADING REQUIRED WIND
DIRECTION
TOWING VESSEL
2.7.2 Dual Vessel Towing
Towing is conducted with two vessels to deflect larger or unstable ice masses. The approach requires two vessels, a single wire rope, and one steel hawser for each vessel. The approach is practical and can produce a significantly greater tow force; however, there can be difficulties in having a balanced vessel thrust, a tendency to see-saw around the iceberg while towing, and difficulty in maintaining depth control over the tow wire.
The PERD IMDB (Section 4.2) reports the technique has been tried 25 times on 13 icebergs over about 10 ice programs. About half the time the lines slipped with two suitable outcomes although in the other cases the evaluation was poor, but operations were unaffected. The method is not suitable for smaller icebergs with lengths less than 60 m and is generally safe. There is significant added cost with the requirement to engage two vessels. As with a single-line tow, there is a limiting sea state of about 4 m and visibility must be good.
2.7.3 Water Cannon
For completeness, the standard deflection techniques for small icebergs, bergy bits, and growlers too small to be towed with the conventional floating towline, water cannon and prop-washing, are described
Water cannon are actually fire monitors or nozzles mounted on the superstructure of the support vessels which can direct a high pressure stream of sea water to deflect small ice masses. While their primary function is fire fighting, tests and experience have proven them highly effective in managing small ice masses up to 40,000 tonnes, which might not be towable. The approach requires a supply vessel with high capacity water cannon (e.g., volumes as large as 3600 m3/h, ejected through the cannon nozzle at speed of 54 m/s, yields pushing force of five tonnes) and a high-powered hydraulic control system with vessel motion compensation. Cannons are best mounted on the bow, close to target and thereby reducing vessel icing potential during operations.
Water cannon can be useful in iceberg management in three ways:
The impact of the mass of water on the iceberg can directly move the iceberg. The steam of water hitting the sea surface can also induce a current which will
help to move the ice mass.
The impact of the stream on the berg will help to break up and melt the ice. This may have the benefit of “roughening’ a smooth iceberg to facilitate a tow.
Small icebergs can be moved by water cannon in any direction at a speed of up to 2 knots while larger bergs can be induced to change direction by as much as 40o from their natural course without increasing their speed.
For ice management purposes, the stream of water from one or more water cannon are directed directly at the visible ice mass above the water line on the opposite side from the direction in which one wishes it to be moved. The thrust generated by the water cannon can create a reactive force in the vessel in the opposite direction which can move the vessel away from the target at up to three knots. This reactive force must be compensated by the vessel’s drive and stabilization system and for this reason, the target is generally positioned
directly in front of the bow. Different nozzles can be used on the water cannon to improve the power of the stream or to increase the cutting effect on the ice.
The use of water cannon for ice management is depicted in Figure 2.16.
The use of this technique is limited in freezing spray conditions as blow back from the water streams may result in severe icing on the vessel’s metal surfaces. Its use may also be ineffectual in rough seas because of the inability to keep the water stream focussed on the target. Safe and effective operations have been achieved in 7 m combined seas and 30 knot winds. The incremental cost for can be small if part of firefighting water cannon hardware although fuel consumption can be high, on the order of 500 L/h.
Figure 2.16
Water Cannon
DIRECTION OF DRIFT / PUSHING
GROWLER WATER CANNON
2.7.4 Propeller (“Prop”) Washing
Propeller washing can be a generally successful technique for small ice mass deflection, typically used when a bergy bit or growler is close to facilities and its drift path can be accurately predicted. The tow vessel repeatedly backs up to the piece of ice and accelerates away, thus moving the ice in the desired direction with the backwards thrust of the water from the propellers. This technique is illustrated in Figure 2.17.
This method is really only effective when problem bergy bits and growlers are very close to the facilities since long range deflection (greater than 1 n.mi.) may require many hours of prop-washing. Extended prop-washing tends to be a very arduous task for the vessel master, as well as resulting in high fuel consumption and excessive wear on vessel machinery.
This technique requires skilled vessel handling and vessel contact with the ice must be avoided, which can be difficult in high seas. As well, high sea states tend to reduce the effect of the vessels wake quickly, thereby reducing the effectiveness of this method.
The presence of any sea ice could also be a limiting factor. Cost considerations include fuel consumption and machine wear.
Figure 2.17
Propeller Washing
DIRECTION OF WATER FROM PROPELLERS DIRECTION OF ICE MOVEMENT DIRECTION OF VESSEL1. VESSEL BACKS UP SLOWLY TO GROWLER OR BERGY BIT
2. VESSEL ACCELERATES AWAY, CREATING A WAKE TO PUSH ICE MASS IN OPPOSITE DIRECTION
3.0 ICEBERG DETECTION RESEARCH 3.1 Overview
3.1.1 Range of Potential Platforms and Sensors
A number of actual and potential iceberg detection systems are shown in Table 3.1. Those labeled “Possible” are not necessarily feasible. What this table illustrates is a great potential for innovative systems should the need arise.
Visual iceberg detection, whether from offshore facilities, supply vessels or aircraft, is always best but is severely limited by fog. Consequently, there is a heavy reliance on radar systems for iceberg detection regardless of the platform. Locally at Grand Banks facilities, detection is either visual or by marine radar. Regionally, it is done by aircraft, supply vessels and satellites, and further afield using aircraft or satellite.
Table 3.1 Detection Systems and Supporting Platforms PLATFORM SENSOR Ice Management or Supply Vessel Production or Drilling Facility AUV Moored u/w platform Fixed Wing
Aircraft UAV Helicopter Satellite
visual X X X X marine radar X X SAR X O X search radar X O infra red O O O O O optical sensor O O O O O X sonar O O
NOTES: X Existing System O Possible System UAV Unmanned Aerial Vehicle AUV Autonomous Underwater Vehicle SAR Synthetic Aperture Radar
3.1.2 Strategic Issues
For Grand Banks offshore operations, strategic detection is imperative for establishing a state of readiness for the initial arrival of icebergs each spring and routinely for the timely deployment of ice management vessels. Key considerations for Grand Banks operations include:
• the most southerly progression of any icebergs • average numbers and locations of icebergs
• the presence of very large icebergs, tabular and otherwise
Prior to the start of the season, a wide area extending up the Labrador coast is often surveyed. Exact positions and iceberg dimensions may not be necessary unless very large icebergs are sighted. Once icebergs are present on and around the Grand Banks, icebergs that could potentially feed into the tactical zone need to be monitored. While precise locations may not be required, the need for positive identification of icebergs is increased.
Unexpected icebergs slipping into the tactical zone are of considerable concern. So are false identifications, because they involve needless effort and expense, and can potentially lead to decreased preparedness.
3.1.3 Tactical Issues
The distinction between tactical and strategic zones is not clear cut. For single installations, ice management vessels are deployed to prevent the entry of icebergs into a critical zone, defined by the time required for the installation to shut down. The size of the tactical zone therefore depends on expected iceberg drift velocities and the time to manage the icebergs. For drilling operations, shutdown times are often about a day. For production, orderly FPSO shutdown can be performed in a couple of hours and emergency shutdown in less than an hour. Iceberg towing operations average less than 10 hours. A rough guide for the radius of the tactical zone would then be about 20 km for an iceberg drift speed of 0.5 m/s. With finite vessel resources, the tactical zone would need to increase with increasing numbers of icebergs present. For multiple installations, tactical zones can overlap or come in close proximity so the tactical zones may need to encompass a larger area.
Tactical components include: • detection
• tracking
• threat evaluation
For threat evaluation, the size, position and drift speed of an iceberg need to be estimated with some accuracy. The maximum waterline dimension or mass (based on above water volume) can be used as measures of iceberg size.
In the tactical zone, detection requirements are quite stringent. All icebergs need to be detected and tracked on a near continuous basis, whether remotely or from the production facility or supply vessels. Furthermore, icebergs need to be detected at night, in fog and under high wind conditions. With the potential for calving, regular observations need to be made since forecasts and projections will be inadequate in such cases.
Ideally, all icebergs should be detected, although it may be difficult to detect growlers and bergy bits except in the immediate vicinity of the facility. A good guide for the minimum detection limit is the size of iceberg that can make contact with the structure without causing damage. For FPSOs, bergy bits may not cause significant damage unless drift speeds are high or impact speeds are increased through wave action. Bergy bits should not cause damage to a fixed structure.
In recent years, circumstances have arisen where storm conditions have reduced aircraft surveillance capabilities, prevented management operations from being carried out, made satellite iceberg detection difficult and resulted in downtime for drilling operations. Detection issues have contributed to these events. While all efforts have been made to prevent recurrence, there is still room for improvement through research. A couple of these – iceberg detection in high winds and sea states, and iceberg detection in pack ice – are dealt with in this chapter.
3.1.4 Radar Bands
Because of its weather penetration, radar is an element of most iceberg detection systems. The various radar bands are shown in Table 3.2. The lower frequency bands, L and S, have lower resolution but better all weather capabilities. X band, because of the shorter wavelength. provides more detail but has less snow, rain and fog penetration. Most marine radars are X and S band. C band is used for RADARSAT-1, RADARSAT-2 and Envisat, and provides a good compromise.
Table 3.2 Radar Bands
Band Wavelength (cm) Frequency (GHz)
L 15-30 1-2 S 8-15 2-4 C 4-8 4-8
X 2.5-4 8-12
3.2 Airborne Systems
Presently, most of the strategic and tactical iceberg detection for Grand Banks operations is performed by PAL Environmental Services from fixed wing aircraft. The same system has been used extensively for regional iceberg surveys for the CIS, fisheries patrol and a number of other surveillance activities. The primary sensor is an X-band search radar, supported by visual observations and thermal imaging. Complete geographic coverage is provided through overlapping flight patterns, and the redundancy helps to improve detection capability. Radar cross section data have been correlated with iceberg size and detection has been optimized through many years of experience.
Detection capability is less due to the sensors themselves, but on the availability of the aircraft. The flexibility of the aircraft to refly certain areas, change altitude and provide visual confirmation can make up for deficiencies in the sensors.
3.3 Satellite Systems
3.3.1 Background
Because of cloud and fog penetration requirements, the only feasible satellite based sensor is radar. Optical sensors, although offering better resolution are ineffective for a very significant proportion of the time on the Grand Banks. Satellite radar is the sensor of choice for sea ice observations worldwide and is slowly gaining acceptance for iceberg detection. Since 1998, considerable research has been conducted on satellite detection of icebergs, the bulk of which has been led by C-CORE. This has been done under the ADR0-1 and ADRO-2 programs for the ESA and CIS (Randell et al. 1999, 2000), under the integrated ice management initiative (IIMI) joint industry program (C-CORE 2001a, 2002, 2003a, 2004a, 2005a), and under several other projects. A summary is provided in Table 3.3.