Supplementary note and figures for “Migration rather than
1proliferation transcriptomic signatures are strongly associated with
2breast cancer patient survival”
34
Nishanth Ulhas Nair1,2,#, Avinash Das3,4,#, Vasiliki-Maria Rogkoti5, Michiel Fokkelman5, Richard 5
Marcotte6,7, Chiaro G. de Jong5, Esmee Koedoot5, Joo Sang Lee1,2, Isaac Meilijson8, Sridhar
6
Hannenhalli1, Benjamin G. Neel6,9,10, Bob van de Water5, Sylvia E. Le Dévédec5, Eytan
7
Ruppin1,2,11,12,* 8
9
1 – Center for Bioinformatics and Computational Biology, University of Maryland, College Park, Maryland 20742, 10
USA. 11
2 – Cancer Data Science Lab, National Cancer Institute (NCI), National Institutes of Health (NIH), Bethesda, USA. 12
3 – Department of Biostatistics and Computational Biology, Harvard School of Public Health, Boston, USA. 13
4 – Massachusetts General Hospital Cancer Center, Harvard Medical School, Boston, USA. 14
5 – Division of Drug Discovery and Safety, LACDR, Leiden University, Leiden, the Netherlands. 15
6 – Princess Margaret Cancer Centre, University Health Network, Toronto, ON M5G 1L7, Canada. 16
7 – National Research Council Canada, Montreal, Canada. 17
8 – Department of Statistics and Operations Research, School of Mathematical Sciences, Tel Aviv University, Tel 18
Aviv 69978, Israel. 19
9 – Laura and Isaac Perlmutter Cancer Centre, NYU-Langone Medical Center, NY 10016, USA. 20
10 – Alexandria Center for Life Science, New York, NY 10016, USA. 21
11 – The Blavatnik School of Computer Science, Tel Aviv University, Tel Aviv 69978, Israel. 22
12 – Lead Contact 23
# – contributed equally. 24
* – corresponding author email: [email protected] 25
Current affiliations – NUN, JSL is (2); ER is (2,11); RM is (7); BGN is (9,10). 26 27
Supplementary Note
28 29 CellToClinic Predictors 30CellToPhenotype predictors consists of two expressions based supervised regression – one for 31
predicting cell migration and other for predicting cell proliferation. Each predictor was trained on 32
in vitro cell migration or proliferation as the dependent variable and gene expression of cell lines
33
as the independent variables in the regression. The gene expression data was obtained from the 34
Cancer Cell Line Encyclopedia project1. Gene expression data was transformed to a standard 35
normal distribution across genes and samples. 36
37
CellToPhenotype adopts two level feature selections to reduce testing error. First, 2448 genes that 38
are significantly associated (FDR<0.01 using Cox regression) with patient survival (in an 39
independent dataset – METABRIC). The “survival” package in R was used2 to determine the
40
association. Second, CellToPhenotype uses LASSO (least absolute shrinkage and selection 41
operator) regressor to regularize the predictor that enables a data-driven feature selection using a 42
cross-validation. A five-fold cross validation procedure to compute the minimum λ value for 43
LASSO. The “glmnet” package in R was used to perform regression3. To increase the 44
generalizability of predictors, the LASSO regression selects only subset of genes as the gene 45
signatures of the CellToPhenotype predictors (L1-norm regularization). That is, LASSO selects 46
only a small number of the 2448 genes (during each iteration of LASSO) for constructing the final 47
predictor. Note, both feature selection steps were conducted in dataset independent of the testing 48
set on which performance of CellToPhenotye was evaluated. This ensures an unbiased evaluation 49
of predictive power of CellToPhenotype. 50
51
Applying the predictor learned above to the gene expression of breast cancer tumor samples, we 52
can predict migratory and proliferation level for each sample/individual. To obtain a robust 53
estimate of levels, we iterate this procedure 50 times and take the median value of the migration 54
and proliferation levels as the final estimates. (For each iteration, LASSO chooses a few genes for 55
model training. The frequency value mentioned next to each gene in Tables S3(a-d) is the number 56
of times a gene has been selected for model training.) 57
58
We explain LASSO regression method in more detail below: 59
60
Linear regression is a linear approach to model a relationship between a dependent variable and 61
one or more independent variables4. LASSO is a shrinkage and selection method for linear 62
regression5. LASSO was introduced to avoid overfitting by selecting only a subset of the provided 63
covariates in the final model rather than using all of them. It performs both variable selection and 64
regularization in order to improve prediction accuracy. Regularization is a form of regression 65
which shrinks the coefficients of the independent variables to zero and avoids overfitting. LASSO 66
uses an L1-regularization technique, which adds an absolute value of coefficient as penalty term 67
to the loss function. The object of LASSO to minimize the following function: 68 69 70 71 72 73
where y is the dependent variable, x is the independent variable, is the coefficient of regression 74
(with constraint j s), and is the tuning parameter. Some of the s are shrunk to zero due to
75
the regression. 76
77
One disadvantage of L1-regularization is that it cannot help with multicollinearity. However, that 78
is not a concern in our case the data we work with does not suffer from a multi-collinearity 79 problem. 80 81 Multi-collinearity check 82
We use a LASSO-based regression (along with cross validation) and LASSO can handle co-83
variance among features6,7. In fact, it has been experimentally shown that cross validation plus 84
LASSO (with much of supporting theory) works well with co-varying features. However, LASSO 85
suffers from a multi-collinearity problem. Here we show that our data do not suffer from 86
multicollinearity. When input features are multi-collinear, in essence, LASSO can arbitrarily select 87
one of the collinear features. To test for multi-collinearity in the model training data, we computed 88
the Variance Inflation Factor (VIF) in the training data. If VIF values are greater than 10, then the 89
data may have multi-collinearity issues8. We got VIF values ranging from 1.2 to 4.06 (median = 90
1.43), thereby showing that our data does not suffer from multicollinearity. 91
92
In the case of covariance between variables in linear regression, the estimated coefficient from the 93
linear model would have high variance but final predicted values of phenotype are not affected by 94
this. To explicitly show this, we now conduct robustness analysis of the LASSO-based predictor. 95
The LASSO based predictors give consistent results over multiple iterations, showing that the 96
LASSO based predictions give quite consistent results irrespective of any covariance among 97
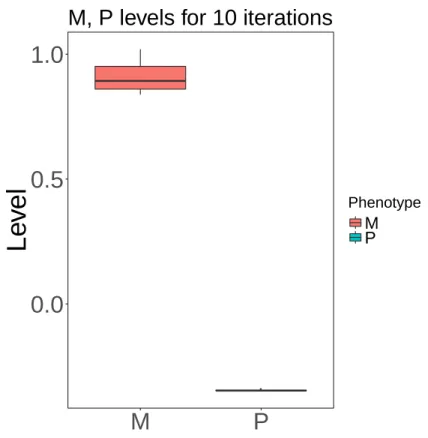
features. Figure S5 shows the consistency of the predicted migration and proliferation values for 98
one patient in the TCGA data (run for 10 iterations).
99 100
Estimating effect of migration and proliferation on survival
101
The effect of migration and proliferation levels (models built using 40 common breast cancer cell 102
lines) on patient survival was estimated 1043 breast cancer patients TCGA data as follows. To 103
check the association of the predicted migration with patients’ survival we fit following Cox 104
regression: 105
Survival ~ migration + strata(race) + age + GII 106
107
Patient survival is known to be confounded by age, race, and genomic instability. Including these 108
factors in our Cox regression model, we systematically control for their confounding effect on 109
survival. Genomic instability index (GII) measures the relative amplification or deletion of genes 110
in a tumor based on the somatic copy number alteration (SCNA). Let 𝑝𝑖 be the absolute of log ratio 111
of SCNA of gene i in a sample relative to normal control, GII of the sample is9: 112 𝐺𝐼𝐼 = 1/𝑁 ∑ 𝐼(𝑝𝑖 > 1) 𝑁 1 113
where “I” is the indicator function. 114
Strata (race) in the above model implies Cox regression was conducted in each patient 115
stratification based on race separately and likelihood were combined. We repeated the procedure 116
for 10 iterations, and median coefficients (risk factor) of migration were computed. The association 117
of survival with proliferation was estimated similarly. 118
To estimate the relative contribution of migration and proliferation to predict patient survival we 119
fit following Cox regression, which also controls for age, race, and genomic instability: 120
Survival ~ migration + proliferation + strata(race) + age + GII 121
122
We used the “lrt” function in R to do likelihood ratio test between two Cox regression models. 123
124
Each Kaplan Myer (KM) analysis was done by comparing the migration/proliferation levels of on 125
the top 25 percentile of patients with bottom 25 percentile patients (Figure 3b). 126
127
Control experiments
128
Since we used survival genes as features, we wanted to check if the results we obtain (Figures 2, 129
3) is purely because of this, and if the LASSO regression (in the CellToPhenotype predictors) 130
holds any value. So as a control experiment, we trained migration and proliferation based models 131
using LASSO regression as before (using 2448 genes associated with survival). Then we randomly 132
shuffled these survival-significant genes and their regression coefficients while predicting 133
migration and proliferation levels. This is basically the same as taking a random linear combination 134
of the gene expression of the survival-significant genes to predict migration and proliferation 135
levels. This was done for 20 iterations. We predict migration and proliferation levels for each 136
iteration. The results of the control experiments for various phenotypes are given below. 137
138
Paired Wilcoxon rank-sum test between 110 tumors and matched normal samples for both the 139
predicted migration and proliferation did not show any significant difference (P<0.6 and P<0.47 140
respectively). Mean p-value between the two groups over various iterations is shown in brackets. 141
142
We did not find any significant increase in predicted migration levels from stage I and stage II 143
(Wilcoxon rank sum test, P<0.45); and from stage II to stage III-IV (P<0.45). Predicted 144
proliferation levels also did not increase from stage I to stage II (P<0.41) and stage I to stage III-145
IV (P<0.39). 146
147
We see that predicted migration levels did not increase from grade 1 to grade 2 (Wilcoxon rank-148
sum, P<0.41), and from grade 2 to grade 3 (P<0.33), and proliferation levels did not increase from 149
grade 1 to grade 2 (P<0.36), and from grade 2 to grade 3 (P<0.36). 150
We do not find any significant association of predicted migration levels with patient survival (risk 152
factor = 0.067, P<0.24) or between proliferation and survival (risk factor = -0.0021, P<0.24). Mean 153
value of the risk factor over various iterations is shown. 154
155
These results show that the results that we obtain (Figures 2, 3) are not only due to the feature 156
selection, as the random linear combination of the expression of these selected genes to predict 157
migration and proliferation levels do not yield good results. 158
159
Survival analysis
160
When we repeated the survival analysis in TCGA data by randomly sampling 30 cell lines (iterated 161
10 times, each time there is a random sampling), we did not see any survival prediction capability 162
for both migration and proliferation. 163
164
Correlations
165
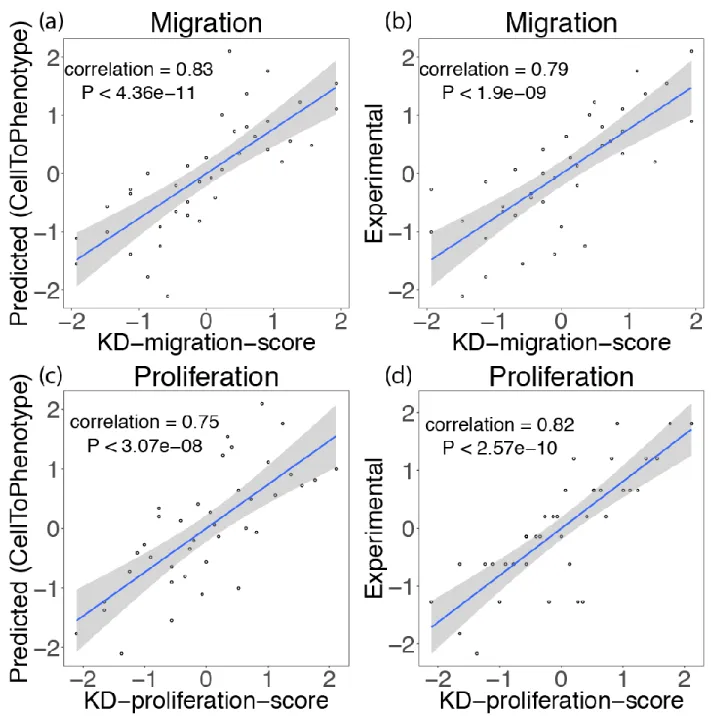
Spearman correlations between KD-migration-score and predicted migration levels 166
(CellToPhenotype) and experimentally measured migration values are given in Figure S1. Similar 167
analyses were conducted for proliferation (Figure S1). KD-migration-score has a high correlation 168
with the predicted migration levels (Spearman ρ = 0.83, P<4.36e-11, Figure S1a) and 169
experimentally measured values (Spearman ρ = 0.79, P<1.9e-9, Figure S1b). KD-proliferation-170
scores are highly correlated with both the predicted proliferation levels (Spearman ρ = 0.75, 171
P<3.07e-8, Figure S1c) and the experimentally measured proliferation values (Spearman ρ = 0.82, 172
P<2.58e-10, Figure S1d). We also checked cross correlation values between KD-migration-score 173
and experimentally-measured proliferation values. Spearman correlation between KD-migration-174
score and experimentally-measured proliferation values (Spearman ρ = 0.47, P<0.0023) is 175
comparatively low. Similarly, Spearman correlation between KD-proliferation-score and 176
experimentally measured migration values (Spearman ρ = 0.55, P<0.00024) is also comparatively 177 low. 178 179 Subtype analysis 180
TNBC patients exhibit higher predicted migration than Luminal A patients (ANOVA, P<0.0024), 181
Luminal B patients (ANOVA, P<0.0059), and Her2 positive patients (ANOVA, P<0.049). The 182
mean value of the predicted migration also showed significant differences between all 4 subtypes 183
(ANOVA using 4 groups, P<0.015). 184
185
TNBC patients exhibit higher predicted proliferation than Luminal A patients (ANOVA, P<2.2e-186
16), Luminal B patients (ANOVA, P<2.2e-16), and Her2 positive patients (ANOVA, P<0.0014). 187
The mean value of the predicted proliferation also showed very significant differences between all 188
4 subtypes (ANOVA using 4 groups, P<2.2e-16). 189
190
Luminal A has significantly lower predicted proliferation compared to Luminal B (ANOVA, 191
P<0.0015). 192
193
We, however, did not find a statistically significant difference between predicted migration levels 194
of Luminal A patients and Luminal B patients (ANOVA, P<0.88), and between predicted 195
migration levels of Luminal A patients and Her2 positive patients (ANOVA, P<0.58). 196
197
Robustness of cell migration measurements
198
We show that migration experiments that we used are robust in different assay conditions and the 199
conclusions of our study are robust to assay conditions. We would like to make the following 200
points: 201
202
2D migration assays have many shortcomings and like many other in vitro assays, it is far from 203
perfect. However, we explain below why the 2D assay we used is a good in vitro system to model 204
cancer migration: they can capture clinical and pathological parameters, and are robust with other 205
migration assays. Finally, we also detail robustness of in silico in our findings. 206
207
We use live cell imaging-based random cell migration assays for measuring migration values in 208
43 breast cancer cell lines, which has often been extensively used in the research community10–16 209
and has been validated by previous work17–22 including ours (Van De Water’s lab). In addition, we
210
provide two additional analyses reinforcing 2D assays can capture clinical and pathological 211
parameters: 212
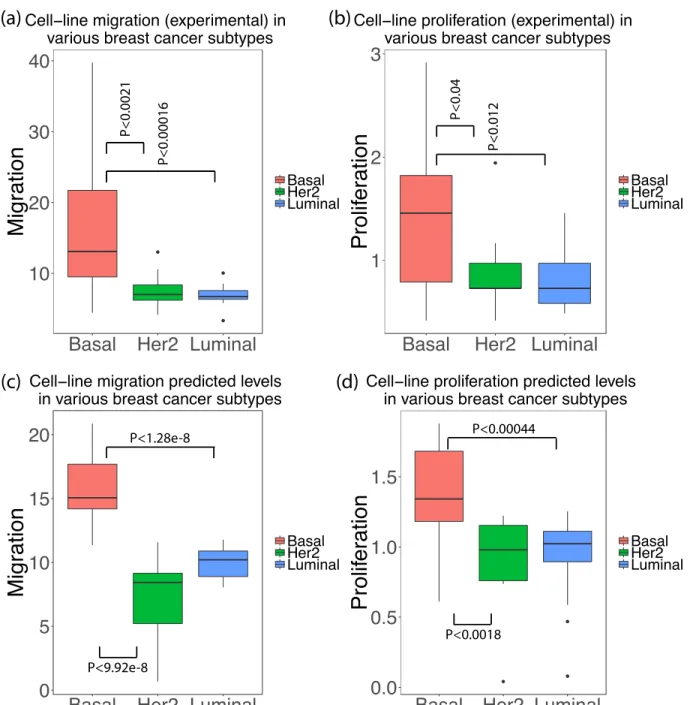
(a) Figure S3a shows that the experimentally measured migration values in the various breast 214
cancer cell lines using the live cell imaging-based random cell migration assays. We see that 215
Basal (Triple negative breast cancer) cell lines are much more motile than Luminal (Wilcoxon 216
test, P<0.00016) and Her2 positive (Wilcoxon test, P<0.0021) cell lines as expected. Since we 217
know that breast cancer patients with Basal subtypes are highly metastatic23, the cell line
218
measurements using the live cell imaging-based random cell migration assays recapitulates 219
what we expect physiologically in the clinic. 220
221
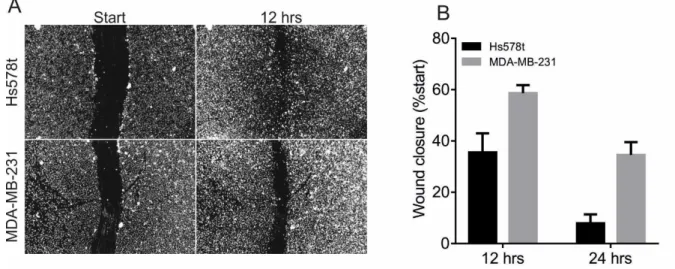
(b) We show that the migration values measured using live cell imaging-based random cell 222
migration assays are robust in another standard 2D migration assay which is the wound healing 223
assay. In Figure S4, we show that Hs578t cell line closes much faster the created wound than 224
the MDA-MB-231 cell line, which is reproducible with the highest speed of Hs578t cells 225
measured in the live cell imaging-based random cell assay. That is even though both Hs578t 226
and MDA-MB-231 are known to be highly migratory, we see that Hs578t has more motility 227
than MDA-MB-231 in two assay conditions. This shows that the relative ranking of the cell 228
lines is representative of the intrinsic motility capacity of the breast cancer cell lines and hence 229
the CellToPhenotype predictors will not be affected by the assay conditions. 230
231
Regarding the robustness of our conclusions: We found that 2D migration assays could predict 232
patient survival, is based on two different predictors: (a) CellToPhenotype which uses live cell 233
imaging-based random cell migration assays; and (b) siRNA-based predictor which uses 234
Phagokinetic track (PKT) assays. Since we independently arrived at the same conclusion by using 235
two different experimental (imaging and PKT) assays, it enhances the robustness of our 236
conclusions. 237
238
Not only the migration assays but also in vitro proliferation assays suffer from disparities in vivo 239
phenotype24. The central basis of our story is: given experimentally measured migration values in 240
cell lines from a standard assay commonly used in the research community (irrespective of whether 241
they are good or bad), can we learn signatures to effectively predict migration levels in patients; 242
and are such predictions associated with patient survival? Our study finds that to be true. 243
Circulating tumor cells have high migration levels
245
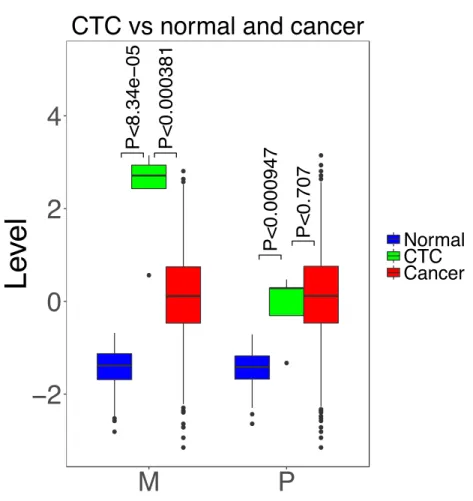
We applied the CellToPhenotype predictors to predict the migration and proliferation levels in 5 246
samples of circulating breast tumor cells (CTCs) in GSE45965 data25, and compared it with the 247
110 normal breast samples and 1043 cancerous samples from breast cancer TCGA data. While 248
predicting migration and proliferation levels in GSE45965 data, we overlapped the survival 249
associated genes in METABRIC dataset with the genes in the GSE45965 data, for building models 250
using CellToPhenotype predictors. We find that CTC samples have significantly higher migration 251
levels than both the TCGA cancer samples (P<3.81e-4) and the healthy adjacent samples 252
(Wilcoxon rank sum, P<8.34e-5). The CTC samples have significantly higher proliferation levels 253
than the non-cancerous samples (P<9.47e-4), but not significantly higher than the cancer samples 254
(P<0.71, Figure S6). 255
256
One weakness of this analysis is that there we have only 5 CTC samples, and therefore we carried 257
out some additional statistical tests for the sake of robustness. We repeated the analysis using an 258
ANOVA test26 to find similar results. An ANOVA test between predicted migration levels for 259
CTC samples are higher compared to both cancers (P<5.9e-08) and healthy adjacent samples 260
(P<2.2e-16). An ANOVA test between predicted proliferation levels for CTC samples are higher 261
compared to non-cancerous samples (P<2.2e-16) but not with cancer samples (P<0.72). These 262
findings are similar to what we obtained using a Wilcoxon test in Figure S6. A two-sample Fisher-263
Pitman permutation test27,28 showed a significant difference between the means of predicted 264
migration of CTC samples with cancer samples (P<7.13e-08), and between CTC samples with 265
normal samples (P<2.2e-16). There is also a significant difference between the means of the 266
predicted proliferation of CTC samples with normal samples (P<2.2e-16), and there is no 267
significant difference between CTC samples with cancer samples (P<0.72). 268
269
References
270
1. Barretina, J. et al. The Cancer Cell Line Encyclopedia enables predictive modelling of 271
anticancer drug sensitivity. Nature 483, 603–607 (2012). 272
2. Therneau, T. A Package for Survival Analysis in S. R package version. Survival (2012). 273
3. Friedman, J., Hastie, T. & Tibshirani, R. Regularization Paths for Generalized Linear 274
Models via Coordinate Descent. J. Stat. Softw. 33, (2010). 275
4. Freedman, D. A. Statistical models: Theory and practice. Statistical Models: Theory and 276
Practice (2009). doi:10.1017/CBO9780511815867
277
5. Tibshirani, R. Regression Shrinkage and Selection via the Lasso Robert Tibshirani. J. R. 278
Stat. Soc. Ser. B (1996). doi:10.1111/j.1467-9868.2011.00771.x
279
6. Homrighausen, D. & McDonald, D. The lasso, persistence, and cross-validation. in 280
Proceedings of the 30th International Conference on Machine Learning (2013).
281
7. Wang, S., Nan, B., Rosset, S. & Zhu, J. Random lasso. Ann. Appl. Stat. (2011). 282
doi:10.1214/10-AOAS377 283
8. Chattefuee, S. & Hadi, A. S. Regression Analysis by Example. John Wiley & Sons. (2015). 284
doi:10.1002/0470055464 285
9. Bilal, E. et al. Improving Breast Cancer Survival Analysis through Competition-Based 286
Multidimensional Modeling. PLoS Comput. Biol. 9, (2013). 287
10. Van Roosmalen, W. et al. Tumor cell migration screen identifies SRPK1 as breast cancer 288
metastasis determinant. J. Clin. Invest. 125, 1648–1664 (2015). 289
11. Mathieu, E. et al. Time-lapse lens-free imaging of cell migration in diverse physical 290
microenvironments. Lab Chip (2016). doi:10.1039/c6lc00860g 291
12. Rajesh Kumar, M. & Joice Sophia, P. Nanoparticles as precious stones in the crown of 292
modern molecular biology. in Trends in Insect Molecular Biology and Biotechnology 293
(2018). doi:10.1007/978-3-319-61343-7_16 294
13. Peeters, M. C. et al. The adhesion G protein-coupled receptor G2 (ADGRG2/GPR64) 295
constitutively activates SRE and NFκB and is involved in cell adhesion and migration. 296
Cell. Signal. (2015). doi:10.1016/j.cellsig.2015.08.015
297
14. Van Roosmalen, W., Le Dévédec, S. E., Zovko, S., De Bont, H. & Van De Water, B. 298
Functional screening with a live cell imaging-based random cell migration assay. Methods 299
Mol. Biol. 769, 435–448 (2011).
300
15. Tasdemir, N. et al. Comprehensive phenotypic characterization of human invasive lobular 301
carcinoma cell lines in 2D and 3D cultures. Cancer Res. (2018). doi:10.1158/0008-302
5472.CAN-18-1416 303
16. Meyer, A. S. et al. 2D protrusion but not motility predicts growth factor-induced cancer 304
cell migration in 3D collagen. J. Cell Biol. (2012). doi:10.1083/jcb.201201003 305
17. Naffar-Abu-Amara, S. et al. Identification of novel pro-migratory, cancer-associated 306
genes using quantitative, microscopy-based screening. PLoS One (2008). 307
doi:10.1371/journal.pone.0001457 308
18. Herber, R. L. & Hulkower, K. I. Cell Migration and Invasion Assays as Tools for Drug 309
Discovery. Pharmaceutics (2011). doi:10.3390/pharmaceutics3010107 310
19. Lavelin, I. et al. Discovery of novel proteasome inhibitors using a high-content cell-based 311
screening system. PLoS One (2009). doi:10.1371/journal.pone.0008503 312
20. Le Dévédec, S. E. et al. Systems microscopy approaches to understand cancer cell 313
migration and metastasis. Cellular and Molecular Life Sciences (2010). 314
doi:10.1007/s00018-010-0419-2 315
21. Van Roosmalen, W. et al. Tumor cell migration screen identifies SRPK1 as breast cancer 316
metastasis determinant. J. Clin. Invest. (2015). doi:10.1172/JCI74440 317
22. Le Dévédec, S. E., Lalai, R., Pont, C., De Bont, H. & Van De Water, B. Two-photon 318
intravital multicolor imaging combined with inducible gene expression to distinguish 319
metastatic behavior of breast cancer cells In Vivo. Mol. Imaging Biol. (2011). 320
doi:10.1007/s11307-010-0307-z 321
23. Chikarmane, S. A., Tirumani, S. H., Howard, S. A., Jagannathan, J. P. & Dipiro, P. J. 322
Metastatic patterns of breast cancer subtypes: What radiologists should know in the era of 323
personalized cancer medicine. Clinical Radiology (2015). doi:10.1016/j.crad.2014.08.015 324
24. Gao, H. et al. High-throughput screening using patient-derived tumor xenografts to predict 325
clinical trial drug response. Nat. Med. (2015). doi:10.1038/nm.3954 326
25. Lang, J. E. et al. Expression profiling of circulating tumor cells in metastatic breast 327
cancer. Breast Cancer Res. Treat. 149, 121–131 (2015). 328
26. Cuevas, A., Febrero, M. & Fraiman, R. An anova test for functional data. Comput. Stat. 329
Data Anal. (2004). doi:10.1016/j.csda.2003.10.021
330
27. Hothorn, T., Hornik, K., Wiel, M. A. van de & Zeileis, A. Implementing a Class of 331
Permutation Tests: The coin Package. J. Stat. Softw. (2008). doi:10.18637/jss.v028.i08 332
28. Neuhäuser, M. & Manly, B. F. J. The Fisher-Pitman Permutation Test When Testing for 333
Differences in Mean and Variance. Psychol. Rep. (2004). doi:10.2466/pr0.94.1.189-194 334
335 336 337
338 339
Supplementary Figures
340 341 342 343 344Figure S1: Spearman correlation between KD-migration-score: (a) with predicted migration
345
levels (CellToPhenotype); (b) with experimentally measured migration values, on 40 breast cancer
cell lines. Spearman correlation between KD-proliferation-score: (c) with predicted proliferation
347
levels; (d) with experimentally measured proliferation values.
348 349
350 351
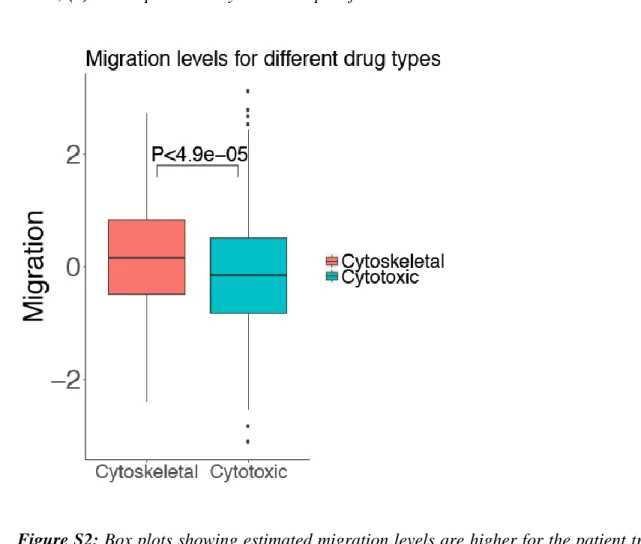
Figure S2: Box plots showing estimated migration levels are higher for the patient treated with
352
cytoskeletal drugs for the patients treated only with cytotoxic drugs (Wilcoxon rank-sum,
P<4.9e-353
5).
354 355
356
Figure S3: (a) Experimentally measured migration values in various breast cancer subtypes
(cell-357
lines). (b) Experimentally measured proliferation values in various breast cancer subtypes
(cell-358
lines). (c) Predicted migration levels in various breast cancer subtypes (cell-lines). (d) Predicted
359
proliferation levels in various breast cancer subtypes (cell-lines). We see that the predicted and
360
experimentally measured migration values behave similarly across various breast cancer subtypes
361
(similar results for proliferation).
362 363 364
365
366
Figure S4: Wound healing assay of both basal B Hs578t and MDA-MB-231 cell lines show that
367
Hs578t closes the wound much faster than MDA-MB-231 at similar cell density. Bar graph
368
represent the standard error of the mean (SEM, n=12 per cell line).
369 370 371 372 373 374
375 376
Figure S5: Predicted migration (M) and Proliferation (P) levels using CellToPhenotype
(LASSO-377
based) predictors for a single patient for 10 iterations. The predicted values are quite consistent
378
over various iterations.
379 380 ●
0.0
0.5
1.0
M
P
L
e
v
e
l
Phenotype M P381 382 383 384 385 386 387 388 389 390 391 392 393 394 395
Figure S6: Predicted migration (M), proliferation (P) levels of 5 samples of circulating tumor
396
cells (CTC) from GSE45965 data, compared with the 110 noncancerous samples and 1043 breast
397
cancer TCGA samples.
398 399 400