Analyzing How Optimization Features Impact People's Use of Design Tools
by
Elizabeth Gaylord
Submitted to the Department of Mechanical Engineering in Partial Fulfillment of the Requirements for the Degree of
Bachelor of Science in Mechanical Engineering
at the
Massachusetts Institute of Technology
June 2018
C2018 Massachusetts Institute of Technology. All rights reserved.
Signature redacted
Signature of Author: ...
Si
Certified by:...
bhrepartmetf
'of Nah ianical Engineeringnature redacted
*f'aria Yang Associate Professor of Mechanical Engineering Thesis Supervisor
Signature
Certified by: ... MASSACHUSETTS INSTITUTE 0: 7ECHNOLOGYredacted
Rohit Karnik Associate Professor of Mechanical Engineering Undergraduate OfficerAnalyzing How Optimization Features Impact People's Use of Design Tools
by
Elizabeth Gaylord
Submitted to the Department of Mechanical Engineering on May 18, 2018 in Partial Fulfillment of the
Requirements for the Degree of
Bachelor of Science in Mechanical Engineering
ABSTRACT
Design is the first step in creating a product but can be the most challenging. Much design software has been created to meet these needs, but these tools consider only a small part of the design process. This limitation stunts creativity and provides challenges to designers when trying to solve complex problems. Better tools take into account the needs of designers throughout the process of creating, analyzing, and optimizing designs. To provide the best integrated solutions, it is necessary to determine what features of analysis and optimization most help designers explore the solution space and ultimately create better physical designs. Tacit was developed as research tool to create simple designs with analysis and optimization built-in to the software. The most optimized version of Tacit was used as the control in a new study, which utilized two new versions excluding certain optimization features. A comparison between these versions was done to examine how optimization features impacted overall result, solution space exploration, and user experience. The usefulness of these optimization features is highly dependent on the type of problem being solved, and these features do not guarantee the best solution or sufficient exploration of the design space. Results from this experiment allow researchers to identify what is most useful to designers and how better to design tools to help them.
Thesis Supervisor: Maria Yang
Acknowledgments
I would like to express my deepest thanks to those who made this work possible. First of all, many thanks to Professor Maria Yang, who turned my nebulous rant about user design into a real thesis and provided support, resources, and much flexibility throughout the course of this process. In addition, endless thanks to Ned Burnell, who provided life advice, spiritual guidance, and technical support at every step of my thesis from ideation to completion.
Table of Contents
Abstract 2 Acknowledgements 3 Table of Contents 4 List of Figures 5 List of Tables 6 1. Introduction 7 2. Background 82.1 How People Design 8
2.2 Why Design Tools Matter 8
2.3 Tacit 8
2.4 Previous Tacit Study 10
3. Optimization Features Study 12
3.1 Description of Software 12
3.2 Experimental Procedure 12
4. Results and Discussion 15
4.1 Results from Bridge Problem 15
4.2 Results from Road Sign Problem 17
4.3 User Experience 19
5. Conclusions and Future Work 20
List of Figures
Figure 1: Optimized Tacit Interface 9
Figure 2a: Design-Only Tacit Interface 10
Figure 2b: Design and Analysis Tacit Interface 10
Figure 3a: Introductory Illustration for Road Sign 12
Figure 3b: Introductory Illustration for Bridge 12
Figure 4: Tacit Tutorial for Optimized Tool 14
Figure 5: Bridge Trajectories 15
Figure 6: Bridge Costs 16
Figure 7: Bridge Costs versus Time 16
Figure 8: Road Sign Trajectories 17
Figure 9: Road Sign Costs 18
List of Tables
Table 1: Problem and Tool Permutations 13
1. Introduction
In the early days of designing and manufacturing products, manufacturing was the limiting process. Certain complex designs were infeasible to produce and the creativity of designers drove advances in the field of manufacturing, the "over the wall" approach [1]. The introduction of additive manufacturing allowed manufacturers to produce designs of incredible complexity and design has become the lagging field. Designers rely on software tools to turn their ideas into a manufacturable form, and these tools fail to allow designers to utilize the increased complexity available [2]. Additive manufacturing allows for a single tool to have multiple. In taking 272 parts and creating "remixes" for additive manufacturing, Perez et al. found more than a quarter of the new parts involved unique integrations of multiple functions [3]. This increased integration in products requires increased integration in the tools used to design them.
Currently, creating parts for additive manufacturing requires the utilization of a number of tools: design tools such as CAD software, analysis tools like finite element solvers, and computational optimization tools. The typical use of these tools is to create an initial design in one, analyze it in one or more of the others, and then use that analysis to tweak for optimality without the aid of software. The three distinct processes of design, analysis, and optimization all require a different tool, if not a separate piece of software. Traditional programs like Dassault Systemes's SolidWorks include tools for analysis, but they are separate systems from the primary design functionality, not integrated into what the designer sees and designed to be used after the initial draft of the piece is complete. Many of these tools also leave fixing problems and optimization up to the designer. Newer tools such as Autodesk's DreamCatcher provide integration of the three processes, and this integration is expected to help designers produce better results.
To investigate the effects of integration of design, analysis, and optimization on the quality of designs, as well as the experience of the designer and the time needed to arrive at an idealized solution, a human subject based experiment was conducted to answer the following questions:
How do users approach various design problems with an integrated tool? What optimization features are most critical in helping users to explore the solution space of a problem and create
the best design in the shortest amount of time?
Multiple versions of a piece of design software were given to users attempting to solve two design problems. Each version includes a specific level of integration and different available analysis and optimization features but are virtually identical to the user. Users are expected to create the best designs with the control tool, which provides the most optimization features, and have more difficulty with versions of the software that exclude helpful features. A comparison between the results with each versions provides useful information on which features are most useful to users, which can then be used to create better design tools.
2. Background
Much research has been done on software tools for design, analysis, and optimization, but previous studies have focused on the development of tools and the efficiency of the algorithms involved. The focus of this study is the use of these tools and the impact of integration on the quality of the designs produced. Previous research in the area of tool integration has focused on individual case studies, not providing generalizable results [4, 5]. The choice and application of these tools affects the design process as well as the ultimate outcome, changing the way people initially approach a problem and influencing the extent to which they explore the solution space. Previous studies done with the design software being used for this study suggest integration improves the outcomes to such an extent it is difficult to compare between the integrated and un-integrated tools.
2.1 How People Design
More complex problems often lead to worse solutions [6], due to the difficulties designers face in exploring the design space. In an early study of how humans solve problems, Frey and Hirschi provided participants with coupled and uncoupled design problems and compared the times it took for them to reach a solution [7]. They found a dramatic increase in the time it took for participants to solve coupled problems. Those with more than four variables were reported to be particularly difficult and frustrating. Austin-Breneman et al. found that groups of graduate students, when asked to design a simplified satellite collaboratively, had difficulty due to the interactions of various subsystems and failed to explore the design space [8]. Interviews with space system designers revealed teams in industry often struggled to explore different solutions due to the restriction of important information by other teams [9]. Neeley et al. found designers tended to produce more satisfactory outcomes when given the opportunity to explore the design space more in initial stages [10]. The ability to explore the solution space is crucial when solving a design problem but is often hindered when using current design software.
2.2 Why Design Tools Matter
The design tools people use change the way they respond to design challenges. A study of desalination systems found novices could explore the space around complex solutions almost as well as experts when provided with the proper software [11]. While software like CAD makes the design process quicker and provides compatibility with manufacturing processes, it can also inhibit creativity. The creation of digital models requires time and effort from the designer and they become invested, making them less likely to discard it. This phenomenon is known as "premature fixation" [12, 13], and provides information not only about the design tool, but the way it is used. Focusing less on the efficiency of the tool and more on the way that the designer interacts with the tool and how it effects the overall design process will allow for the creation of better tools, ones that support designers in generating the best solutions.
2.3 Tacit
Tacit was designed as a research tool to study integration in design tools [14]. Tacit is a design tool for the creation of 2D linear trusses, a simple enough structure to analyze and optimize in real time but also providing a design challenge to study participants. The primary
metrics by which designs are measured are mechanical feasibility and cost of materials. Redundant beams have no cost because their size can be reduced to zero when optimized. Infeasible designs, which include beams under axial stresses greater than the chosen limit, have infinite cost. While many other considerations go into the costing and creation of real-life truss structures, considering only material costs is a traditional approximation in structural engineering. Design for additive manufacturing favors a biomimetic appearance, an elegant structure comprises of many smaller connection, as opposed to the standard simplicity as elegance school of thought. However, this added complexity does not significantly raise the cost when structures are created with additive manufacturing.
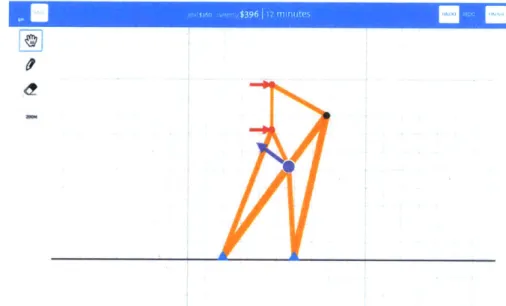
Tacit, in its fully integrated form, provides analysis and optimization features to the user. Cost and structure analysis are done in real time, returning evaluations of performance in twenty milliseconds. Optimization includes arrows indicating in which direction joints should be moved to reduce cost and dynamically optimizing beam width for best outcome. A save function is provided to allow users to revisit older designs. The interface, shown in Figure 1, is simple, providing the user with three cursor modes (move, draw, and erase), a zoom option, the ability to undo and redo actions, and a toolbar displaying goal cost, current cost, and time.
Figure 1: Interface of Tacit, showing functions offered to designers. These include three cursor modes, a zoom option, the save function, the goal cost and current cost, the remaining time (for timed trials), undo and redo options, and a finish button.
The tool was initially built to test the usefulness of integrated tools in a research setting and began with three versions with different levels of integration. The first version (D) provided design and analysis tools in separate windows, only updating the analysis window when a user clicked the 'Analyze' button. The analysis consisted of bar coloring indicating what sections of the truss were under the most stress, as shown in Figure 2a. This is the standard workflow of a CAD tool like SolidWorks followed by an analysis tool like Abaqus. The second version (D+A) integrates the two views and includes real-time analysis, updating the colors of the bars as they were moved. The second version is shown in Figure 2b and demonstrates the current direction of commercially available design software.
Figure 2: (a) First interface of Tacit, including design tools and analysis tools in separate
windows. (b) Second interface of Tacit, integrating the design and analysis tools into one design representation and updating in real time [14].
The final, most integrated version (D+A+O), shown in Figure 1, includes all of the analysis and optimization tools built into Tacit. Colored bars are exchanged for dynamically-optimized self-sizing bars using an established linear programming formulation [15] and purple arrows indicate the optimal position of each node. This is the idealized version that may be used in the future for software packages like DreamCatcher.
2.4 Previous Tacit Study
In the initial study, participants were asked to design two structures using Tacit. The first, demonstrated in Figures 1 and 2, was a windblown road sign (cantilever) and the second was a bridge. These problems were chosen in part because they represent real world situations participants would be familiar with. Each problem also allows for simple and complex solutions, with the road sign problem having an optimal solution of a fractal Michel truss [16]. 60 MIT undergraduate and graduate students were recruited to participate in the study, the only requirement being a familiarity with basic mechanics. Each student was given the two structural truss problems and asked to solve each with a different version of the software. A survey following each problem assessed their reaction to the design process.
Results showed participants using more integrated tools explored the solution space more thoroughly and produced a better result faster. A significant difference was shown between the
(D) and (D+A+O) results on both problems and between the (D+A) and (D+A+O) results on the
road sign problem. The top 50% of (D+A+O) designers reached costs lower than those of any designer using the other two tools. However, the differences between the (D) and (D+A) results were found to be insignificant for both problems. The integration of only analysis with design was either not a significant help or a slightly hindrance, depending on the participant. (D+A) designers may have "missed the forest for the trees," optimizing member size instead of exploring the design space.
Complexity for the 2D trusses created with Tacit is measured by the number of members present in the design. Each one adds to the cost, requires further optimization, and provides a point of failure. Participants with all versions of the software explored similar levels of complexity for the bridge problem, which was expected to be more familiar and have a more intuitive solution. For the road sign problem, designers with (D+A+O) explored 20% more
complexity but ended up with twice the number of beams of those with the (D) tool on average. Many users of less integrated tools who had complex designs had higher cost designs as well.
In terms of efficiency, designers with the more integrated tools (D+A+O) and (D+A) generally converged on their final solution much more quickly. 75% of participants with the (D+A+O) tool had a better design after three minutes than 75% of the participants with the other two tools ever would. The results of this Tacit study indicate that the integration of other features, especially optimization features, into design tools provides better solutions faster.
3. Optimization Features Study
For this study, further tests were run with two new versions of Tacit and the optimized version (D+A+O) from the previous study was used as a control. These versions exclude specific optimization features in an attempt to better understand the usefulness of each of them. The problems used in the experiment were the same as those used in the previous experiment so that they would be easily comparable. It is expected that both of the new versions will produce worse results than those of the optimized version, as every optimization feature being tested is assumed to be helpful.
3.1 Description of Software
The optimized version from the previous study (D+A+O), now referred to simply as version (C), will be used unchanged to allow for direct comparison between the new and previous studies. The first of the new tools, version (A), provides similar optimization, including dynamic beam sizing, but no arrows indicating the ideal location for each node. The second of the new tools, version (B), includes all the same features as (A) but slows down the tool considerably. Instead of the beam sizing evaluations being returned every 10 milliseconds, the information is returned every 200 milliseconds, resulting in a perceptible lag. Both (B) and (C) are expected to hinder people when compared to (B) but will give insight into the usefulness of each particular tool.
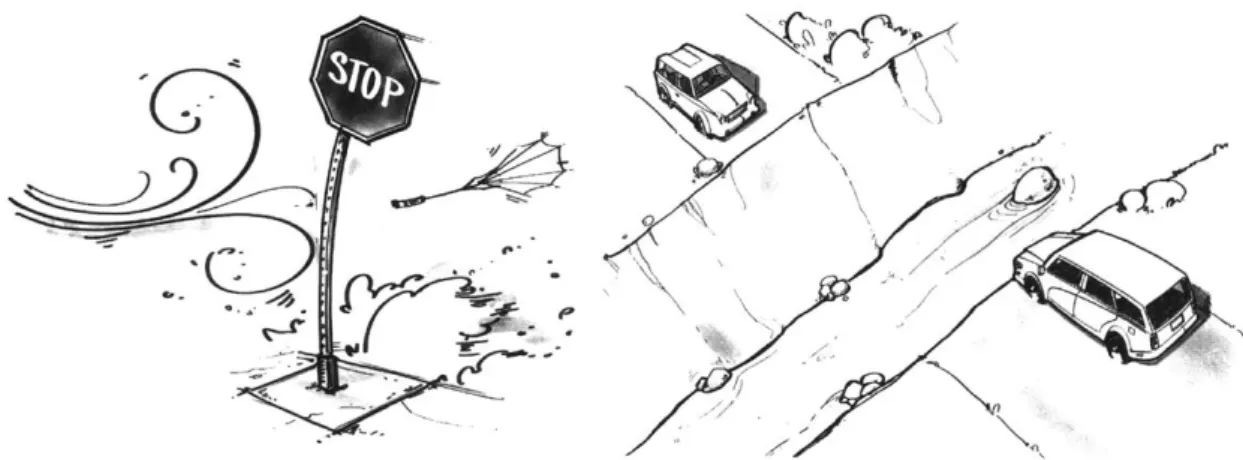
The two design problems encoded in the software, used by both this study and the previous Tacit experiment, are the bridge and the windblown road sign (cantilever). To prevent participants from becoming fixated on a particular truss design when being introduced to these problems, specific illustrations without a proposed solution are shown. The illustrations shown to participants before beginning the problem are shown in Figure 3.
wo--Figure 3: The illustrations displayed to introduce each design problem, deliberately not
showing any trusses (a) The real-life situation for the windblown road sign (cantilever).
(b) The real-life situation for the bridge [14].
3.2 Experimental Procedure
Twelve undergraduate students from a variety of departments participated in pilot studies, all having completed the required undergraduate physical mechanics course and thus having a basic knowledge of mechanics. All students were female, though they were not recruited
intentionally by gender. After being given an overview of the procedure, participants were set up at an Apple Macbook Pro and told to adjust trackpad settings as preferred. Each participant was assigned to a bin specifying which combination of problem and tool order they would see. Participants were expected to perform better with the second problem that they worked on, due to increased familiarity with both trusses and the software itself, so it was important for each problem and tool to be used both first and second.
Problem 1 Tool 1 Problem 2 Tool 2
1 Bridge B Sign A 2 Sign A Bridge C 3 Bridge C Sign A 4 Sign A Bridge B 5 Bridge C Sign B 6 Sign B Bridge C 7 Bridge A Sign B 8 Sign B Bridge A 9 Sign C Bridge A 10 Bridge B Sign C 11 Sign C Bridge B 12 Bridge A Sign B
Table 1: Details of bin assignments for each participant. For example, participants in bin one would use tool B to solve the bridge problem and tool A to solve the sign problem.
The first step in the trial was a survey on the participant's current emotions, asking them to rank their current state in terms of twenty different emotions (including hostile, interested, excited, etc.) on a five-bin scale ranging from 'Not at all' to 'Extremely.' This was followed by a short quiz on truss structures to both gauge their current knowledge of the underlying principles and teach (as necessary) the basic information necessary to complete the design problems that followed. The quiz was followed by the first problem. Each problem consisted of a tutorial, the problem itself, and an affect quiz immediately after. This setup was used for the previous Tacit experiment and was found to be successful, though the affect study was altered to prevent participants from continually answering neutrally. The affect study includes the initial screens gauging emotions, a new edition, and the surveys following each problem, which ask similar questions but provide participants with a larger range (nine options ranging between two extremes). The computer-guided tutorial, shown in Figure 4, helped the user through creating and analyzing a simplistic brace, focusing more on teaching participants about the specific user interface for the tool being tested than teaching them how to solve truss problems.
SAVE UNDO FINISH
STEPSOF26
Great! Now connect that node to the hrthree corners so that it
. lookslike this:
andthen saveyourdesign.
Figure 4: The tutorial for (C), the fully optimized version of Tacit. The usual tool interface is displayed next to their current task, and as tasks are completed, participants are free to advance at their own pace [14].
Participants then completed the associated problem and filled out a post-problem survey on their experience working with the tool and solving the problem. This process repeated for a second problem, with the second tutorial being slightly shorter and focusing on aspects that may have changed between versions of the tool. During the second post-problem survey, participants had access to and the ability to change their answers to the initial post-problem survey. The last screen of the study simply asked the users demographical questions.
Overview 5 minutes
Pre-survey and quiz 15 minutes Tutorial for tool 1 10 minutes
Problem 1 15 minutes
Post-problem survey 1 5 minutes Tutorial for tool 2 5 minutes
Problem 2 15 minutes
Post-problem survey 2 5 minutes
Table 2: Approximate timing for the overall study, providing realistic estimates for time needed for
tutorials and rounding the time available for each problem from 12 minutes to 15 minutes for scale. The full experiment requires approximately an hour, though many participants did not need the full time. The tutorial allows for up to twenty minutes but can be completed in a much shorter time span. Each problem is timed at twelve minutes, though participants can move on from the problem at any time. Due to the timed nature of the problems, total time primarily depended on the tutorials and surveys.
4. Results and Discussion
Each participant completed the study in full within thirty-five minutes, with an average time of 29:59. Most participants found a design to be satisfactory when it was less than the goal cost. Overall, the outcomes of the design problems were not significantly affected by slowing down the optimization features and the loss of arrows was only impactful on the bridge problem. However, the slowest version (B) did hinder the exploration of the solution space in the bridge problem compared to the other two tools; all three tools resulted in this lack of exploration for the road sign problem. The version with the most optimization features (C) did not consistently provide the best solution, as it did in the previous study, indicating only certain features aided in the production of the best solution for each problem. The usefulness of optimization features
appears, from this study, to be strongly dependent on the type of problem.
4.1 Results from Bridge Problem
User results from the bridge problem suggest slowing down the tool does not have a tremendous effect on the ultimate outcome but does affect the extent to which participants explored the solution space of the problem. The trajectories for each participant's solution to the bridge problem, shown in Figure 5, illustrate the lack of exploration with (B) compared to the trajectories from (A) and (C).
All Bridge trajectories
1500 1500 ~~ 1000
/
2000 1200 100 io2
41
441
1
lime since start [in]
Figure 5: Full trajectories from each participant attempting to solve the bridge problem. (B) is shown in red and illustrates the least exploration of the solution space. (A) is shown in purple and demonstrates some exploration but lacks quick convergence to a low-cost solution. (C) is shown in orange and demonstrates both solution space exploration and convergence to an optimal solution.
For the bridge problem (C) produces consistently good results, with all users converging to an optimal solution after exploring the solution space. However, (B) ultimately supplied better solutions, with one outlier, as shown below in Figure 6. (A) provided inconsistent results, with
optimization feature the other two tools provide. Users of (A) who provided low-cost solutions still did not provide solutions equal or lower in cost to those using (B) or (C).
Best cost (Bridge)
2500 2000 1500 1000 U a 500 200 ms Gm no GBG, IOins 10 ms
Figure 6: Graph of cost for each participant on the bridge problem (B) is shown in red
and shows largely optimal solutions, with one outlier. (A) is shown in purple and shows the difficulty of users to reach an optimal solution without guidance from the software.
(C) is shown in orange and shows entirely optimal solutions, though some were worse
than those provided by participants using (B).
As shown in Figure 7, (B), on average, produced better results than even (C), the most integrated version of the tool, though the top 25% of designs from (C) were better than the top
25% of designs from (B). (A) provided the worst costs on average, with the top 25% falling well below the medians for both of the other tools.
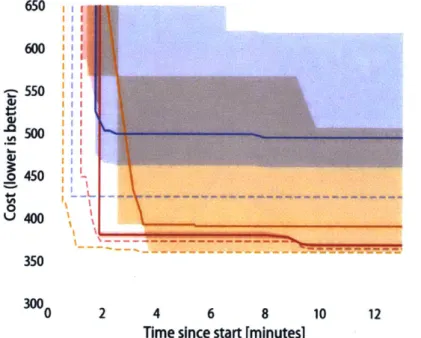
U, I-U, 0 U 650 600" 550 i 500" 450
:
I M .1 'a I. 'U g!I~II
350 30 0 2 4 6 8Time since start [minutes]
10 12
Figure 7: Graph of cost solutions for each participant on the bridge problem with respect
to time. The dashed line represents the top 25% and the solid line represents the median; the shaded regions show the area between the top 25% and 75%. (B) is shown in red and
______________________________ -1
shows quick convergence on the best solution for both the average and top 35%. (A) is shown in purple, in which participants were able to converge on a solution quickly but did not approach the needed cost. (C) is shown in orange and shows the slowest average convergence on a best solution, but the fastest convergence on the best solution for the
top 25%.
For all three tools, the top 25% of participants neared their lowest cost solution in less than two minutes, with small modifications made within the first ten minutes to arrive at their ultimate solution. For both (A) and (B), the average participant neared their optimal solution in less than three seconds and made similar small modifications. (C) took the longest on average, with the median nearing an optimal solution in approximately four minutes, but the top 25% had the quickest convergence time and the best solution.
The results of the bridge problem suggest arrows are a crucial design features, allowing users of both (B) and (C) to reach optimal solutions. Speed at which the analysis is done did not seem to create a significant difference; participants using both (B) and (C) provided similar solutions in a similar timespan.
4.2 Results from Road Sign Problem
User results from the road sign problem suggest slowing down the tool does have an effect, though it is not a significant one. Users attempting the road sign also seemed less dependent on the arrows feature; (A) provided the best results, though designers did not converge on these optimal solutions as quickly as those using the other two tools. The trajectories for each participant's solution to the road sign problem, shown in Figure 8, illustrate the lack of exploration in all three version of the tool.
All Sign trajectories
0 9 9 5009 400 7 44 4 0% 9 99 9 9 300 600 Soo 00 300 600 0 2 4 6 8 10 12
Time since start [m)
Figure 8: Full trajectories from each participant attempting to solve the road sign problem. (B) is shown in red, (A) is shown in purple, and (C) is shown in orange; all
With all three tools, users did not explore the solution space to the extent they did with the bridge problem. Designers were able to quickly converge to a low-cost solution and did not feel the need to explore further in order to be satisfied with their solutions. These solutions, shown individually in Figure 9, do meet the standard desired for the structure and are consistent between participants for each individual tool.
Best cost (Sign)
1400 1200 1000 800 600 400 * 4 200 ms no GBG, 1Oms 1OiMs
Figure 9: Graph of solutions for each participant on the road sign problem (B) is shown in red and shows consistent, fairly optimal solutions. (A) is shown in purple and consistent and optimal results from each participant. (C) is shown in orange and shows consistent and low-cost results, with the exception of one outlier.
(B) and (A) produce results that are fairly optimal and consistent between different participants, with (A) providing lower cost solutions. (C) provides mostly consistent and optimal solutions, with one outlier of very high cost. As shown in Figure 10, (A) provides the best median solutions and (B) provides the worst.
ACA __ -h.. a, IA I-GJ 0 0 600 550 500 450 400 -2 4 6 8
Time since start [minutes]
10 12
350 3000
1 1
Figure 10: Graph of solutions for each participant on the road sign problem with respect
to time. The dashed line represents the top 25% and the solid line represents the median; the shaded regions show the area between the top 25% and 75%. (B) is shown in red and shows quick convergence to a non-optimal solution in both the median and top 25%. (A)
is shown in purple, with the top 25% converging within two minutes to the optimal solution and median converging quickly to an optimized solution. (C) is shown in orange and shows similar convergence to that of (A) and (B) but provides a less-than-optimal solution.
(A) produced the best results for both the average and the top 25%. However, the median of (A) converges to the best result slowly, taking over four minutes to approach its best solution. The top 25% of (A) users took two minutes to approach a near-optimal solution and later refined it. (B) produced the worst results, with the highest median cost. The top 25% of (B) users still produced a worse solution than the median user of (C). Both the top 25% and median user of (B) converged to their best solution in approximately a minute. The average and top 25% of (C) users produced a similar solution, with the top 25% converging in roughly two minutes and the median taking four, as (A) users did.
The results of the road sign problem, in contrast to those of the bridge problem, suggest arrows are not needed for users to reach an optimal solution. The results of both problems concur the slowing of the optimization features did not make a significant impact, which (B) produced the worst results in the road sign problem, they were not significantly different than those produced by (C) and convergence on one design happened in approximately the same amount of time. Surprisingly, with neither problem did (C), the most integrated tool, provide the best results, suggesting that simply having more integration features does not make a tool better. Instead, the integration features may need to be tailored to the type of problem (for example, arrows were useful for the bridge problem but less necessary for the road sign problem).
4.3 User Experience
While large differences of opinion often led to neutral averages, some patterns emerged during analysis of the results of the affect surveys taken by participants following each problem. Users were asked to rate on a scale from one to nine if solving the problem was frustrating or delightful, unsatisfying or satisfying, boring or fun, and rushed or relaxed, if using the software was hard or easy, tedious or fluid, helpful or unhelpful, and if the solution to the problem was expected or surprising, and uninspiring or inspiring. Participants found the software to be moderately unhelpful for every tool on both problems, suggesting either difficulties with the software or unawareness by users of how much analysis and optimization Tacit provides compared to standard tools. The latter would be reasonable given the minimal experience with CAD programs by many of the participants. In the creation of the road sign with (A) and the bridge with (C), the software was reported to be tedious to work with; oddly, this was not a complaint of those working with (B) which slowed down the optimization considerably. Users working with (A) found it moderately frustrating for both problems, suggesting the arrows at least provide designers emotional support, if not leading them to better outcomes. The bridge problem was reported to be less satisfying to solve but fun, while the road sign problem was often considered unsatisfying and frustrating. This is likely due to the fact that suspension bridges are common and participants had an idea of what the best structure would look like much earlier in the process.
5. Conclusions and Future Work
This study was designed to analyze how users take advantage of various levels of tool optimization and answer the questions:
How do users approach various design problems with an integrated tool? What optimization features are most critical in helping users to explore the solution space of a problem and create
the best design in the shortest amount of time?
The primary conclusion of this study is that the usefulness of optimization features is highly dependent on the type of problem being solved, and these features do not guarantee the best solution or sufficient exploration of the design space. The loss of arrows in version (A) was only impactful on the bridge problem, (A) providing the best solution to the road sign problem despite taking time to converge. (C), the most integrated version, did not consistently provide the best solution not the fastest convergence. The speed of optimization does not appear to have a strong effect on the overall outcomes: (B) provided the best solution to the bridge problem and a similar outcome to that of (C) in the road sign problem. The speed of optimization also did not affect the rate at which users converged on their best solution but did seem to hinder the exploration of the solution space in the case of the bridge problem. Users reported frustration when working with (A) and found the software to be moderately unhelpful in all cases, likely unaware of the analysis and optimization benefits the tool provides compared to the standard.
Further studies could be done on the usefulness of optimization features, including helping to identify which features are most useful for what types of problems and possibly why. Creating an online study with Tacit, not requiring direct interaction with a researcher, would allow the research to reach a broader population and variety of participants. Additional studies could be done of the optimization features, including updating the arrows to take advantage of local gradients rather than the global gradient (this causes some erratic behavior in the optimized tool) or testing other features. Similar studies could be done, integrating more of the design process into other types of software, allowing integrated features to become the standard for all engineering software.
Determining what optimization features are useful for what types of problems will allow for better designed software tools. Integrating design, analysis, and optimization into one tool will allow designers to create better parts, faster, but is also a considerable undertaking, and identifying what aspects are most important will make this integration easier on developers and more quickly available to the public. These better parts will allow designers to take advantage of the benefits of additive manufacturing and ultimately create better products.
6. References
[1] Boothroyd, G., 1987, "Design for Assembly-The Key to Design for Manufacture," Int J Adv Manuf Technol, 2(3), pp. 3-11.
[2] "How Rapid Manufacturing Could Transform Supply Chains - Manufacturing - CSCMP's Supply Chain Quarterly" [Online]. Available:
http://www.supplychainquarterly.com/topics/Manufacturing/scq2008O4rapid/. [Accessed: 01-Apr-2018].
[3] Perez, K. B. Anderson, D. S., and Wood, K. L., 2015, "Crowdsourced Design Principles for Leveraging the Capabilities of Additive Manufacturing," DS 80-4 Proceedings of the 20th International Conference on Engineering Design (ICED 15) Vol 4: Design for X, Design to X, Milan, Italy, 27-30.07.15 [Online]. Available:
https://www.designsociety.org/publication/37785/CROWDSOURCED+DESIGN+PRINCIP LES+FOR+LEVERAGING+THE+CAPABILITIES+OF+ADDITIVE+MANUFACTURIN G. [Accessed: 01-Apr-2018].
[4] Stern, M. L., 2015, "Aligning Design and Development Processes for Additive Manufacturing," Thesis, Massachusetts Institute of Technology.
[5] "A Generalized Optimality Criteria Method for Optimization of Additively Manufactured Multimaterial Lattice Structures I Journal of Mechanical Design | ASME DC" [Online]. Available:
http://mechanicaldesign.asmedigitalcollection.asme.org/article.aspx?articleid=2468634. [Accessed: 10-May-2018].
[6] Flager, F., Gerber, D. J., and Kallman, B., 2014, "Measuring the Impact of Scale and Coupling on Solution Quality for Building Design Problems," Design Studies, 35(2), pp.
180-199.
[7] Hirschi, N., and Frey, D., 2002, "Cognition and Complexity: An Experiment on the Effect of Coupling in Parameter Design," Res Eng Design, 13(3), pp. 123-131.
[8] "A Study of Student Design Team Behaviors in Complex System Design I Journal of Mechanical Design I ASME DC" [Online]. Available:
http://mechanicaldesign.asmedigitalcollection.asme.org/article.aspx?articleid=1 660766. [Accessed: 10-May-2018].
[9] Austin-Breneman, J., Yu, B. Y., and Yang, M. C., 2015, "Biased Information Passing Between Subsystems Over Time in Complex System Design," J. Mech. Des, 138(1), pp. 011101-011101-9.
[10] "Building Fast to Think Faster: Exploiting Rapid Prototyping to Accelerate Ideation During Early Stage Design
I
Volume 5: 25th International Conference on Design Theory and Methodology; ASME 2013 Power Transmission and Gearing Conference | IDETC/CIE2013 ProceedingsI
ASME DC" [Online]. Available:http://proceedings.asmedigitalcollection.asme.org/proceeding.aspx?articleid=1 830529. [Accessed: 01-Apr-2018].
[11] Yu, B. Y., 2015, "Human-Centered Approaches to System Level Design with Applications to Desalination," Thesis, Massachusetts Institute of Technology.
[12] Robertson, B. F., and Radcliffe, D. F., 2009, "Impact of CAD Tools on Creative Problem Solving in Engineering Design," Computer-Aided Design, 41(3), pp. 136-146.
Online Library" [Online]. Available: https://onlinelibrary.wiley.com/doi/abs/10.111 l/j.1540-5885.2012.00959.x. [Accessed: 01-Apr-2018].
[14] Burnell, E., Stern, M., Flooks, A., and Yang, M. C., 2017, "Integrating Design and Optimization Tools: A Designer Centered Study," ASME, p. V007T06A029.
[15] Freund, R. M., 2002, "Truss Design and Convex Optimization," p. 104.
[16] "Geometrical Aspects of Optimum Truss like Structures for Three-Force ProblemI SpringerLink" [Online]. Available: https://link.springer.com/article/I0.1007/sOO158-011
-0679-y. [Accessed: 01-Apr-2018].
[17] Randall, D. M., and Fernandes, M. F., 1991, "The Social Desirability Response Bias in Ethics Research," J Bus Ethics, 10(11), pp. 805-817.

![Figure 4: The tutorial for (C), the fully optimized version of Tacit. The usual tool interface is displayed next to their current task, and as tasks are completed, participants are free to advance at their own pace [14].](https://thumb-eu.123doks.com/thumbv2/123doknet/13996135.455433/14.917.242.689.83.315/figure-tutorial-optimized-version-interface-displayed-completed-participants.webp)